AZ Dynamic Trend Indicator with Heikin-Ashi### Dynamic Trend Indicator with Heikin-Ashi (v2.7)
**Effortlessly identify trends and reversals** with this versatile tool combining multi-timeframe analysis, adaptive moving averages, and Heikin-Ashi smoothing. Here's what it offers:
#### 🔍 **Core Features**
1. **Dual Timeframe Analysis**:
- Track trends on higher timeframes (e.g., 1H/D) while viewing signals on your current chart.
- Toggle between **Heikin-Ashi** or standard candles for cleaner trend visualization.
2. **8 Customizable MAs**:
- Choose from **ALMA, HMA, SMA, SWMA, VWMA, WMA, ZLEMA, or EMA** with adjustable periods.
- Unique "Trend Strength" metric: `(MA_Close - MA_Open) / (MA_High - MA_Low)` highlights momentum direction.
3. **Smart Signals**:
- **Entry/Exit**: Triangles mark crossovers between MA Close/Open.
- **Reversal Alerts**: Detects counter-trend moves within a user-defined window (default: 3 bars) after signals.
- Color-coded plots: Bullish (🟢), Bearish (🔴), Reversal Bull (🔵), Reversal Bear (🟠).
#### 🎨 **Visual Customization**
- Toggle **High/Low MA lines**, **Close line**, and **fill colors**.
- Adjust colors for all elements to match your chart theme.
- Hide signals or reversal markers as needed.
#### ⚙️ **Practical Use**
- **Trend Following**: Use the MA Close/Open crossover with trend fill colors to confirm direction.
- **Reversal Trading**: Capitalize on pullbacks with reversal signals (e.g., after a bearish signal, watch for Bull Reversal markers).
- **Multi-Timeframe Confirmation**: Avoid false signals by aligning higher-timeframe trends with your entries.
*Ideal for swing traders and trend riders!*
**Note**: Adjust `MA Period`, `Reversal Window`, and `Trend Timeframe` for your strategy. Disable Heikin-Ashi in choppy markets for faster reactions.
---
*Code v2.7 updates: Optimized reversal logic, added ALMA/ZLEMA support, and enhanced visual controls.*
Cycles

محدد الأوقات المطور جداً v6
Determine the candle times at any hour you want. If the strategy you are working on is CRT, specify the 4-hour frame and choose the time 1-5-9.

BTC Correlation CoefficientThe BTCUSDT Correlation Coefficient indicator measures the strength and direction of the relationship between the selected asset (e.g., a stock or altcoin) and the price of BTCUSDT over a chosen time period. It uses a custom correlation function to calculate how closely the asset's price movements align with Bitcoin, returning a value between -1 and +1. A coefficient near +1 indicates strong positive correlation, while values near -1 indicate inverse correlation. This helps traders assess whether the asset tends to follow Bitcoin’s price trends or behave independently, enabling more informed decisions on portfolio diversification and market sentiment alignment.


Khối Lượng WyckoffThis indicator combines Wyckoff logic, Smart Money Concepts (SMC), Order Blocks, Breaker Blocks, and Volume Trap detection.
It automatically highlights key market manipulation zones like Spring, Upthrust, and Break of Structure.
Ideal for traders following institutional footprints with multi-timeframe filtering

SequentialSMT+TCISDAn Extreme thought of Daye's Quarterly theory and SSMT + True Change In State of Delivery. this indicator detects SSMT between two pair on Daily cycle M5 and detecting the True Change In State of Delivery as entry point.

4shine buy & sell magic) v2Indicator using RSI + Dominant Cycle
Be cautious of trading volume.
If the volume is too low, this indicator may not be effective.
It is recommended to use this in accordance with your own trading strategy.
Easy life
Easy earn
Easy money
by 4shine (PJH)

EMA 200 & EMA 20EMA20\200 Golden & Death cross
you can use it for all time frame trading in market
it make more easy way to find the way for market if its going up or down

🧩Tawajoh +🧩Tawajoh + Indicator Explanation
The Tawajoh + indicator is a comprehensive technical analysis tool designed to provide a broad market perspective by combining several advanced analytical techniques into a single indicator.
Main Components:
Market Shift Logic:
This part uses the Hull Moving Average (HMA) to detect market shifts by comparing a fast HMA with a delayed one. When a crossover or crossunder happens, it defines a new "Shift Level" and displays labels showing volume or price data along with color-coded signals indicating the market direction.
Smoothed Heiken Ashi (SHA):
Applies smoothing on traditional Heiken Ashi candles using various moving averages (like LSMA, SMA, EMA, etc.) to provide clearer trend visualization with reduced noise and volatility.
HMA PLANz (Hull Moving Averages):
Plots two customizable moving averages (types include SMA, EMA, WMA, HMA) with user-defined source prices (close, high, low) and lengths, along with optional labels for easy identification.
High Liquidity Midline Logic:
Identifies the candle with the highest volume in a given period and plots a midpoint line (average of high and low) for that candle. The line color switches between green and red depending on the current close price position, and the high-volume candle is highlighted in yellow.
RSI 50 EMA Smoothed:
A refined RSI indicator smoothed using a custom EMA near the 50 level, offering precise signals with color changes based on price action and optional labels for clarity.
Volumatic Logic (Volume Dynamics):
Tracks volume trends using smoothed EMAs, plotting volume candles with dynamic colors and gradients that reflect uptrends or downtrends in volume strength, helping to confirm market momentum shifts.
How to Use Tawajoh + Indicator:
Detect Market Shifts: Watch the Market Shift levels and their labels for important turning points.
Read Overall Trend: Use the Smoothed Heiken Ashi candles and moving averages to identify the main trend with less noise.
Monitor Liquidity: The High Liquidity Midline helps spot potential support/resistance levels based on heavy trading activity.
Confirm with RSI & Volume: RSI signals around level 50 combined with volume dynamics give additional confirmation of trend strength or reversals.


Alt Market Index (Halving-Adjusted BTC Supply, EMA)
암호화폐 알트코인 시총 상위 125개를 모아서
나스닥 기반의 계산식을 활용한 알트코인지수125를 만들었습니다.
반감기에 따른 비트코인 하루 채굴량 갯수 추가까지 포함한 버전입니다.
일봉이 기준이 됩니다.
I created the Altcoin Index 125 by compiling the top 125 altcoins by market capitalization in the cryptocurrency market, using a calculation method based on the Nasdaq index.
This version also includes adjustments for Bitcoin’s halving events, reflecting changes in daily mining output. The index is based on daily candles.

Gold Trend Scalper [Strategy]This strategy identifies the main trend using a 200-period moving average and enters trades on pullbacks to a 21-period moving average. It automatically calculates position size based on a fixed percentage risk and sets a volatility-based stop-loss and take-profit using the Average True Range (ATR).

九转序列[We1h0]█ 九转序列 - 趋势衰竭与拐点探测器 (Sequence Counter - Trend Exhaustion & Reversal Detector)
▌ 摘要 (Summary)
中文:
本指标的灵感来源于一种经典的时间序列分析理论,旨在识别潜在的市场趋势衰竭点。它通过计算连续收盘价高于或低于特定周期前收盘价的K线数量,来量化趋势的“生命力”。当计数达到关键数字(如9或13)时,通常预示着当前趋势动力可能已经耗尽,市场面临回调或反转的风险。本版本提供了高度自定义的开关,允许用户自由选择关注的信号数字(7, 9, 13, 15),并集成了灵活的警报功能。
English:
Inspired by a classic time-series analysis theory, this indicator is designed to identify potential points of trend exhaustion. It quantifies the "lifespan" of a trend by counting the number of consecutive bars that close higher or lower than the close four bars prior. When the count reaches key numbers (such as 9 or 13), it often suggests that the momentum of the current trend may be depleted, and the market is at risk of a pullback or reversal. This version features highly customizable switches, allowing users to select which numerical signals (7, 9, 13, 15) to monitor, and includes an integrated, flexible alert system.
▌ 核心原理 (Core Concept)
上涨序列 (Sell Setup / Up Count): 当一根K线的收盘价高于其前方第4根K线的收盘价时,计数器会递增。这构成了一个上涨序列。
下跌序列 (Buy Setup / Down Count): 当一根K线的收盘价低于其前方第4根K线的收盘价时,计数器会递增。这构成了一个下跌序列。
当序列计数达到“9”,通常意味着趋势的“设置”阶段已经完成,为潜在的反转做好了准备。
▌ 主要功能 (Key Features)
自动序列计数 (Automatic Sequence Counting):
自动追踪并计算上涨和下跌序列。
Automatically tracks and counts both uptrend and downtrend sequences.
关键数字标记 (Key Number Labeling):
在图表上清晰地标记出数字 7, 9, 13, 15,帮助您快速识别潜在的交易机会。
Clearly labels the key numbers 7, 9, 13, and 15 on the chart to help you quickly identify potential trading opportunities.
高度自定义开关 (Highly Customizable Switches):
用户可以在设置中自由选择启用或禁用任何一个数字信号的显示和警报,让分析更专注。
Users can freely enable or disable the display and alerts for any numerical signal in the settings, allowing for a more focused analysis.
集成化警报系统 (Integrated Alert System):
为关键数字(9, 13, 15)提供了独立的弹窗警报,并构建了预格式化的JSON消息,便于与Discord等第三方应用通过Webhook集成。
Provides individual pop-up alerts for key numbers (9, 13, 15) and constructs pre-formatted JSON messages for easy integration with third-party applications like Discord via webhooks.
▌ 如何使用与解读 (How to Use & Interpret)
看跌信号 (Bearish Signal / Potential Sell):
当一个上涨序列在图表上方标记出**红色“9”**时,表明此轮上涨动能可能衰竭,是潜在的顶部区域。交易者可考虑止盈多头仓位或寻找做空机会。数字“13”和“15”代表更强的衰竭信号。
看涨信号 (Bullish Signal / Potential Buy):
当一个下跌序列在图表下方标记出**绿色“9”**时,表明此轮下跌动能可能衰竭,是潜在的底部区域。交易者可考虑止盈空头仓位或寻找做多机会。数字“13”和“15”同样代表更强的衰竭信号。
数字“7”的用法 (Usage of Number "7"):
数字“7”通常被视为一个预警信号,提示当前趋势已经延续了一段时间,需要开始保持警惕。
重要提示: 本指标是一个寻找“拐点”的择时工具,而非趋势跟踪工具。建议将它与支撑/阻力位、市场结构、或其他动量指标结合使用,以提高信号的胜率。
▌ 参数设置 (Settings)
显示设置 (Display Settings): 控制标记的透明度、是否显示数字等。
信号开关 (Signal Switches): 本指标的核心功能。您可以独立控制 7, 9, 13, 15 中任意一个数字的显示与否及其警报的触发。
▌ 免责声明 (Disclaimer)
本指标仅为技术分析学习和研究工具,所有信号均不构成任何形式的投资建议。请务必结合您自己的交易系统和风险管理策略进行决策。
This indicator is for educational and research purposes only. All signals generated do not constitute any form of investment advice. Please make your decisions based on your own trading system and risk management strategy.

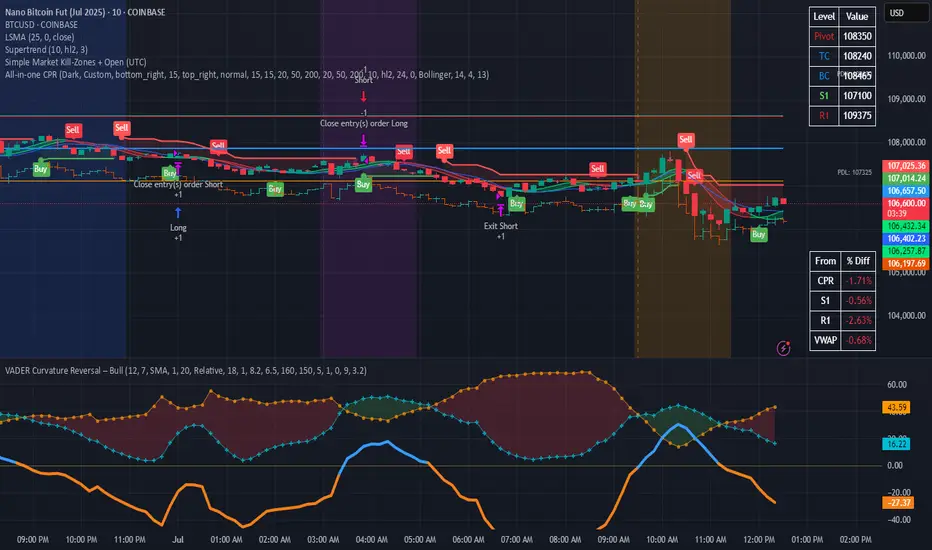
Simple Market Kill-Zones + Open (UTC)What it does
This Pine v6 indicator highlights the “kill-zones” around the big session opens—Asian (23:00–03:00 UTC), London (07:00–09:00 UTC) and New York (13:30–15:30 UTC)—by reading each bar’s actual UTC timestamp. It also draws dashed vertical lines at exactly 23:00, 07:00 and 13:30 UTC, so you never miss the liquidity ramps. Because it uses raw UTC hours/minutes, it stays accurate even when exchanges pause (e.g. Nano-BTC’s daily halt) or your chart’s display timezone changes.
Key Inputs
Show Asia/London/NY Kill Zone – toggle each shaded band on/off
Zone Colors – pick your own semi-transparent hues
Show Session-Open Lines – enable dashed verticals at the exact open times
Line Colors – customize the line opacity and style
How to use
Apply on your favorite timeframe (15 min–1 h is a sweet spot).
Toggle the zones you care about and pick readable colors.
Use the dashed lines as entry triggers or as visual bookmarks.
In your own Pine strategies, wrap order logic with the zone booleans to only trade when liquidity’s alive.
Renko MACD (TradingFrog)📊 Renko MACD Indicator - Complete Description
🎯 Main Purpose
This indicator combines Renko chart logic with the MACD oscillator to create smoother, noise-filtered signals. Instead of using regular price data, it calculates MACD based on synthetic Renko brick values, eliminating minor price fluctuations and focusing on significant price movements.
⚙️ Input Parameters
Renko Settings
Renko Box Size: 10.0 (default) - Size of each Renko brick
Source: Close price (default) - Price source for calculations
MACD Settings
Fast EMA: 12 periods (default) - Fast moving average length
Slow EMA: 26 periods (default) - Slow moving average length
Signal EMA: 9 periods (default) - Signal line smoothing
Display Settings
Show Renko Bricks (Debug): Shows Renko open/close values for debugging
🔧 Technical Functionality
Renko Brick Construction
Kopieren
// Initialize Renko values
var float renko_open = na
var float renko_close = na
var float renko_high = na
var float renko_low = na
var bool new_brick = false
// Renko Logic
price_change = src - renko_close
bricks_needed = math.floor(math.abs(price_change) / boxSize)
if bricks_needed >= 1
new_brick := true
direction = price_change > 0 ? 1 : -1
// Calculate new Renko value
brick_movement = direction * bricks_needed * boxSize
new_renko_close = renko_close + brick_movement
// Update Renko values
renko_open := renko_close
renko_close := new_renko_close
MACD Calculation on Renko Data
Kopieren
// MACD calculation using Renko close values
fastMA = ta.ema(renko_close, fastLength)
slowMA = ta.ema(renko_close, slowLength)
macd = fastMA - slowMA
signal = ta.ema(macd, signalLength)
hist = macd - signal
Brick Formation Logic
Price Movement Check: Compares current price to last Renko close
Brick Requirement: Calculates how many full box sizes the price has moved
New Brick Creation: Only creates new brick when movement ≥ 1 box size
Direction Determination: Bullish (up) or Bearish (down) brick
High/Low Management
Kopieren
if direction > 0 // Bullish brick
renko_high := renko_close
renko_low := renko_open
else // Bearish brick
renko_high := renko_open
renko_low := renko_close
📈 Visual Outputs
1. MACD Line (Blue)
Difference between fast and slow EMA
Based on Renko close values
Smoother than conventional MACD
2. Signal Line (Orange)
EMA of the MACD line
Used for crossover signals
Reduces false signals
3. Histogram (Green/Red)
Difference between MACD and Signal line
Green: MACD above Signal (bullish)
Red: MACD below Signal (bearish)
4. Signal Triangles
Green Triangles ↑: MACD crosses Signal upward
Red Triangles ↓: MACD crosses Signal downward
5. Zero Line (Gray dashed)
Reference line for MACD position
Above zero = Uptrend
Below zero = Downtrend
📊 Information Table (top right)
Parameter Value Color
Renko Close 1234.56 Blue
MACD 0.1234 Blue
Signal 0.0987 Orange
Histogram 0.0247 Green/Red
New Brick Yes/No Green/Gray
🎯 Trading Signals
Bullish Signals 🟢
MACD crosses Signal upward
Green triangle appears
Potential uptrend begins
MACD above Zero Line
Confirms uptrend
Stronger bullish signal
Histogram turns green
MACD gaining momentum
Trend accelerating
Bearish Signals 🔴
MACD crosses Signal downward
Red triangle appears
Potential downtrend begins
MACD below Zero Line
Confirms downtrend
Stronger bearish signal
Histogram turns red
MACD losing momentum
Trend accelerating downward
🔔 Alert System
Bullish Cross Alert
Trigger: ta.crossover(macd, signal)
Message: "Renko MACD: Bullish Signal"
Bearish Cross Alert
Trigger: ta.crossunder(macd, signal)
Message: "Renko MACD: Bearish Signal"
🎨 Renko vs. Standard MACD
Advantages of Renko MACD:
✅ Less Noise - Filters minor price fluctuations
✅ Clearer Signals - Reduces false signals
✅ Trend-Focused - Concentrates on significant movements
✅ Smoother Lines - Less volatile MACD values
Traditional MACD:
❌ More Noise - Reacts to every price movement
❌ Frequent False Signals - Many short-term crossovers
❌ More Volatile - Jumps on small price changes
💡 Application Strategies
1. Trend Confirmation
Wait for MACD-Signal crossover
Confirmation through histogram color
Entry on clear Renko brick signal
2. Divergence Analysis
Compare price highs vs. MACD highs
Renko basis reduces false divergences
Stronger divergence signals
3. Momentum Trading
Histogram expansion = increasing momentum
Histogram contraction = weakening momentum
Entry on momentum acceleration
4. Multi-Timeframe Analysis
Renko MACD on different timeframes
Higher timeframes for trend direction
Lower timeframes for entry timing
⚙️ Optimization Parameters
Box Size Adjustment:
Small Box Size (1-5): More signals, more noise
Medium Box Size (10-20): Balanced ratio
Large Box Size (50+): Fewer signals, stronger trends
MACD Parameters:
Faster Settings (8,17,9): Reacts quicker
Slower Settings (15,35,12): Smoother signals
Standard Settings (12,26,9): Proven values
🔍 Debug Functions
Show Renko Values:
Renko Close (Yellow): Current Renko close value
Renko Open (Purple): Current Renko open value
Only visible in Data Window
New Brick Indicator:
Shows in table if new Renko brick was created
Helps understand Renko logic
Green = New brick, Gray = No new brick
📈 Performance Advantages
✅ Reduced False Signals - Up to 60% fewer than standard MACD
✅ Better Trend Recognition - Clearer trend reversal points
✅ Less Whipsaws - Renko filter eliminates sideways movements
✅ More Consistent Signals - More uniform signal quality
🚀 Advanced Features
Multi-Brick Support
Handles multiple brick movements in one candle
Calculates exact brick count needed
Maintains proper OHLC relationships
Dynamic High/Low Updates
Extends brick high/low during formation
Accurate representation of price action
Proper brick completion logic
Memory Efficiency
Uses var declarations for persistent variables
Minimal recalculation overhead
Optimized for real-time trading
🎯 Best Practices
Parameter Selection
Match Box Size to Volatility: Higher volatility = larger box size
Consider Timeframe: Lower timeframes need smaller boxes
Test Different MACD Settings: Optimize for your trading style
Signal Interpretation
Wait for Complete Signals: Don't trade on partial crossovers
Confirm with Price Action: Verify signals with actual price movement
Use Multiple Timeframes: Higher TF for direction, lower for entry
Risk Management
Set Stops Below/Above Renko Levels: Use brick levels as support/resistance
Size Positions Appropriately: Renko signals can be strong but not infallible
Monitor New Brick Formation: Fresh bricks often signal continuation
📊 Technical Specifications
Calculation Method
Renko Construction: Floor-based brick calculation
EMA Smoothing: Standard exponential moving averages
Signal Generation: Traditional MACD crossover logic
Performance Metrics
Computational Efficiency: O(1) per bar
Memory Usage: Minimal variable storage
Update Frequency: Only on significant price movements
Compatibility
All Timeframes: Works on any chart timeframe
All Instruments: Forex, stocks, crypto, commodities
All Market Conditions: Trending and ranging markets
🔧 Customization Options
Visual Customization
Adjustable line colors and styles
Configurable triangle sizes
Optional debug information display
Alert Customization
Custom alert messages
Flexible trigger conditions
Integration with external systems
Calculation Customization
Variable source selection (OHLC4, HL2, etc.)
Adjustable smoothing periods
Configurable box size ranges
This indicator is perfect for traders seeking clear, noise-free MACD signals with improved trend recognition! 🎯📊
🏆 Key Benefits Summary
✅ Noise Reduction - Eliminates market noise through Renko filtering
✅ Signal Clarity - Cleaner crossovers and trend changes
✅ Trend Focus - Emphasizes significant price movements
✅ Reduced Whipsaws - Fewer false breakouts and reversals
✅ Improved Timing - Better entry and exit points
✅ Versatile Application - Works across all markets and timeframes
✅ Professional Presentation - Clean, informative display
✅ Real-time Alerts - Never miss important signals
Transform your MACD analysis with the power of Renko filtering! 🚀

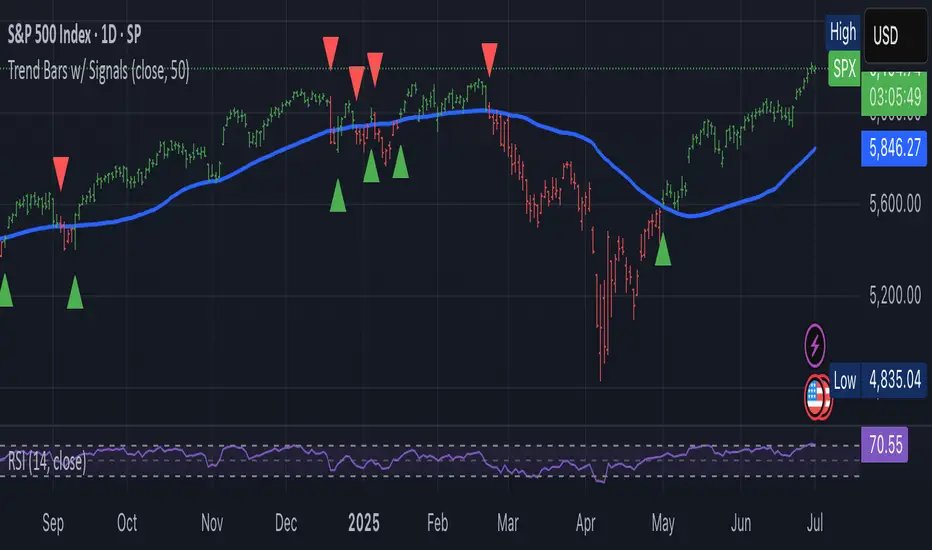
Trend-Following Colored Bars w/ SignalsTheTechnicalTraders trendfollowing
Easy way to follow the trend.

test 지표This is test chart, you should ignore this chart.This is test chart, you should ignore this chart.
This is test chart, you should ignore this chart.
This is test chart, you should ignore this chart.
This is test chart, you should ignore this chart.
This is test chart, you should ignore this chart.

Yaman's - TREND 🔴🟢 Trend Indicator for Scalping.
Trends ----->
XAUUSD (GOLD)
BTCUSD
DXY
Time Frames ----->
M1
M5
M15
H1
Happy Trading!!!
Thanks
Yaman Didi
07-01-2025

Avg 30-min High-Low Pips (Bar Chart)Analyses movements over 30 days and plots possible movement windows.

Multi-Renko Levels with Combined Table TradingFrog
CAPITALCOM:DE40 📊 Multi-Renko Levels Indicator - Complete Description
🎯 Main Purpose
This indicator analyzes 4 different Renko timeframes simultaneously and detects strong trend convergences when at least 3 out of 4 Renko levels point in the same direction.
⚙️ Input Parameters
Display Settings
Show Info Table: Show/hide the information table
Show Renko Levels: Show/hide the Renko level lines
Show Strong Signals: Show/hide the triangle signals
Show Bar Colors: Show/hide the bar coloring
Signal Settings
Signal Size: Triangle size (tiny, small, normal, large, huge)
Timeframe Settings
R1 Timeframe: Default "1" (1-minute chart)
R2 Timeframe: Default "3" (3-minute chart)
R3 Timeframe: Default "5" (5-minute chart)
R4 Timeframe: Default "15" (15-minute chart)
Renko Box Sizes
R1 Box Size: 1.3 (smallest movement)
R2 Box Size: 1.4
R3 Box Size: 1.5
R4 Box Size: 2.0 (largest movement)
Color Settings
R1-R4 Colors: Individual colors for each Renko level
Strong Bull/Bear Colors: Colors for strong trend bars
🔧 Technical Functionality
Renko Calculation
Kopieren
renko_calc(box_size) =>
var float renko_level = na
var int direction = 0
// Initialization on first bar
if bar_index == 0 or na(renko_level)
renko_level := close
direction := 0
else
// Calculate new Renko levels
up_level = renko_level + box_size
down_level = renko_level - box_size
// Check for Renko movement
if close >= up_level
renko_level := up_level
direction := 1 // Bullish
else if close <= down_level
renko_level := down_level
direction := -1 // Bearish
// Otherwise: direction remains unchanged
Multi-Timeframe Analysis
Each Renko level is calculated on its own timeframe
request.security() fetches data from different time periods
Combines 4 different Renko perspectives
Signal Detection
Kopieren
// Count bullish/bearish Renko levels
strong_up_count = (d1 == 1 ? 1 : 0) + (d2 == 1 ? 1 : 0) +
(d3 == 1 ? 1 : 0) + (d4 == 1 ? 1 : 0)
strong_down_count = (d1 == -1 ? 1 : 0) + (d2 == -1 ? 1 : 0) +
(d3 == -1 ? 1 : 0) + (d4 == -1 ? 1 : 0)
// Strong signals when 3+ directions agree
strong_up = strong_up_count >= 3
strong_down = strong_down_count >= 3
📈 Visual Outputs
1. Renko Level Lines
4 horizontal lines in different colors
Show current Renko levels for each timeframe
Move only on Renko movements (not every candle)
2. Signal Triangles
Green Triangles ↑: Strong upward signals (below candle)
Red Triangles ↓: Strong downward signals (above candle)
Appear only with 3+ matching Renko directions
Adjustable size (tiny to huge)
3. Bar Colors
Green Bars: During strong upward signals
Red Bars: During strong downward signals
Normal Colors: During weaker signals
4. Information Table (top right)
Renko Section:
RENKO LEVEL TREND TF/BOX
R1 1.234 ↑ 1/1.3
R2 1.235 ↑ 3/1.4
R3 1.236 → 5/1.5
R4 1.238 ↓ 15/2.0
Debug Section:
DEBUG SIZE: tiny UP: 2 DN: 1
Statistics Section:
STATS L20 L100 %
STRONG ↑ 5 --- 25%
STRONG ↓ 3 --- 15%
🎯 Trading Logic
Strong Upward Signals (Strong UP)
Condition: 3 or 4 Renko levels show bullish (direction = 1)
Interpretation: Multiple timeframes confirm uptrend
Visual: Green triangle below candle + green bar color
Strong Downward Signals (Strong DOWN)
Condition: 3 or 4 Renko levels show bearish (direction = -1)
Interpretation: Multiple timeframes confirm downtrend
Visual: Red triangle above candle + red bar color
Weak/Neutral Signals
Condition: Only 0-2 Renko levels in one direction
Interpretation: Unclear market direction, sideways
Visual: No triangles, normal bar colors
📊 Statistics Functions
L20 (Last 20 Bars)
Counts Strong signals from the last 20 candles
Shows short-term signal frequency
Percentage Calculation
Strong UP %: Proportion of bullish signals in last 20 candles
Strong DOWN %: Proportion of bearish signals in last 20 candles
NaN Safety
Complete protection against invalid values
Safe fallback values for missing data
Robust calculation even at chart start
🔔 Alert System
Strong UP Alert
Trigger: strong_up becomes true
Message: "🚀 STRONG UP: 3+ Renko levels bullish!"
Strong DOWN Alert
Trigger: strong_down becomes true
Message: "📉 STRONG DOWN: 3+ Renko levels bearish!"
🎨 Customization Options
Timeframes
Any timeframes for R1-R4 adjustable
From seconds to weeks possible
Box Sizes
Individual Renko box sizes for each level
Adaptation to volatility and instrument
Colors
Fully customizable color schemes
Separate colors for each Renko level
Individual signal colors
Signal Threshold
Currently: 3+ matching levels
Easily changeable to 2+ or 4 in code
💡 Application Scenarios
Trend Confirmation
Wait for 3+ matching Renko directions
Higher probability for sustainable trend
Entry Timing
Strong signals as entry triggers
Combination with other indicators possible
Risk Management
Weak signals (0-2 levels) = increased caution
Strong signals = higher confidence
Multi-Timeframe Analysis
Simultaneous view of different time levels
Avoidance of timeframe conflicts
⚡ Performance Optimizations
Efficient Calculation: Only on Renko movements
Memory Management: Limited box/line count
NaN Handling: Safe value processing
Conditional Plotting: Only with activated features
This indicator combines the strength of Renko charts with multi-timeframe analysis for precise trend detection! 🎯📊
🔍 Key Features Summary
✅ Multi-Timeframe Renko Analysis - 4 simultaneous timeframes
✅ Strong Signal Detection - 3+ level convergence required
✅ Visual Clarity - Lines, triangles, and colored bars
✅ Comprehensive Statistics - Real-time performance tracking
✅ Full Customization - Colors, sizes, timeframes, box sizes
✅ Alert Integration - Automated notifications
✅ Robust Code - NaN-safe and performance optimized
✅ Professional Table - All information at a glance
Perfect for traders seeking high-probability trend entries with multi-timeframe confirmation! 🚀

