RSI OB/OS TrackerRSI OB/OS Tracker – Find Overbought & Oversold Assets Easily!
Are you looking for trading opportunities in overbought (OB) or oversold (OS) zones? The RSI OB/OS Tracker indicator helps you monitor multiple assets simultaneously, identifying potential pullbacks or reversals based on RSI conditions!
🔍 Key Features:
✅ Track Multiple Asset Lists – Choose from 3 predefined lists (Forex, Crosses, Indices, Commodities).
✅ Custom OB/OS Levels – Adjust RSI thresholds (default: 70/30) to fit your strategy.
✅ Multi-Timeframe Analysis – Check RSI conditions on any timeframe, independent of your chart.
✅ Real-Time Alerts – Set up TradingView alerts for each asset list separately, even if the indicator is removed from your chart!
✅ Clean & Efficient Display – A simple table shows the current OB/OS status for all assets, with the list number (1, 2, or 3) visible for easy reference.
📊 How It Works:
The indicator scans all assets in the selected list.
If an asset enters OB (Overbought) or OS (Oversold), it highlights in the table.
You can set alerts to notify you when a new signal appears, helping you catch potential reversals early!
⚡ Perfect For:
Swing Traders looking for pullback opportunities.
Reversal Traders spotting extreme RSI conditions.
Multi-asset traders who need a quick overview of market conditions.
📌 Try it now and never miss an OB/OS opportunity again!
👉 Get the RSI OB/OS Tracker on TradingView today!
#TradingView #RSI #Overbought #Oversold #Pullback #Reversal #Forex #Stocks #Indices #TradingIndicator
Cycles

Navy Seal Trading - EdgarTrader📌 Navy Seal Trading – Asia, London, and NY Sessions
This indicator clearly displays the ranges of the Asia, London, and New York sessions, featuring:
✅ Full range visualization for each session
✅ Asia session high, low, and midline, with extended projection lines for precise reaction analysis
✅ Clean, minimalistic, and professional colors to keep your chart focused
🔷 Designed for the Navy Seal Trading community, focused on precision, discipline, and professional execution in the markets.
Use it to:
✔️ Mark liquidity zones
✔️ Identify Asia manipulation ranges
✔️ Prepare executions in London and NY with clear context
💡 Remember: Clarity in your zones gives you the confidence and discipline to execute like a true Navy Seal Trader.

Advanced Day Separator with Future ProjectionsThe general indicator works on historical data, meaning they develop after the fact. The same is for indicators that show day separation. I was always forced to manually draw in vertical lines for the upcoming week. This indicator I built solves that issue by projecting vertical day separations for the upcoming week. Enjoy! :-)

VARNI-LINE-CHART//@version=5
indicator("VARNI-LINE-CHART",shorttitle = "VARNI-LINE-CHART", overlay=false)
// Input for Index and Expiry Date
spot_ = input.string("BANKNIFTY", title = "Spot Symbol", options = , group = "Index")
tooltip_day = "Enter the day of the expiry. Add 0 in front if the day is a single digit. For example: 05 instead of 5"
tooltip_month = "Enter the month of the expiry. Add 0 in front if the month is a single digit. For example: 06 instead of 6"
tooltip_year = "Enter the year of the expiry. Use the last two digits of the year. For example: 24 instead of 2024"
_day = input.string("13", title = "Expiry Day", tooltip = tooltip_day, group="Expiry Date")
_month = input.string("02", title = "Expiry Month", tooltip = tooltip_month, group="Expiry Date")
_year = input.string("25", title = "Expiry Year", tooltip = tooltip_year, group="Expiry Date")
// Input for Strikes
tooltip_ = "You can select any Strike, and choose to include both strikes or just one"
strike_ce = input.int(23500, "Call Strike", tooltip = tooltip_,step = 50, group = "Select Strike")
strike_pe = input.int(23500, "Put Strike", tooltip = tooltip_,step = 50, group = "Select Strike")
var string spot = na
if spot_ == "SENSEX"
spot := "BSX"
else if spot_ == "BANKEX"
spot := "BKX"
else
spot := spot_
// Option to include both strikes
strike_choice = input.string("Combined", title = "Select Strike", options = , group = "Select Strike")
// Generate symbols for Call and Put options
var string symbol_CE = spot + _year + _month + _day + "C" + str.tostring(strike_ce)
var string symbol_PE = spot + _year + _month + _day + "P" + str.tostring(strike_pe)
// Request security data for both Call and Put options
= request.security(symbol_CE, timeframe.period, )
= request.security(symbol_PE, timeframe.period, )
call_volume = request.security( symbol_CE, timeframe.period , volume )
put_volume = request.security( symbol_PE, timeframe.period , volume )
var float combined_open = 0
var float combined_high = 0
var float combined_low = 0
var float combined_close = 0
var float combined_vol = 0
// Calculate combined premium based on strike choice
if strike_choice == "Combined"
combined_open := call_open + put_open
combined_close := call_close + put_close
combined_high := math.max(combined_open, combined_close)
combined_low := math.min(combined_open, combined_close)
combined_vol := call_volume + put_volume
else if strike_choice == "Only Call"
combined_open := call_open
combined_close := call_close
combined_high := call_high
combined_low := call_low
combined_vol := call_volume
else
combined_open := put_open
combined_close := put_close
combined_high := put_high
combined_low := put_low
combined_vol := put_volume
// Plot combined premium as a line chart
plot(combined_close, title = "Combined Premium", color = combined_close > combined_open ? color.green : color.red, linewidth = 2)
// Indicator selection
use_ema_crossover = input.bool(false, title = "Use EMA Crossover", group = "Indicators")
use_supertrend = input.bool(false, title = "Use Supertrend", group = "Indicators")
use_vwap = input.bool(true, title = "Use VWAP", group = "Indicators")
use_rsi = input.bool(false, title = "Use RSI", group = "Indicators")
use_sma = input.bool(false, title = "Use SMA", group = "Indicators")
pine_supertrend_value(factor, atrPeriod) =>
src = combined_close
atr = ta.atr(atrPeriod)
upperBand = src + factor * atr
lowerBand = src - factor * atr
prevLowerBand = nz(lowerBand )
prevUpperBand = nz(upperBand )
lowerBand := lowerBand > prevLowerBand or combined_close < prevLowerBand ? lowerBand : prevLowerBand
upperBand := upperBand < prevUpperBand or combined_close > prevUpperBand ? upperBand : prevUpperBand
int _direction = na
float superTrend = na
prevSuperTrend = superTrend
if na(atr )
_direction := 1
else if prevSuperTrend == prevUpperBand
_direction := combined_close > upperBand ? -1 : 1
else
_direction := combined_close < lowerBand ? 1 : -1
superTrend := _direction == -1 ? lowerBand : upperBand
superTrend
pine_supertrend_dir(factor, atrPeriod) =>
src = combined_close
atr = ta.atr(atrPeriod)
upperBand = src + factor * atr
lowerBand = src - factor * atr
prevLowerBand = nz(lowerBand )
prevUpperBand = nz(upperBand )
lowerBand := lowerBand > prevLowerBand or combined_close < prevLowerBand ? lowerBand : prevLowerBand
upperBand := upperBand < prevUpperBand or combined_close > prevUpperBand ? upperBand : prevUpperBand
int _direction = na
float superTrend = na
prevSuperTrend = superTrend
if na(atr )
_direction := 1
else if prevSuperTrend == prevUpperBand
_direction := combined_close > upperBand ? -1 : 1
else
_direction := combined_close < lowerBand ? 1 : -1
superTrend := _direction == -1 ? lowerBand : upperBand
_direction
// Input for EMA lengths
fastLength = input.int(7, 'Fast EMA Length', group = "EMA")
slowLength = input.int(12, 'Slow EMA Length', group = "EMA")
// Input for SuperTrend
atrLength = input.int(7, 'ATR Length', group = "SuperTrend")
fac = input.float(2, 'Factor', group = "SuperTrend")
// Input for RSI
rsi_length = input.int(7, 'Length', group="RSI")
rsi_ob_level = input.int(80, 'Overbought', group="RSI")
rsi_os_level = input.int(20, 'Oversold', group="RSI")
// Input for SMA
sma_length = input.int(7, 'SMA Length', group = "SMA")
var float fast_ema = na
var float slow_ema = na
var float supertrend = na
var int direction = na
var float rsi_val = na
var float sma_val = na
var float sumPriceVolume = na
var float sumVolume = na
var float vwap = na
// Fast EMA
if use_ema_crossover
fast_ema := ta.ema(combined_close, fastLength)
slow_ema := ta.ema(combined_close, slowLength)
// Supertrend
if use_supertrend
supertrend := pine_supertrend_value( fac, atrLength)
direction := pine_supertrend_dir( fac, atrLength)
// VWAP
if use_vwap
if (dayofweek != dayofweek )
sumPriceVolume := 0.0
sumVolume := 0.0
vwap := 0.0
sumPriceVolume += combined_close * combined_vol
sumVolume += combined_vol
vwap := sumPriceVolume / sumVolume
// RSI
if use_rsi
rsi_val := ta.rsi(combined_close, rsi_length)
// SMA
if use_sma
sma_val := ta.sma(combined_close, sma_length)
plot(fast_ema, title='Fast EMA', color=color.blue, linewidth=2)
plot(slow_ema, title='Slow EMA', color=color.yellow, linewidth=2)
plot(direction < 0 ? supertrend : na, "Up direction", color = color.green, style=plot.style_linebr)
plot(direction > 0 ? supertrend : na, "Down direction", color = color.red, style=plot.style_linebr)
plot(vwap, title='VWAP', color=color.purple, linewidth=2)
plot(sma_val, title='SMA', color=color.maroon, linewidth=2)
// Define buy and sell conditions based on selected indicators
var bool buy = false
var bool sell = false
var int buyC = 0
var int sellC = 0
if dayofweek != dayofweek
buyC := 0
sellC := 0
if use_ema_crossover
buy := ( ta.crossover(fast_ema, slow_ema) ) and buyC == 0
sell := ( ta.crossunder(fast_ema, slow_ema) ) and sellC == 0
if use_vwap
buy := ( buy ? buy and (combined_close > vwap and combined_close <= vwap ) : (combined_close > vwap and combined_close <= vwap )) and buyC == 0
sell := ( sell ? sell and (combined_close < vwap and combined_close >= vwap ) : (combined_close < vwap and combined_close >= vwap )) and sellC == 0
if use_rsi
buy := ( buy ? buy and ta.crossover(rsi_val, rsi_ob_level) : ta.crossover(rsi_val, rsi_ob_level) ) and buyC == 0
sell := ( sell ? sell and ta.crossunder(rsi_val, rsi_os_level) : ta.crossunder(rsi_val, rsi_os_level) ) and sellC == 0
if use_sma
buy := ( buy ? buy and ta.crossover(combined_close, sma_val) : ta.crossover(combined_close, sma_val) ) and buyC == 0
sell := ( sell ? sell and ta.crossunder(combined_close, sma_val) : ta.crossunder(combined_close, sma_val) ) and sellC == 0
if use_supertrend
buy := ( buy ? direction == -1 : direction == -1 and direction == 1 ) and buyC == 0
sell := ( sell ? direction == 1 : direction == 1 and direction == -1 ) and sellC == 0
if buy
buyC := 1
sellC := 0
if sell
sellC := 1
buyC := 0
// Plot buy and sell signals
plotshape(buy, title = "Buy", text = 'Buy', style = shape.labeldown, location = location.top, color= color.green, textcolor = color.white, size = size.small)
plotshape(sell, title = "Sell", text = 'Sell', style = shape.labelup, location = location.bottom, color= color.red, textcolor = color.white, size = size.small)
// Alert conditions
alertcondition(buy, "Buy Alert", "Buy Signal")
alertcondition(sell, "Sell Alert", "Sell Signal")

Rolling 250-Day Sharpe RatioThis Pine Script indicator, “Rolling 250-Day Sharpe Ratio”, computes the trailing Sharpe Ratio for any traded asset over a 250-session window, equivalent to approximately one trading year. The script first derives daily log returns and adjusts them by subtracting the daily equivalent of the 3-month US Treasury yield to obtain the excess return. It then calculates the rolling mean and standard deviation of these excess returns to produce the annualized Sharpe Ratio, which is displayed as a continuous time series on the chart. This allows traders and analysts to assess how the asset’s risk-adjusted performance evolves over time relative to a risk-free benchmark.
A persistently high Sharpe Ratio can indicate strong risk-adjusted returns, but it is essential to approach extreme values with caution. Elevated Sharpe readings can sometimes reflect unsustainable trends, excessive leverage, or periods of unusually low volatility that may revert abruptly. Conversely, a low or negative Sharpe Ratio does not automatically imply an asset should be avoided; it might signal an opportunity if the risk environment normalizes.

Session Makers v1
Session Makers v1 - Professional Trading Session Visualizer
This advanced indicator highlights key trading sessions and market structure levels, helping traders identify optimal trading times and important price levels.
Key Features:
Session Time Markers
- Vertical dotted lines at major market opens (London/New York)
- Appears 30 minutes before each session for early preparation
Interactive Session Boxes
- Asia Session (22:00-06:00 GMT) - Blue shaded area
- London AM (08:00-09:00 GMT) - Gray shaded area
- London/New York Overlap (14:00-15:00 GMT) - Gray shaded area
Key Reference Levels
- Yesterday's high/low (with touch alerts)
- Previous week's high/low (with touch alerts)
- Asia session high/low/mid lines
Smart Visual Design
- Clean, non-cluttered visuals that adapt to your chart
- Customizable colors and transparency for all elements
- Optimized for all timeframes (M1-H4)
only use in timeframes <= 15 min

TRADSYS24-06TTTrading de SPX long and short using a Leading TIMEWAVES indicator, yo know direction of trends before they happen
Bottom line is that FUTURE TRENDS of SPX are traded, which already are calculated in advance using physics law, how exactly is a secret.
Proprietary software calculates a TIMEWAVES indicator far ahead in the future, which thus is a leading indicator. If this indicator is going UP in the future (strong move) then the SPX will follow and prices will go UP. If indicator goes down (strong move) the SPX will go down.
Indicator is shown in TV, however, in spite of the fact it is already known for the future, this cannot be shown in TV. TV only shows time up to NOW, not all of next month in the future.
Why ? because 90 % of people and vested interests in finance world always tell "nobody knows the future". Start believing the impossible like GANN, Armstrong and renaissance group and there you go.

SDR Dashboard v3.1: 结构距离与节奏SDR Dashboard v3.1: User Guide & Trading Strategy
1. Introduction
The SDR Dashboard is a comprehensive technical indicator designed to identify high-probability trend-following trade opportunities. It is built on the core principle of "buying the dip in an uptrend" and "selling the rally in a downtrend."
To achieve this, the indicator combines three key elements of market analysis:
Rhythm (The Long-Term Trend): Determines the overall market direction.
Distance (The Pullback Location): Identifies when the price has pulled back to an area of potential value.
Momentum (The Entry Trigger): Provides the final confirmation to enter a trade.
A signal is only generated when all three conditions align, providing a clear and disciplined approach to trading.
2. Core Components Explained
The indicator's logic is visualized through the background color and the oscillator at the bottom of the chart.
Rhythm: The Background Color
The background color is determined by the 200-period Exponential Moving Average (EMA), which defines the long-term trend.
🟦 Blue Background: The price is above the 200 EMA. The market is in an uptrend. You should ONLY look for BUY signals.
🟥 Red Background: The price is below the 200 EMA. The market is in a downtrend. You should ONLY look for SELL signals.
⬜ Gray Background: The price is hovering around the 200 EMA. The trend is unclear or the market is in a consolidation phase. You should STAY OUT and wait for a clear trend to establish.
Distance: The Oscillator & Zones
The multi-colored line at the bottom is the "Distance Oscillator." It measures how overbought or oversold the price is relative to its recent range (defaulting to the last 50 bars).
Overbought Zone (Red Area > +80): In a downtrend, this indicates the price has rallied to a potential resistance level and may be due for a turn back down.
Oversold Zone (Green Area < -80): In an uptrend, this indicates the price has dipped to a potential support level and may be due for a turn back up.
Momentum: The Stochastic Cross (The Hidden Trigger)
This indicator uses a standard Stochastic Oscillator in the background (not plotted to keep the chart clean) as the final entry trigger.
A bullish crossover (K-line crossing above D-line) confirms that downside momentum is fading and buying pressure is returning.
A bearish crossunder (K-line crossing below D-line) confirms that upside momentum is fading and selling pressure is returning.
3. How to Use: Trading Rules
BUY Signal (Long Entry)
Look for a green "▲" arrow below a candle. This signal appears ONLY when the following three conditions are met in order:
Rhythm is Bullish: The chart background must be BLUE.
Distance is Oversold: The Distance Oscillator must have recently dipped into the green "Support Zone" (below -80) within the last 3 bars. This shows a pullback has occurred.
Momentum Confirms: The Stochastic Oscillator has just executed a bullish crossover. This is the trigger.
Strategy: In a clear uptrend (blue background), wait for a price dip into the support area. Enter when the green arrow appears, confirming the dip is likely over and the uptrend is resuming.
SELL Signal (Short Entry)
Look for a red "▼" arrow above a candle. This signal appears ONLY when the following three conditions are met in order:
Rhythm is Bearish: The chart background must be RED.
Distance is Overbought: The Distance Oscillator must have recently pushed into the red "Resistance Zone" (above +80) within the last 3 bars. This shows a rally has occurred.
Momentum Confirms: The Stochastic Oscillator has just executed a bearish crossunder. This is the trigger.
Strategy: In a clear downtrend (red background), wait for a price rally into the resistance area. Enter when the red arrow appears, confirming the rally is likely over and the downtrend is resuming.
4. Best Practices & Risk Management
No Indicator is Perfect: This tool provides high-probability setups, not guaranteed wins. Always use proper risk management, including setting a stop-loss for every trade.
Context is Key: The indicator works best in trending markets. Be cautious during periods of low volatility or sideways chop (gray background).
Parameter Tuning: The default settings are a balanced starting point. Feel free to experiment with the lookback periods and thresholds in the indicator's settings to optimize for different assets and timeframes.

SDR Dashboard: 结构距离与节奏How to trade with this "SDR Dashboard"
This indicator is not a mindless "arrow trading system", but a powerful filter and decision-making aid. Please strictly follow the following process:
Step 1: Look at the background color (set the rhythm)
Is the chart background blue? If so, your brain should switch to "only look for buying opportunities" mode. Ignore all red arrow signals.
Is the chart background red? If so, switch to "only look for selling opportunities" mode. Ignore all green arrow signals.
Is the background gray? Stay on the sidelines, or only trade in small positions.
Step 2: Wait for the oscillator to enter the area (measure the distance)
Under the blue background, patiently wait for the "Structural Distance Oscillator" main line to enter the green "support zone" below (below -80). This tells you that the price has fallen back to a favorable position in the structure.
Under the red background, wait for the main line to enter the red "resistance zone" above (above +80).
Step 3: Wait for the arrow to appear (find resonance)
This is the most critical step. When the oscillator main line has entered the favorable area, do not act immediately.
Wait patiently for a clear green (▲) or red (▼) arrow signal to appear. This arrow represents the final confirmation of "momentum" and is the resonance point of "time, place, and people".
Step 4: Confirm with the main chart (execute the transaction)
When the SDR dashboard sends a signal, return to your main chart for final confirmation.
Does this signal appear in the strong support/resistance area you marked with VPVR?
Use the **"Long and Short Positions" tool to measure whether the profit and loss ratio of this transaction is still cost-effective?
If everything is perfect, this is a high-probability transaction that is highly consistent with your trading system. Execute it and set the stop loss and take profit according to your trading plan.
This indicator condenses all our discussions - macro rhythm, structural distance, momentum confirmation - into a simple and powerful visual language. It can greatly help you filter out low-quality trading opportunities and force you to be patient and only take action when the chance of winning is the highest.


THEDU RSI VIP 999fva fsdcsdvs d vfsdvcsdffws d dsfsdfsfedfzcesfzxdcsedf fsadfef è szdcsdfsdfwec szc fdssdfddddđ

Pithis is pi cycle indicator for bitcoin
blue triangle indicates price higher than a week ago and higher than yesterday
orange one indicates price higher than a week ago but lower than yesterday
fuchsia one indicates price lower than a week ago but higher than yesterday
red one indicates price lower than a week ago and lower than yesterday

Hourly Markers 09:00 - 20:00 Adjusted for UTC+2A line for every hour from 0900 to 2200
Description:
This TradingView Pine Script plots small red markers (downward arrows) at the top of the chart for every full hour between 09:00 AM and 08:00 PM (20:00) based on UTC+2 time. The markers appear precisely at the opening minute of each hour within the defined range, helping traders visually track key time intervals during the day.
Features:
✔ Displays markers from 09:00 to 20:00 local time (UTC+2 adjustment)
✔ Only plots markers at the first minute of each hour
✔ Uses clear, unobtrusive triangle-down symbols above the bars
✔ Works on any chart timeframe that captures hourly intervals
Use Case:
Ideal for traders who want a quick visual reference of hourly intervals during the main trading hours, especially when working with charts set to UTC or different time zones.

BTC Buy Sunday Noon / Sell Friday Noon (Compounding from $1000)long enough description long enough description long enough description long enough description long enough description long enough description long enough description long enough description long enough description long enough description long enough description

Macro+ ExtMacros+ (Time Sessions & Alerts)
Macros+ is a powerful and highly customizable tool designed to highlight specific time windows—often referred to as "macros"—directly on your chart. It is built for traders who operate on time-based strategies, such as those targeting specific liquidity periods like the ICT Silver Bullet or other institutional timeframes.
By visualizing these key sessions historically and in real-time, traders can better anticipate market volatility, identify potential trade setups, and maintain discipline. The script is clean, efficient, and built with flexibility in mind.
Key Features
This indicator goes beyond simple time boxes and includes several advanced features to fit your specific trading style:
1. Historical & Real-Time Display
The script is designed to plot all selected macro sessions across the entire historical data loaded on your chart, not just the current day. This allows for comprehensive backtesting and analysis of how price behaves during these specific time windows.
2. Fully Customizable Macro Sessions
You have full control over which time sessions you want to display. The indicator includes 14 pre-configured 20-minute sessions, which you can easily toggle on or off from the settings menu. This allows you to focus only on the timeframes that are relevant to your strategy.
3. Adjustable "Extended Macro" Time
Flexible Time Extension: Instead of a fixed session duration, you can now dynamically extend the start and end times of all macros.
Numerical Input: In the settings, under "Time Settings," you'll find an "Extend Minutes" input. This number lets you add minutes to both the beginning and the end of each session.
Example: A standard macro from 09:50 - 10:10 with an "Extend Minutes" value of 5 will be automatically adjusted to 09:45 - 10:15. Setting it to 0 will keep the default 20-minute sessions.
4. Multiple Display Styles
Adapt the indicator's appearance to your preference for a clean and readable chart. All styles are designed to span the full vertical height of the chart for maximum visibility.
Solid Line: Clear, solid vertical lines marking the start and end of a session.
Dashed Line: A more subtle, dashed-line alternative.
Dotted Line: The most subtle line style for a minimalist chart.
Background: Fills the entire session window with a semi-transparent color.
Outline: Draws a colored border around the session window without filling it.
5. Real-Time Alerts
Never miss the start of a key session again. You can enable an alert that will trigger once at the beginning of any active macro session. This is perfect for traders who may not be watching the charts constantly.
6. Timezone Correction
All times are calculated based on the timezone you select in the settings (default is "America/New_York"). This ensures the sessions are always plotted accurately according to the market you are trading (e.g., New York session times).
How to Use
Add to Chart: Add the "Macros+" indicator to your chart.
Open Settings:
General Settings: Choose your preferred Timezone, Display Style, and Color.
Active Macro Sessions: Check the boxes for the time sessions you wish to monitor.
Time Settings: Enter a value in Extend Minutes if you want to widen the time windows. A value of 5 will create 30-minute sessions.
Alert Settings: Enable the Alert On Macro Start option if you wish to receive alerts.
Create Alert: To activate the pop-up alert, click the clock icon on the TradingView right-hand panel, select "Macros+" in the "Condition" dropdown, choose "Sesi Makro Dimulai," and set it to trigger "Once Per Bar."
This tool was designed to be both powerful and user-friendly. I hope it becomes a valuable part of your trading toolkit. Happy trading!

M.O.E - Stochastic BacktesterLooking for some folks to help validate a new tool that is currently in development. It's not perfect and still in the testing phase, but the goal is to use it as a means to validate other indicators. This tool takes into account various data points such as volume, price action, and volatility signals to help identify potential trade setups. I'm hoping to gather feedback on its effectiveness, usability, and any areas for improvement before making it more widely available. If you're interested in testing this out and providing honest feedback, please let me know!


first 5 minutes NY session)I created this indicator myself to identify the first 5 minutes of the New York session, during which it automatically draws the lines. It's a strategy that has helped me a lot.

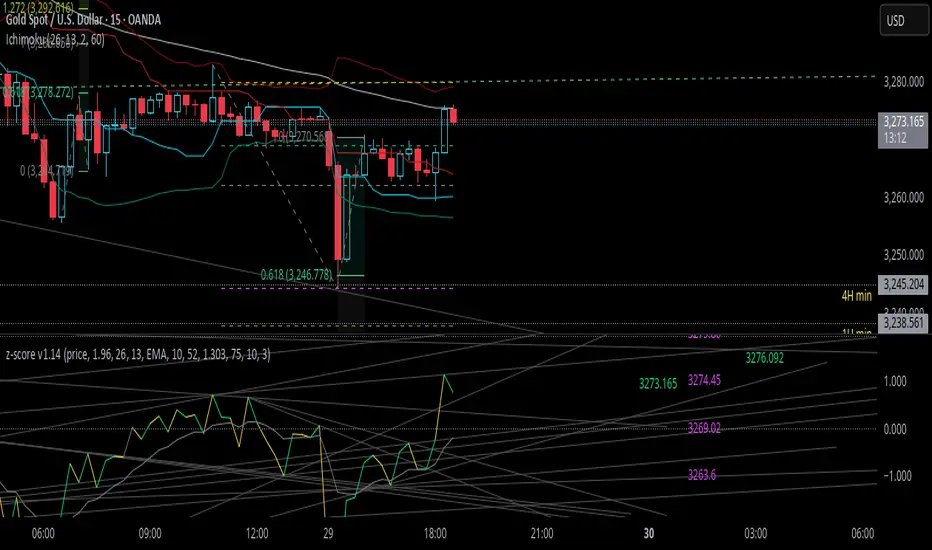
z-score-calkusi-v1.14z-scores incorporate the moment of N look-back bars to allow future price projection.
z-score = (X - mean)/std.deviation ; X = close
z-scores update with each new close print and with each new bar. Each new bar augments the mean and std.deviation for the N bars considered. The old Nth bar falls away from consideration with each new historical bar.
The indicator allows two other options for X: RSI or Moving Average.
NOTE: While trading use the "price" option only.
The other two options are provided for visualisation of RSI and Moving Average as z-score curves.
Use z-scores to identify tops and bottoms in the future as well as intermediate intersections through which a z-score will pass through with each new close and each new bar.
Draw lines from peaks and troughs in the past through intermediate peaks and troughs to identify projected intersections in the future. The most likely intersections are those that are formed from a line that comes from a peak in the past and another line that comes from a trough in the past. Try getting at least two lines from historical peaks and two lines from historical troughs to pass through a future intersection.
Compute the target intersection price in the future by clicking on the z-score indicator header to see a drag-able horizontal line to drag over the intersection. The target price is the last value displayed in the indicator's status bar after the closing price.
When the indicator header is clicked, a white horizontal drag-able line will appear to allow dragging the line over an intersection that has been drawn on the indicator for a future z-score projection and the associated future closing price.
With each new bar that appears, it is necessary to repeat the procedure of clicking the z-score indicator header to be able to drag the drag-able horizontal line to see the new target price for the selected intersection. The projected price will be different from the current close price providing a price arbitrage in time.
New intermediate peaks and troughs that appear require new lines be drawn from the past through the new intermediate peak to find a new intersection in the future and a new projected price. Since z-score curves are sort of cyclical in nature, it is possible to see where one has to locate a future intersection by drawing lines from past peaks and troughs.
Do not get fixated on any one projected price as the market decides which projected price will be realised. All prospective targets should be manually updated with each new bar.
When the z-score plot moves outside a channel comprised of lines that are drawn from the past, be ready to adjust to new market conditions.
z-score plots that move above the zero line indicate price action that is either rising or ranging. Similarly, z-score plots that move below the zero line indicate price action that is either falling or ranging. Be ready to adjust to new market conditions when z-scores move back and forth across the zero line.
A bar with highest absolute z-score for a cycle screams "reversal approaching" and is followed by a bar with a lower absolute z-score where close price tops and bottoms are realised. This can occur either on the next bar or a few bars later.
The indicator also displays the required N for a Normal(0,1) distribution that can be set for finer granularity for the z-score curve.This works with the Confidence Interval (CI) z-score setting. The default z-score is 1.96 for 95% CI.
Common Confidence Interval z-scores to find N for Normal(0,1) with a Margin of Error (MOE) of 1:
70% 1.036
75% 1.150
80% 1.282
85% 1.440
90% 1.645
95% 1.960
98% 2.326
99% 2.576
99.5% 2.807
99.9% 3.291
99.99% 3.891
99.999% 4.417
9-Jun-2025
Added a feature to display price projection labels at z-score levels 3, 2, 1, 0, -1, -2, 3.
This provides a range for prices available at the current time to help decide whether it is worth entering a trade. If the range of prices from say z=|2| to z=|1| is too narrow, then a trade at the current time may not be worth the risk.
Added plot for z-score moving average.
28-Jun-2025
Added Settings option for # of Std.Deviation level Price Labels to display. The default is 3. Min is 2. Max is 6.
This feature allows likelihood assessment for Fibonacci price projections from higher time frames at lower time frames. A Fibonacci price projection that falls outside |3.x| Std.Deviations is not likely.
Added Settings option for Chart Bar Count and Target Label Offset to allow placement of price labels for the standard z-score levels to the right of the window so that these are still visible in the window.
Target Label Offset allows adjustment of placement of Target Price Label in cases when the Target Price Label is either obscured by the price labels for the standard z-score levels or is too far right to be visible in the window.
Practice makes perfect.
Use this indicator at your own risk

Multi-Timeframe Horizontal LinesThis Pine Script indicator plots horizontal lines at the high and low prices of the most recent 1-hour and 15-minute candles. Users can customize the color and width of the lines for each timeframe. The lines are updated dynamically, with previous lines removed to keep the chart clean.

Jigsaw Premium Trend IndicatorThe Jigsaw Premium Trend Indicator is an exclusive tool designed for premium members, offering a sophisticated trend analysis with customizable EMAs (10, 21, 55, 200) and a 200-period MA. Featuring thinner lines for clarity, this indicator allows premium users to toggle visibility of each EMA, adjust positions manually with clickable editing, and track trends dynamically as the chart moves. Perfect for identifying key market trends, it’s a must-have for advanced trading strategies.

Jigsaw Premium Trend IndicatorThe Jigsaw Premium Trend Indicator is an exclusive tool designed for premium members, offering a sophisticated trend analysis with customizable EMAs (10, 21, 55, 200) and a 200-period MA. Featuring thinner lines for clarity, this indicator allows premium users to toggle visibility of each EMA, adjust positions manually with clickable editing, and track trends dynamically as the chart moves. Perfect for identifying key market trends, it’s a must-have for advanced trading strategies.
