Step 1: Draw Thursday HighScript Description: Thursday High Marker
This is an automated charting tool designed to identify the high of each Thursday and display it as a key reference level for future trading sessions.
Core Functionality:
The script's logic is simple and precise. It waits for the trading session on Thursday to complete. At the very beginning of Friday, it looks back, finds the highest price from Thursday, and draws a clean, white horizontal line at that level.
Key Features:
Automatic: You don't need to do anything. The script finds and draws the level on its own every week.
Forward-Looking: The line extends to the right indefinitely, allowing you to see how future price action interacts with this key level.
Self-Cleaning: To keep your chart uncluttered, the script automatically deletes the previous week's line when it draws the new one.
Lightweight: It performs a single, simple task, so it doesn't slow down your chart.
Purpose in Trading:
Traders use this kind of indicator to track significant weekly price points. The high of a late-week session like Thursday is often considered an important liquidity level. A break above this line can signal bullish strength or a "liquidity sweep," making it a valuable point of interest for making trading decisions on Friday and into the following week.
Cycles

JS Elite XAUUSD Scalper v1.0📈 Elite XAUUSD Scalper v1.0 – A Premium Scalping Strategy for Gold
The Elite XAUUSD Scalper v1.0 is a high-performance scalping strategy designed to capture quick price movements in the XAUUSD (Gold) market. Built with precision and optimized for intraday trading, this strategy uses a combination of Fast & Slow EMAs, ATR (Average True Range), and advanced Order Block & Liquidity Sweep logic to identify profitable opportunities in real-time.
Key Features:
Multiple Confluences: The strategy utilizes the HTF Trend Filter, RSI, Volume Analysis, and Order Blocks to ensure that trades are placed with the highest probability of success.
Real-time Entry & Exit Signals: Automated long and short entries with Take-Profit (TP), Stop-Loss (SL), and Partial TP levels for precise risk management.
Trailing Stop: Automatically trails stop-loss to lock in profits as the price moves in your favor, ensuring that you can ride the trend while protecting your gains.
Alerts: Get notified of long and short signals in real-time via TradingView alerts. Never miss a trade!
Strategy Logic:
Trend Filter: The strategy incorporates a higher time-frame (HTF) trend filter, which ensures that trades are taken only in the direction of the overall trend.
Scalping Precision: The Fast EMA (4) and Slow EMA (14) ensure timely entry and exit points, while the ATR (2) adds an extra layer of risk management, ensuring your stops are intelligently placed.
Risk-to-Reward: Set to a 2:1 reward-to-risk ratio, with an option for partial take-profit at 1.2x RR, allowing you to lock in gains while letting the trade run.
Order Block & Liquidity Sweep: Identifies price levels with high institutional interest, ensuring your trades align with market liquidity.
Ideal For:
Intraday Traders: This strategy is perfect for traders looking to capitalize on fast, small price movements in XAUUSD (Gold).
Scalpers & Swing Traders: It’s designed to handle quick moves while minimizing drawdown and securing profits during market swings.
Why Choose Elite XAUUSD Scalper v1.0?
Customizable: Adjust the strategy's risk parameters, trailing stop, and partial TP to suit your trading style and risk tolerance.
Highly Accurate: Combining the Fast & Slow EMAs, ATR, and order block logic, this strategy increases the accuracy of your trades, helping you stay ahead of market movements.
Automated: Set it and forget it — the strategy takes care of entries, exits, and risk management, freeing you to focus on other markets or activities.
🚀 Start Trading with Elite XAUUSD Scalper v1.0 Today!
Unlock the power of high-frequency scalping with the Elite XAUUSD Scalper v1.0. Get access to the strategy and start trading smarter today.
💬 Disclaimer
This strategy is for educational purposes only. Past performance is not indicative of future results. Use this strategy at your own risk and ensure that you fully understand its features and risks before trading with real capital.

Cumulative Price🎯 Cumulative Price - Usage Framework
🧭 Purpose
Cumulative Price offers a simple contextualization of price action within a daily session.
It resets to zero daily, tracking the cumulative range of price movement in ticks — a concept similar to cumulative delta, but focused purely on price activity, not volume.
🧠 Core Concept
The oscillator shows results from effort accumulate over time. Instead of measuring who is buying or selling, it reveals how far is pushing relative to zero.
🔔 Signal Types
⚖️ Zero Signal
Triggered when the oscillator crosses above or below the zero line.
📌 Interpreted as:
Price is testing fairness or market agreement.
This level is a balancing point — price may accept it (continue) or reject it (reverse).
🚩 Peak Signal
Triggered when the oscillator reaches a new extreme, defined by ATR-based thresholds.
📌 Interpreted as:
Price is undergoing strong effort — likely accumulation or distribution.
Could signal a transition, consolidation, or imminent breakout/reversal.
🧩 How to Use
Approach both signals with thoughtful market questioning:
🧐 Something significant is happening — what is it?
📈 How intense is the move? Does it align with volatility or deviate from it?
🌐 Where does this action sit in broader market context?
🧪 Analytical Tips
Zero Signals are useful for:
Identifying reversion points or fairness tests.
Monitoring price acceptance around the session midpoint.
Peak Signals help:
Spot early accumulation/distribution behavior.
Anticipate volatility expansion or fade exhaustion.
💡 Additional Thoughts
This tool does not dictate trades. Instead, it provides context.
Combine it with tools like Cumulative Delta for a layered analysis of price result and volume effort.
Use it to frame narratives, not absolutes. Ask:
"If this is happening here, what does that say about intent?"

Cumulative Volume Delta with MAfor higher timeframes , i use 9 or 11 ema , and 5 seconds on 1 day. moving average of the cvd not the raw volume . i use it with the impulse macd and find momentum trades or selloffs when moving averages cross .

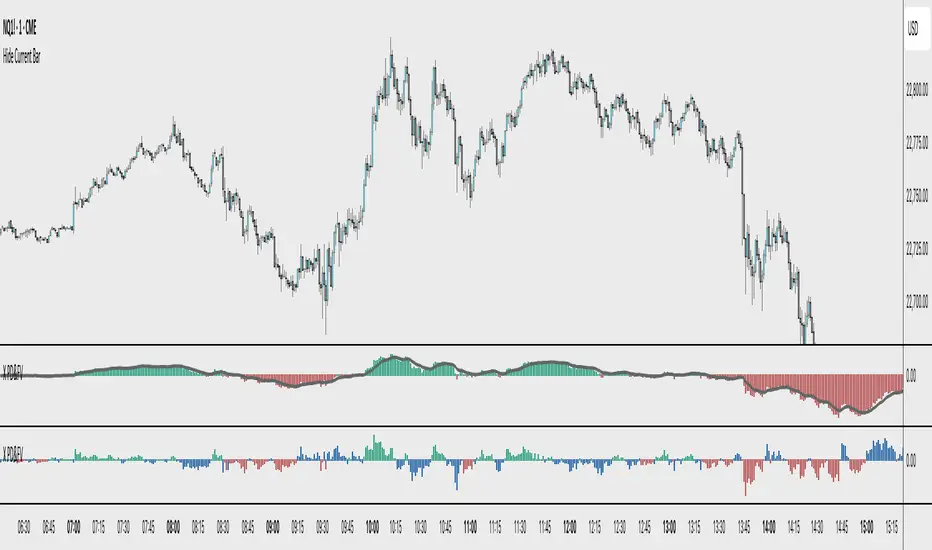
X PD&FVVisualizes the price's premium or discount relative to a moving average benchmark, highlighting mean-reversion and trend-continuation opportunities. While the underlying math is simple, the application is nuanced and can enhance decision-making in both trending and ranging market conditions.
Core Logic:
This tool calculates a custom **spread value**, defined as the distance between the current price and a chosen exponential moving average (EMA). Specifically:
When the current price is **above** the EMA, the spread is calculated as `low - EMA`.
When the price is **below** the EMA, the spread is calculated as `high - EMA`.
This approach creates a dynamic spread that reflects deviation from the EMA, with histogram bars:
Green when the spread is positive (suggesting a price premium),
Red when the spread is negative (suggesting a discount).
A secondary EMA (default 9-period) is applied to the spread itself, plotted as a smoother line over the histogram. This "EMA of spread" line can be interpreted as a moving reference level for detecting directional shifts in momentum.
Interpretation:
Zero Line = Fair Value: The horizontal zero axis represents equilibrium relative to the moving average. Movement toward or away from this line signals potential shifts in market bias.
Trend Following Use: In trending markets, traders can:
Buy when the spread dips below its EMA (discount within uptrend),
Sell when the spread rises above its EMA (premium within downtrend).
Mean Reversion Use: A return to the zero line (fair value) often acts as an **inflection point**, which traders can monitor for either:
Trend continuation (bounce away from zero), or
Reversal (cross through zero).
Customization:
EMA length (default 50) is adjustable to fit different timeframes or asset volatility.
BGSwing StrategyThis Pine Script® strategy detects bullish and bearish liquidity levels (SSL/BSL) based on swing points and executes trades based on breakout-failure logic.
✨ Features:
• Automatically identifies Swing Highs (BSL) and Swing Lows (SSL)
• Configurable strategy execution on Break & Fail (Break and Close Back)
• Optional buy/sell direction filtering
• Customizable Take Profit & Stop Loss (in points)
• Visual liquidity levels drawn as horizontal lines
• Optional signal labels displayed directly on the chart
⚙️ Parameters:
• Liquidity Strength: defines the number of bars for valid highs/lows
• Direction Filter: Buy only / Sell only / Both
• Line style, width, and color customization
• Option to auto-delete old liquidity levels
Ideal for traders using price action and smart money concepts who want clean entry logic and visual confirmation.
Enjoy and use responsibly. 📈

Altcoins + ETH (brez stablecoinov) / BTCWhen chart hits cca 0.3 of value it's sign the beginning ALT season.

[T] FVG Candles with Distance PriorityThis script will mark out historical FVG candles that are closest to where price is currently.
It will draw a box around the candle body at high/low and midpoint (CE) and extend the boxes right to current price.
The distance priority setting will mark historical FVGs closest to where price is currently at; for the max defined number of boxes.
The levels do not have an option to be marked as mitigated - as this indicator is intended for HTF charts, where these levels are considered "permanent" support and resistance levels.

VWAP + HL + EMAsVWAP
Yesterday’s High and Low
Today’s High and Low
EMAs (20, 50, 100, 200)
VWAP
Yesterday’s High and Low
Today’s High and Low
EMAs (20, 50, 100, 200)

My script//@version=5
indicator("NQ Fib + True Open Strategy ", overlay=true, max_lines_count=500)
// === Inputs ===
fibLevel1 = input.float(0.79, "79% Fib Level", minval=0, maxval=1, step=0.01)
fibLevel2 = input.float(0.85, "85% Fib Level", minval=0, maxval=1, step=0.01)
trueOpenTime = input.session("0930-1000", "True Open Time (EST)")
useVolumeFilter = input(true, "Use Volume Filter")
minVolumeRatio = input.float(1.5, "Volume Spike Ratio", minval=1, step=0.1)
trendLength = input.int(5, "Trend Leg Length", minval=1)
// === Trend Detection ===
upTrend = ta.highest(high, trendLength) > ta.highest(high, trendLength) and
ta.lowest(low, trendLength) > ta.lowest(low, trendLength)
downTrend = ta.lowest(low, trendLength) < ta.lowest(low, trendLength) and
ta.highest(high, trendLength) < ta.highest(high, trendLength)
// === Fibonacci Levels ===
swingHigh = ta.highest(high, 10)
swingLow = ta.lowest(low, 10)
priceRange = swingHigh - swingLow
fib79 = swingLow + priceRange * fibLevel1
fib85 = swingLow + priceRange * fibLevel2
// === True Open Price ===
isTrueOpenTime = time(timeframe.period, trueOpenTime)
var float trueOpenPrice = na
if isTrueOpenTime
trueOpenPrice := open
// === Volume Filter ===
volumeAvg = ta.sma(volume, 20)
validVolume = not useVolumeFilter or (volume >= volumeAvg * minVolumeRatio)
// === Entry Conditions ===
nearFib79 = math.abs(close - fib79) <= ta.atr(14) * 0.25
nearFib85 = math.abs(close - fib85) <= ta.atr(14) * 0.25
nearOpenPrice = not na(trueOpenPrice) and math.abs(close - trueOpenPrice) <= ta.atr(14) * 0.25
buySignal = upTrend and (nearFib79 or nearFib85) and nearOpenPrice and validVolume
sellSignal = downTrend and (nearFib79 or nearFib85) and nearOpenPrice and validVolume
// === Plots ===
plot(fib79, "79% Fib", color.new(color.blue, 0), linewidth=1)
plot(fib85, "85% Fib", color.new(color.purple, 0), linewidth=1)
plot(trueOpenPrice, "True Open Price", color.new(color.orange, 0), linewidth=2)
plotshape(buySignal, "Buy", shape.triangleup, location.belowbar, color.new(color.green, 0), size=size.small)
plotshape(sellSignal, "Sell", shape.triangledown, location.abovebar, color.new(color.red, 0), size=size.small)

HMA Crossover + ATR + Curvature (Long & Short)📏 Hull Moving Averages (Trend Filters)
- fastHMA = ta.hma(close, fastLength)
- slowHMA = ta.hma(close, slowLength)
These two HMAs act as dynamic trend indicators:
- A bullish crossover of fast over slow HMA signals a potential long setup.
- A bearish crossunder triggers short interest.
⚡️ Curvature (Acceleration Filter)
- curv = ta.change(ta.change(fastHMA))
This calculates the second-order change (akin to the second derivative) of the fast HMA — effectively the acceleration of the trend. It serves as a filter:
- For long entries: curv > curvThresh (positive acceleration)
- For short entries: curv < -curvThresh (negative acceleration)
It helps eliminate weak or stagnating moves by requiring momentum behind the crossover.
📈 Volatility-Based Risk Management (ATR)
- atr = ta.atr(atrLength)
- stopLoss = atr * atrMult
- trailStop = atr * trailMult
These define your:
- Initial stop loss: scaled to recent volatility using ATR and atrMult.
- Trailing stop: also ATR-scaled, to lock in gains dynamically as price moves favorably.
💰 Position Sizing via Risk Percent
- capital = strategy.equity
- riskCapital = capital * (riskPercent / 100)
- qty = riskCapital / stopLoss
This dynamically calculates the position size (qty) such that if the stop loss is hit, the loss does not exceed the predefined percentage of account equity. It’s a volatility-adjusted position sizing method, keeping your risk consistent regardless of market conditions.
📌 Execution Logic
- Long Entry: on bullish HMA crossover with rising curvature.
- Short Entry: on bearish crossover with falling curvature.
- Exits: use ATR-based trailing stops.
- Position is closed when trend conditions reverse (e.g., bearish crossover exits the long).
This framework gives you:
- Trend-following logic (via HMAs)
- Momentum confirmation (via curvature)
- Volatility-aware execution and exits (via ATR)
- Risk-controlled dynamic sizing
Want to get surgical and test what happens if we use curvature on the difference between HMAs instead? That might give some cool insights into trend strength transitions.

MSFT Bias at NYSE Open (9:30 ET)have an 85% bias accuracy rate with this indicator. wait for market open

MetaSigmaMetaSigma is a cutting-edge indicator designed for traders who thrive on contrarian strategies. Built on the core principle of mean reversion, MetaSigma identifies statistically significant price extremes and signals potential turning points before the market corrects itself.


Mutant Cycle - Volatility DriverMutant cycle _ volatility Driver
Punti di volatilità settimanali massimo e minimi forti

MOE²: Sniper Entry Signal SystemMOE² General is a closed source indicator designed for active traders in Forex, Crypto, Metals, and Indices. It helps define entries, stop losses, and profit targets by combining classic price action with layered technical analysis.
The script integrates traditional tools such as exponential moving averages, volume surges, and candle pattern recognition. These are used together to validate market structure and highlight actionable trade zones. Entry areas are visually mapped on the chart and paired with logical exit levels to support clarity in decision making.
It is calibrated for short term strategies and performs best on 5 minute to 1 hour timeframes. Signal frequency is intentionally limited to maintain quality over quantity and promote disciplined trade selection.
MOE² General is built for traders who value clean visuals, straightforward logic, and risk awareness. It provides structured guidance without relying on lagging confirmations alone.
All logic is embedded within the tool. No external references or outside dependencies are required.

MA Bands with Dynamic ColorsThe chart displays the 50-day, 100-day, and 200-day moving averages (MAs).
When the 50-day MA is above both the 100-day and 200-day MAs, the chart turns green, indicating a bullish trend with increasing positive momentum.
Conversely, when the 50-day MA is below the 100-day and 200-day MAs, the chart turns red, signaling a bearish trend with negative momentum.
This color-coded system, with green and red clouds, helps traders identify the trend direction and gauge positive or negative momentum for potential trading opportunities.

3-Candle HH/HL or LH/LL (Number Labels Over Candles)What This Script Does:
This Pine Script detects 3 consecutive candlesticks that show:
Higher Highs and Higher Lows → a bullish structure
Lower Highs and Lower Lows → a bearish structure
When such a pattern is found, the script:
Marks each of the 3 candles with a number: 1, 2, and 3
Labels appear centered on each candle (at the close price)
You can adjust:
Label size (tiny → huge)
Background color (bullish/bearish)
Text color
Example:
If candles form:
Candle A: higher high & higher low
Candle B: higher than A
Candle C: higher than B
Then you’ll see 1, 2, 3 labels on those candles in green (or your selected color).
Same goes for a bearish pattern in red.

Global Risk Matrix [QuantAlgo]🟢 Overview
The Global Risk Matrix is a comprehensive macro risk assessment tool that aggregates multiple global financial indicators into a unified risk sentiment framework. It transforms diverse economic data streams (from currency strength and liquidity measures to volatility indices and commodity prices) into standardized Z-Score readings to identify market regime shifts across risk-on and risk-off conditions.
The indicator displays both a risk oscillator showing weighted average sentiment and a dynamic 2D matrix visualization that plots signal strength against momentum to reveal current market phase and historical evolution. This helps traders and investors understand broad market conditions, identify regime transitions, and align their strategies with prevailing macro risk environments across all asset classes.
🟢 How It Works
The indicator employs Z-Score normalization across various global macro components, each representing distinct aspects of market liquidity, sentiment, and economic health. Raw data from sources like DXY, S&P 500, Fed liquidity, global M2 money supply, VIX, and commodities undergoes statistical standardization. Several components are inverted (USDT.D, DXY, VIX, credit spreads, treasury bonds, gold) to align with risk-on interpretation, where positive values indicate bullish conditions.
This unique system applies configurable weights to each component based on selected asset class presets (Crypto Investor/Trader, Stock Trader, Commodity Trader, Forex Trader, Risk Parity, or Custom), creating a weighted average Z-Score. It then analyzes both signal strength and momentum direction to classify market conditions into four distinct phases: Risk-On (positive signal, rising momentum), Risk-Off (negative signal, falling momentum), Recovery (negative signal, rising momentum), and Weakening (positive signal, falling momentum). The 2D matrix visualization plots these dimensions with historical trail tracking to show regime evolution over time.
🟢 How to Use
1. Risk Oscillator Interpretation and Phase Analysis
Positive Territory (Above Zero) : Indicates risk-on conditions with capital flowing toward growth assets and higher risk tolerance
Negative Territory (Below Zero) : Signals risk-off sentiment with capital seeking safety and defensive positioning
Extreme Levels (±2.0) : Represent statistically significant deviations that often precede regime reversals or trend exhaustion
Zero Line Crosses : Mark critical transitions between risk regimes, providing early signals for portfolio rebalancing
Phase Color Coding : Green (Risk-On), Red (Risk-Off), Blue (Recovery), Yellow (Weakening) for immediate regime identification
2. Risk Matrix Visualization and Trail Analysis
Current Position Marker (⌾) : Shows real-time location in the risk/momentum space for immediate situational awareness
Historical Trail : Connected path showing recent market evolution and regime transition patterns
Quadrant Analysis : Risk-On (upper right), Risk-Off (lower left), Recovery (lower right), Weakening (upper left)
Trail Patterns : Clockwise rotation typically indicates healthy regime cycles, while erratic movement suggests uncertainty
3. Pro Tips for Trading and Investing
→ Portfolio Allocation Filter : Use Risk-On phases to increase exposure to growth assets, small caps, and emerging markets while reducing defensive positions during confirmed green phases
→ Entry Timing Enhancement : Combine Recovery phase signals with your technical analysis for optimal long entry points when macro headwinds are clearing but prices haven't fully recovered
→ Risk Management Overlay : Treat Weakening phase transitions as early warning systems to tighten stop losses, reduce position sizes, or hedge existing positions before full Risk-Off conditions develop
→ Sector Rotation Strategy : During Risk-On periods, favor cyclical sectors (technology, consumer discretionary, financials) while Risk-Off phases favor defensive sectors (utilities, consumer staples, healthcare)
→ Multi-Timeframe Confluence : Use daily matrix readings for strategic positioning while applying your regular technical analysis on lower timeframes for precise entry and exit execution
→ Divergence Detection : Watch for situations where your asset shows bullish technical patterns while the matrix shows Risk-Off conditions—these often provide the highest probability short opportunities and vice versa

My script// This Pine Script® code is subject to the terms of the Mozilla Public License 2.0 at mozilla.org
// © AlgoTrade_Pro
//@version=5
indicator(title='Twin Range Filter ', overlay=true, timeframe='')
//Inputs
TRsource = input(defval=close, title='Source')
TRper1 = input.int(defval=27, minval=1, title='Fast period')
TRmult1 = input.float(defval=1.6, minval=0.1, title='Fast range')
TRper2 = input.int(defval=55, minval=1, title='Slow period')
TRmult2 = input.float(defval=2, minval=0.1, title='Slow range')
//Calculations
smoothrng(TRx, TRt, TRm) =>
TRwper = TRt * 2 - 1
TRavrng = ta.ema(math.abs(TRx - TRx ), TRt)
TRsmoothrng = ta.ema(TRavrng, TRwper) * TRm
TRsmoothrng
TRsmrng1 = smoothrng(TRsource, TRper1, TRmult1)
TRsmrng2 = smoothrng(TRsource, TRper2, TRmult2)
TRsmrng = (TRsmrng1 + TRsmrng2) / 2
rngfilt(TRx, TRr) =>
TRrngfilt = TRx
TRrngfilt := TRx > nz(TRrngfilt ) ? TRx - TRr < nz(TRrngfilt ) ? nz(TRrngfilt ) : TRx - TRr : TRx + TRr > nz(TRrngfilt ) ? nz(TRrngfilt ) : TRx + TRr
TRrngfilt
TRfilt = rngfilt(TRsource, TRsmrng)
TRupward = 0.0
TRupward := TRfilt > TRfilt ? nz(TRupward ) + 1 : TRfilt < TRfilt ? 0 : nz(TRupward )
TRdownward = 0.0
TRdownward := TRfilt < TRfilt ? nz(TRdownward ) + 1 : TRfilt > TRfilt ? 0 : nz(TRdownward )
TRSTR = TRfilt + TRsmrng
TRSTS = TRfilt - TRsmrng
TRFUB = 0.0
TRFUB := TRSTR < nz(TRFUB ) or close > nz(TRFUB ) ? TRSTR : nz(TRFUB )
TRFLB = 0.0
TRFLB := TRSTS > nz(TRFLB ) or close < nz(TRFLB ) ? TRSTS : nz(TRFLB )
TRTRF = 0.0
TRTRF := nz(TRTRF ) == TRFUB and close <= TRFUB ? TRFUB : nz(TRTRF ) == TRFUB and close >= TRFUB ? TRFLB : nz(TRTRF ) == TRFLB and close >= TRFLB ? TRFLB : nz(TRTRF ) == TRFLB and close <= TRFLB ? TRFUB : TRFUB
//Entry Signals
TRlong = ta.crossover(close, TRTRF)
TRshort = ta.crossunder(close, TRTRF)
//Plots
plotshape(TRlong, title='Long', text='BUY', style=shape.labelup, textcolor=color.white, size=size.tiny, location=location.belowbar, color=#1be600)
plotshape(TRshort, title='Short', text='SELL', style=shape.labeldown, textcolor=color.white, size=size.tiny, location=location.abovebar, color=#e60000)
Trfff = plot(TRTRF, color=color.white)
mPlot = plot(ohlc4, title='', style=plot.style_circles, linewidth=0)
longFillColor = close > TRTRF ? color.green : na
shortFillColor = close < TRTRF ? color.red : na
fill(mPlot, Trfff, title='UpTrend Highligter', color=longFillColor, transp=90)
fill(mPlot, Trfff, title='DownTrend Highligter', color=shortFillColor, transp=90)
//Alerts
alertcondition(TRlong, title='Long', message='Long')
alertcondition(TRshort, title='Short', message='Short')
//End

Heatmap w/ ATRThis script combines Heatmap Volume with a scaled ATR (Average True Range) overlay for dynamic market insight. Volume bars are color-coded based on how many standard deviations they deviate from a moving average, helping identify spikes, absorption, or anomalies.
The ATR is scaled relative to the maximum volume observed to maintain visual alignment in the same pane. This allows traders to compare price volatility (ATR) against real market activity (volume) in one view.
Use this overlay to:
Spot high-volatility, high-conviction moves (rising ATR + red/orange bars)
Detect low-volume fakeouts (high ATR, cool-colored bars)
Identify compression zones before expansion (low ATR + normal volume)

水印This custom indicator allows you to add a watermark to your TradingView charts, offering a straightforward way to label or brand your chart images. Whether you want to mark your charts for personal use, sharing, or copyright protection, this indicator provides a flexible and easy-to-use solution.
TG:https://t.me/BTC_133333
