US Tariffs Global Stock Market Crash and International Reactions
Hello, I am Forex Trader Andrea Russo and today I am talking to you about what happened yesterday, Liberation Day. Yesterday, US President Donald Trump announced new "reciprocal" customs duties against several countries, including the European Union, China, the United Kingdom and many others. This announcement, called "Liberation Day" by the White House, has triggered a series of chain reactions on global markets.
The new tariffs, ranging from 10% to 46%, have been justified as a measure to rebalance international trade practices and protect the American economy. However, the immediate impact has been a significant collapse of global stock markets. Investors, worried about possible retaliation and the escalation of trade tensions, have reacted by massively selling their shares.
In Europe, European Commission President Ursula von der Leyen said the EU was ready to respond with appropriate measures, while Italian President Sergio Mattarella called the new tariffs a "profound mistake." The oil market also took a hit, with the price of WTI falling to $69.87 a barrel.
The impact on financial markets was devastating. On Wall Street, the Dow Jones closed down 3.5%, while the Nasdaq lost 4.2%. European stocks were not far behind, with London's FTSE 100 losing 3.8% and Frankfurt's DAX falling 4.1%. Asian stocks also suffered sharp declines, with Japan's Nikkei closing down 3.7%.
For forex traders, these dynamics represent both a challenge and an opportunity. Market volatility can offer opportunities for profit, but it also requires careful risk management. It is essential to closely monitor geopolitical news and market reactions to make informed decisions.
In conclusion, the global economic landscape is in a phase of great uncertainty. As a trader, it is essential to stay updated and ready to react quickly to changes. Keep following my updates for more analysis and trading tips.
Happy trading everyone!
Community ideas

The Power of a Trading System with the Right Mental State
📅 April 3, 2025
Over the years, I’ve learned that discipline in trading isn’t just about having a system — it’s about being in the right state of mind to follow that system. 🧘♂️📈
You can have the cleanest rules, the best strategy, and solid backtests … but if your mindset is off, none of it matters. That’s when hesitation creeps in. Or worse — revenge trades, FOMO, or doubt.
So I started focusing on one thing: my internal state before and during a trade. 🧭
🔄 How I Manage My Mindset
✅ 1. Pre-Trade Check-In
Before I trade, I ask:
How do I feel right now?
If I’m not grounded, I don’t trade. Simple. I’ve learned the hard way that it’s not worth it.
🔥 2. Anchoring a Disciplined State
I recall moments where I executed perfectly — calm, focused, in control. I mentally step into that version of myself before every session.
🧩 3. Staying Congruent
During a trade, I pay attention to my behavior. If I notice myself drifting from my plan — I pause, breathe, and realign.
🎯 Why This Works
A trading system gives structure.
But structure means nothing without mental discipline.
By mastering my emotional state, I stopped sabotaging my own edge.
No more reacting from fear. No more chasing. Just clean, committed execution. 🧘♂️✅
💬 Final Thought
Consistency doesn’t come from the market — it comes from me.
So now, before I look at the chart, I check in with myself first.
Because when my state is right, my trading flows. ⚖️✨
If this resonates, drop your thoughts below — let’s grow together.

Trust, faith and self-discipline: the real challenge to tradingTrust, faith and self-discipline is the real challenge to trading, it's not the forecasting that's hard

HOW FOREX BROKERS MANIPULATE YOU TRADING? Real Example
Last month, I spotted a nice trading position on NZDCAD forex pair.
I shared that with my TradingView subscribers immediately after I placed the trade.
Though, the price moved exactly as it was predicted, the half of the members did not make any penny from this signal, while another half made a nice profit.
It happened because of one rare thing that I absolutely hate in trading.
Learn about a major frustration and market manipulation in trading, that no one will tell you about.
Here is the trading position that I spotted.
It was a classic price action trading setup based on a double top pattern.
Trade was taken on a retest of a broken neckline aiming at the closest strong support and stop loss lying about the tops.
Though, initially, the market started to fall rapidly. But it reversed, not being able to reach the target.
Watching that bullish rally resumes, I send the signal to my students to close the trade on entry, and I also did that personally.
I felt myself quite sad that I did not mange cash out from that trade.
Later on in the evening, surprisingly, I started to receive multiple thank you messages from my members that they made a good profit with that signal.
How could it be?
I decided to anonymously ask the members, how did they close the trade.
More than half of the members replied that the trade reached take profit.
Can it be possible? My TP was not reached and it was still quite far from the lowest low.
Now, examine the trading setup on NZDCAD on charts of different popular forex brokers.
On these 6 charts, you can see NZDCAD pair on OANDA, CAPITALCOM, IC MARKETS, ICE, FXCM, FOREX.COM brokers.
While in half of the instances TP was not reached, in other half, TP was reached and the price went even lower.
Why it happened?
There are the rare situations in Forex trading, when the price action on one broker can be very different from another.
It happens because different brokers have different liquidity providers, spreads, order execution methods and so on.
That is why the selection of a good broker is so vital in trading.
If you use TradingView for chart analysis, make sure that you watch all the instruments of one broker.
Moreover, once you start trading your strategy, always check how the price acted with different broker quotes.
If you will see a lot of instances that your tp is not hit, while on another broker it would, it will be a signal for you to change the broker.
When I started learning trading, no one told be that important nuance of Forex trading.
But knowing that is a very significant step in your trading journey.
❤️Please, support my work with like, thank you!❤️
I am part of Trade Nation's Influencer program and receive a monthly fee for using their TradingView charts in my analysis.

What Is an ABCD Pattern, and How Can You Use It in Trading?What Is an ABCD Pattern, and How Can You Use It in Trading?
Are you looking to improve your trading strategy and technical analysis skills? The ABCD trading pattern may be just what you need. This tool may help you identify potential market reversals and decide when to enter a trade. Keep reading to learn more about the ABCD pattern and how to apply it to your trading strategy.
What Is an ABCD Pattern?
The ABCD pattern is one of the basic harmonic patterns. It gives traders an idea of where the market might reverse. Therefore, when combined with other forms of technical analysis, it may be a great addition to your trading arsenal.
The ABCD pattern comprises two legs, AB and CD, and one retracement, BC, with D as an entry point. More specifically, an ABCD can be identified by:
- AB Leg: A trend starts at A and makes a high or low at B.
- BC Retracement: The price retraces from B to C.
- CD Leg: The trend continues from C to D.
- D Entry Point: Once another high or low forms and traders enter at D.
These price movements create the “zig-zag” or “lightning bolt” shapes.
In fact, ABCD patterns are present across every market and every timeframe. The up-down movements in financial assets represent opportunities to identify and trade ABCD patterns.
Why Use the ABCD Pattern in Your Trading Strategy?
Before we move on to identifying and trading the ABCD pattern, it’s worth explaining why you might want to consider using it. Here are a few reasons traders favour the ABCD pattern:
- It’s one of the harmonic patterns suitable for traders of all experience levels.
- It’s versatile and works for stocks, commodities, and cryptocurrencies*, not just forex trading.
- Traders use ABCD patterns to make informed decisions about potential turning points in the market.
- It can form the basis of a working trading strategy if used correctly alongside other forms of technical analysis.
- It provides quite an effective risk/reward ratio if reversals are caught.
How Traders Identify an ABCD Trading Pattern
The first step in finding ABCDs is to look for that classic zig-zag shape. Once you’ve found one, it’s time to apply Fibonacci ratios to confirm the pattern. If you’re struggling, you can consider using pre-made ABCD pattern indicators or scanners to help your eyes get used to spotting them.
The ABCD pattern requires that the BC leg is between a 38.2% to 78.6% retracement of AB, ideally between 61.8% and 78.6%. This means that if you put a Fibonacci retracement tool at A and B, C should be between 0.382 and 0.786.
The second CD leg should be a 127.2% to 161.8% extension of the BC retracement. For extra confirmation, consider specifying that AB is equal to the same length as CD.
While it can be tempting to start trading based on these conditions, you’ll find that, in practice, identifying point D can be trickier than it seems. That’s why traders typically use Fibonacci ratios, key levels, candlestick patterns, and higher timeframe convergence to confirm their entries, which we will touch on shortly.
ABCD Pattern Examples
Now that we understand how to identify the ABCD pattern, we can start applying it to real price action.
Note that the ratios won’t always be perfect, so allowing for slight variability above or below the defined ratios is acceptable.
Bullish ABCD Pattern
For a bullish formation, the following must be present:
- The AB leg should be between the high A and low B.
- The BC bullish retracement should be between the low B and high C, which is below the high A.
- The CD leg should be between the high C and low D.
- BC is a 38.2% to 78.6% retracement of AB, preferably between 61.8% and 78.6%.
- CD is a 127.2% to 161.8% extension of BC.
Additionally, you may look for AB to be an identical or similar length to CD.
Entry: Traders set a buy order at D.
Stop Loss: The theory suggests traders place a stop below a nearby support level or use a set number of pips.
Take profit: Traders place take-profit orders at the 38.2%, 50%, or 61.8% retracement of CD or hold for higher prices if they believe there’s the potential for further bullishness.
Bearish ABCD Pattern
The bearish ABCD chart pattern is essentially the same, just with the reversed highs and lows. As such:
- The AB leg should be between the low A and high B.
- The BC bullish retracement should be between the high B and low C.
- The CD leg should be between the low C and high D.
- BC is a 38.2% to 78.6% retracement of AB, preferably between 61.8% and 78.6%.
- CD is a 127.2% to 161.8% extension of BC.
You can choose to apply the same AB = CD rules in a bearish ABCD pattern if desired.
Entry: Traders typically place a sell order at D.
Stop Loss: A stop may be placed above a nearby resistance level or at a set number of pips.
Take profit: Traders often take profits at the 38.2%, 50%, or 61.8% retracement of CD or hold for lower prices if there’s a bearish trend on a higher timeframe.
ABCD Pattern Strategy
A momentum-based ABCD trading strategy can help traders confirm potential reversals by incorporating indicators like the RSI (Relative Strength Index). This approach often adds an extra layer of confluence.
Entry
- Traders may wait for point D to form and for the RSI to indicate overbought or oversold conditions, typically above 80 or below 20.
- Additional confirmation can be sought if there is a divergence between price and RSI, signalling weakening momentum.
- Once the RSI crosses back into normal territory, it can suggest a reversal, providing an opportunity to enter the market.
Stop Loss
- A stop loss is often placed slightly above or below point D, depending on whether the formation is bearish or bullish, respectively. This helps potentially manage risk in case the reversal doesn’t hold.
Take Profit
- Traders can consider taking profits at Fibonacci retracement levels of leg CD, such as 38.2%, 50%, or 61.8%.
- Another common target is point C, but traders may also hold the position for longer if further price movement is anticipated.
Looking for Additional Confluence
Given that trading the ABCDs usually relies on setting orders at specific reversal points, consider looking for extra confirmation to filter potential losing trades. Below, you’ll find three factors of confluence you can use to confirm your entries.
Key Levels
If your analysis shows that D is projected to be in an area of significant support or resistance, there’s a greater chance that the level will hold and the price will reverse in the way you expect.
ABCD Timeframe Convergence
One technique to potentially enhance the reliability of ABCD chart patterns is to check for multiple timeframes. When you identify the formation on a lower timeframe—say, the 5-minute chart—you can then look to a higher timeframe chart, such as the 30-minute or 1-hour chart to see the overall trend.
If the pattern converges with the longer-term trend, it strengthens the analysis and increases the likelihood of an effective trade.
Candlestick Patterns
Some traders look for particular candlestick patterns to appear. The hammer and shooting star patterns are commonly used by ABCD traders for extra confirmation, as are tweezer tops/bottoms and engulfing candles. You could choose to wait for one of these candlesticks to form before entering with a market order.
Common Mistakes to Avoid When Identifying an ABCD Chart Pattern
Of course, ABCD patterns aren’t a silver bullet when it comes to effective trading. There are several common mistakes made by inexperienced traders when trading these types of patterns, such as:
- Confusing the ABCD with other harmonic patterns, like the Gartley or three-drive pattern.
- Trading every potential ABCD formation they see. It’s preferable to be selective with entries and look for confirmation.
- Not being patient. ABCDs on higher timeframes can take days, even weeks, to play out.
Experienced traders wait for the pattern to develop before making a trading decision.
- Ignoring key levels. Instead, you could allow them to guide your trades and look for the ABCD pattern in these areas.
The Bottom Line
The ABCD pattern is a versatile tool that can enhance a trader’s ability to identify potential market reversals and refine their overall strategy. When combined with other forms of technical analysis, such as momentum indicators, an ABCD trading strategy can be an invaluable addition to your trading arsenal.
For traders looking to apply the ABCD pattern in forex, stock, commodity, and crypto* markets, consider opening an FXOpen account and take advantage of low-cost, high-speed trading across more than 600 assets. Good luck!
FAQ
What Is an ABCD Trading Pattern?
The ABCD trading pattern is a simple harmonic pattern used by traders to identify potential market reversals. It consists of three price movements: the AB leg, BC retracement, and CD leg, with point D marking a potential entry for a reversal trade. It helps identify changes in trend direction.
How Can You Use the ABCD Pattern in Trading?
Traders identify the ABCD pattern by finding the characteristic zig-zag shape and using Fibonacci ratios to confirm it. Entry points are typically placed at point D, with stop losses and profit targets based on the formation’s structure. Confluence with other technical analysis tools improves its reliability.
Is the ABCD Pattern Bearish or Bullish?
The ABCD pattern can be either bearish or bullish. A bullish ABCD indicates a potential upward reversal, while a bearish ABCD suggests a downward reversal. The structure remains the same, but the highs and lows are reversed.
What Is the ABCD Strategy?
The ABCD strategy revolves around identifying trend reversals using the formation and confirming entry points through tools like Fibonacci retracements or momentum indicators like the RSI for added accuracy.
*At FXOpen UK, Cryptocurrency CFDs are only available for trading by those clients categorised as Professional clients under FCA Rules. They are not available for trading by Retail clients.
This article represents the opinion of the Companies operating under the FXOpen brand only. It is not to be construed as an offer, solicitation, or recommendation with respect to products and services provided by the Companies operating under the FXOpen brand, nor is it to be considered financial advice.

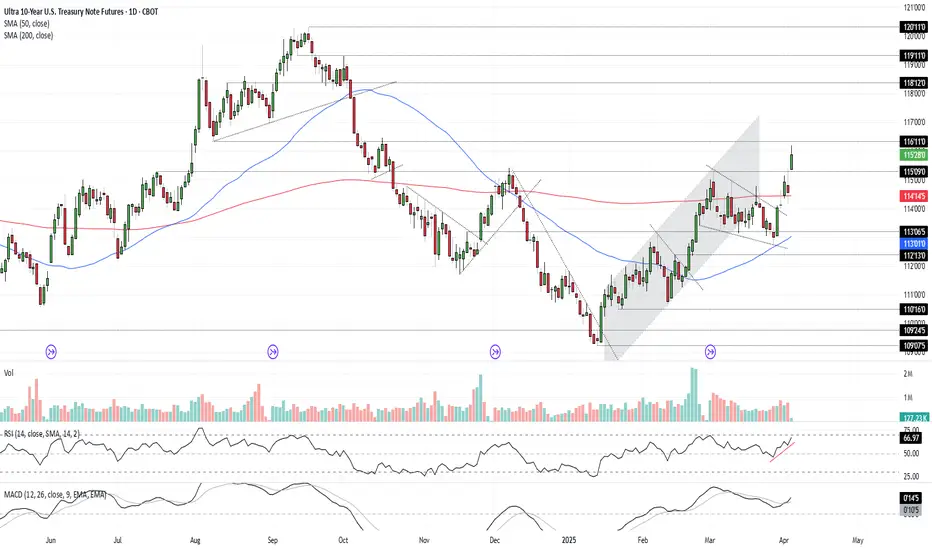
Bonds Don’t Lie: The Signal is ClearU.S. 10-year Treasuries are a crucial cog in the global financial machine, serving as a benchmark borrowing rate, a tool for asset valuation, and a gauge of the longer-term outlook for U.S. economic growth and inflation.
As such, I keep a close eye on 10-year note futures, as they can offer clues on directional risks for bond prices and yields. The price action over the past few days has sent a clear and obvious signal as to where the risks lie: prices higher, yields lower.
Futures had been grinding lower within a falling wedge for several weeks but broke higher last Friday on decent volumes following soft U.S. household spending data. It has since extended bullish the move, reclaiming the 200-day moving average before surging above key resistance at 115’09’0 after Trump’s reciprocal tariff announcement on Wednesday.
RSI (14) is trending higher but isn’t yet overbought, while MACD has crossed the signal line above 0, confirming the bullish momentum signal. That favours further upside, putting resistance at 116’11’0 and 118’12’0 on the immediate radar. For those who prefer it expressed in yield terms, that’s around 4% and 3.8% respectively.
Good luck!
DS
VISUAL INVESTOR: An Investing Tutorial for EveryoneToday is a wonderful day! I am overwhelmed with positive emotions, like a racer who has crossed the finish line. My first book, The Visual Investor, is out on TradingView. It's written for everyone, from those just starting out in the stock market to experienced investors. You could say you're holding it in your hands now.
The idea for this book came to me a long time ago, thanks to the influence of one person, as well as my invisible teachers: Benjamin Graham, Warren Buffett, Charles Munger, Peter Lynch and Mohnish Pabrai. Day after day, I worked on the content of chapters, charts, tables, and drawings to take you from theoretical foundations to applied knowledge that allows you to answer the key questions of any investor: What? When? And how much?
My motivators, namely you, dear subscribers and the TradingView editorial team, also made an invaluable contribution to the creation of this book. Every kind word, constructive criticism and award in the form of “Editors’ Picks” made me happier and helped me to create further.
Why “Visual Investor”? This is my reverence for the technologies we have come to now. The modern investor has incredible opportunities compared to our colleagues, even from the beginning of the 21st century. Access to companies' financial data has become an order of magnitude easier, and their visualization allows for fundamental analysis to be done much faster than before.
Global financial centers are now much closer to investors from different countries, thanks to the development of local regulation, active work of financial institutions and services. All this has expanded the range of investment instruments and formed a new way of life for our savings.
A modern person may not be a passive observer of fluctuations in the purchasing power of his own capital. On the contrary, he can independently make decisions to increase this capacity, using technology and a systematic approach. Unfortunately, unmanaged savings will suffer the unenviable fate of the hundred dollar bill from the beginning of the last century.
This chart shows how the $100 bill has depreciated since 1914 due to inflation. By the beginning of the First World War, the monthly salary of a highly skilled worker or employee could reach exactly this amount. If your super-rich great-great-grandfather buried a chest of these bills, and you found it, you'd probably be furious with him. Because $100 now is like $2 then. “Dear Grandpa, why didn’t you buy something from that list ?” you might say in your heart.
However, we must give credit to our hero, as the propensity to save is a skill that any investor should start with, and something I talk about in the early chapters of my book. As Charles Munger said, “I was a cautious little squirrel who hoarded more nuts than I needed and didn’t climb into my own pile of nuts.”
The book is divided into three parts, allowing you to start with any of them, depending on your current level of knowledge.
Part One
This part will be interesting to anyone who wants to understand why we need investments, what a joint-stock company and a stock exchange are, how the price and its schedule are formed. Duration of study: 3 hours 15 minutes.
Part two
This part will be of interest to anyone who already knows the basics of stock trading but wants to understand the fundamental analysis of a company's business. Duration of study: 5 hours.
Part three
This part will be of interest to anyone who understands the financial statements of companies and wants to build a decision-making system on the stock market based on this knowledge. Duration of study: 11 hours.
I recommend reading the book “Visual Investor” thoughtfully, with pauses to understand each chapter. It is precisely with this measured pace in mind that the estimated duration of study for each block and each article has been calculated. You can move faster if you like. If you devote 1 hour a day to the book, then after 20 days you will be able to master the entire theory. Don't rush to apply the knowledge immediately you've gained in real life. TradingView has great tools for hands-on research, such as the Market Simulator and Paper Trading, that will help you solidify your knowledge without risking your capital. Similarly, civil aviation pilots train on a flight simulator before their first flight. Remember that your knowledge, systematic approach, persistence and a pinch of luck can transform everything around you. But if you still need my support, I'm here. Yours, Capy.
Part One
1. Investing is the ability to say "no" so that you can say "yes"
The reader will learn that investing is a conscious skill of foregoing immediate spending in favor of greater value in the future, based on strategy, patience, and an understanding of the difference between investing and speculation. Duration of study: 15 minutes.
2. Raising initial capital: 4 approaches, of which one is not good
The reader will learn about four ways to form start-up capital for investments, and why borrowed money is the least sensible of them. Duration of study: 10 minutes.
3. The lifestyle of your savings, and why Big Mac?
The reader will learn that investing is a conscious way to preserve and increase the purchasing power of savings, in which the level of potential profit is always proportional to the risk taken. Duration of study: 10 minutes.
4. What is a stock? Let me tell you a story
Using the example of a shoe workshop owner, the reader will learn how companies issue shares to raise capital and expand their business. Duration of study: 15 minutes.
5. Stock Company. Selling something that no one will buy piecemeal
Using the same example, the reader is explained the process of transforming a company into a joint-stock company and conducting an IPO to attract investment. Duration of study: 10 minutes.
6. I dream of entering the stock market. The question is: What for?
The reader learns that going public is a way for a company to make its shares available to a wider range of investors, increase liquidity, and simplify the process of raising capital. Duration of study: 10 minutes.
7. How is the share price formed on the stock exchange? We do it
The reader will learn how the price of a stock is formed on the stock exchange through the mechanism of bids from buyers and sellers, reflecting the balance of supply and demand. Duration of study: 20 minutes.
8. Bid/Offer: The Yin and Yang of Stock Prices
The reader will learn how buy (bid) and sell (offer) orders from the order book on the exchange, determining the mechanism for concluding transactions and the formation of the market price. Duration of study: 20 minutes.
9. Market order or the hunger games of stock trading
The reader will learn that market orders allow shares to be bought or sold immediately without specifying a price, satisfying the current demand or offer at prices available in the order book. Duration of study: 15 minutes.
10. The birth of the chart. The evolution of the tape
The reader will learn how price movement charts are formed from the stock exchange quotes feed and will see historical examples of the evolution of methods for displaying market data. Duration of study: 10 minutes.
11. Japanese Candlesticks: Game of Body and Shadows
The reader will learn how Japanese candlesticks are constructed, including determining the opening, closing, high, and low prices for a selected time interval, as well as the importance of the candlestick body and shadows in analyzing price movements. Duration of study: 20 minutes.
12. A little bit about volumes and the master of all averages
The reader will learn how to analyze trading volumes and use a 252-day moving average to evaluate stock price movements. Duration of study: 10 minutes.
13. My Three Comrades: the Chart, the Screener, and the Watchlist
The reader will learn step-by-step how to use the TradingView platform's chart, screener, and watchlist features to find and track stocks even if he doesn't know the company's ticker. Duration of study: 15 minutes.
14. Two captains of the same ship
The reader will learn how to use fundamental analysis to assess a company's financial strength by adding financial indicators to a chart in TradingView, and why the author prefers this method over technical analysis. Duration of study: 15 minutes.
Part two
15. My crazy partner is Mr. Market!
The reader will learn about the concept of "Mr. Market" introduced by Benjamin Graham, which illustrates the irrationality of market behavior and emphasizes the importance of fundamental analysis in making sound investment decisions. Duration of study: 10 minutes.
16. Picking rules - the Lynch method
The reader will learn about Peter Lynch's investment principles, including the benefits of private investors, the importance of a financial safety net, the need to understand a company's performance before investing, and the importance of analyzing its earnings. Duration of study: 15 minutes.
17. A pill for missed opportunities
The reader will learn how to set up alerts in TradingView to react promptly to changes in stock prices, thereby avoiding missing profitable opportunities to buy or sell. Duration of study: 15 minutes.
18. Man on the shoulders of giants
The reader learns the story of an Indian engineer who, after starting to invest in his 30s, achieved significant success, emphasizing the importance of self-education and inspiration from eminent investors. Duration of study: 10 minutes.
19. Price is what you pay, but value is what you get
The reader will learn about Warren Buffett's approach to investing based on the difference between price and the intrinsic value of a company, and the importance of fundamental analysis in making investment decisions. Duration of study: 10 minutes.
20. Balance sheet: taking the first steps
The reader will learn about the structure of the balance sheet, including the concepts of assets, liabilities, and equity. Duration of study: 30 minutes.
21. Assets I prioritize
The reader will learn which balance sheet items are most important for assessing a company's sales performance, and why the author focuses on cash, accounts receivable, and inventory when analyzing current assets. Duration of study: 20 minutes.
22. A sense of debt
The reader will learn about the structure of liabilities and shareholders' equity on a company's balance sheet, including the differences between short-term and long-term debt, and will understand how to analyze debt burden when assessing a company's financial health. Duration of study: 20 minutes.
23. At the beginning was the Equity
The reader will learn about a company's capital structure, including the concepts of retained earnings and return on investment, and will understand how these items are reflected in the balance sheet. Duration of study: 20 minutes.
24. The income statement: the place where profit lives
The reader will learn about the structure of a company's income statement, including key indicators: revenue, cost, gross and operating profit, as well as the importance of these metrics for assessing the financial condition of the enterprise and their impact on the dynamics of stock prices. Duration of study: 30 minutes.
25. My precious-s-s-s EPS
The reader learns that earnings per share (EPS) is calculated as net income available to common shareholders divided by the number of common shares outstanding, and that diluted EPS considers potential increases in the share count due to employee options and other factors that affect earnings distributions. Duration of study: 20 minutes.
26. What should I look at in the Income statement?
The reader will learn which key income statement metrics — such as revenue, gross profit, operating expenses, debt service expense, net income, and diluted earnings per share (EPS Diluted) — the author believes are most important for assessing a company's financial health. Duration of study: 10 minutes.
27. Cash flow statement or Three great rivers
The reader will learn about the structure of the cash flow statement, which includes three main flows: operating, financial and investing, and will understand how these cash flows affect the financial condition of the company. Duration of study: 20 minutes.
28. Cash flow vibrations
The reader will learn how to analyze a company's operating, investment, and financial cash flows to assess its sustainability, strategy, and ability to effectively manage resources. Duration of study: 20 minutes.
29. Financial ratios: digesting them together
The reader will learn that financial ratios are relations between various financial reporting indicators that allow an objective assessment of the financial condition and value of a company, and will understand how to use key multiples to analyze the investment attractiveness of a business. Duration of study: 25 minutes.
30. What can financial ratios tell us?
The reader will learn about key financial ratios such as Diluted EPS, Price/Earnings Ratio (P/E), Gross Margin, Operating Expense Ratio, Return on Equity (ROE), Days Payable and Days Sales Outstanding, and Inventory to Revenue Ratio, and will understand how to use these metrics to assess a company's financial health and investment attractiveness. Duration of study: 30 minutes.
Part three
31. Price / Earnings: Interpretation #1
The reader will learn how the P/E (price to earnings) ratio helps assess the value of a company by determining how many dollars an investor pays for each dollar of earnings, and will understand why a lower P/E may indicate that a company is undervalued. Duration of study: 25 minutes.
32. Price/Earnings: amazing interpretation #2
The reader will learn an alternative approach to interpreting the P/E ratio by viewing it as the number of years it takes to break even on an investment, assuming the company's earnings are stable. Duration of study: 30 minutes.
33. How to apply an indicator that is only available upon request?
The reader will learn how scripts written in Pine Script work on the TradingView platform and what levels of access there are to them: from completely open to requiring an invitation from the author. The article explains how to request access to an indicator if it is restricted, and what steps to take to add it to a chart once permission is granted. Duration of study: 15 minutes.
34. How to assess the fundamental strength of the company?
The reader will learn about the approach to assessing the financial stability of a company through the aggregation of key financial indicators and multipliers, allowing a visual and quantitative assessment of the dynamics and current state of the business. Duration of study: 30 minutes.
35. How to evaluate the work of company management?
The reader will learn about the approach to assessing the effectiveness of a company's management through the prism of the concept described by Eliyahu Goldratt in his book "The Goal", which focuses on three key indicators: throughput, inventory and operational expenses, and will understand how these indicators affect the financial results of the enterprise. Duration of study: 30 minutes.
36. How to evaluate the state of a company's cash flows?
The reader will learn about the importance of cash flow analysis in assessing a company's financial health, including the interpretation of operating, investing, and financing flows. Duration of study: 25 minutes.
37. How to catch the rainbow by the tail?
The reader will learn how to determine optimal price ranges for buying stocks based on the principles of fundamental analysis and the idea of investing with a margin of safety. Duration of study: 40 minutes.
38. How to convert craziness into results?
The reader will learn how to navigate market volatility, make smart stock selling decisions, and use a fundamental approach to turn emotional market swings into rational investment actions. Duration of study: 35 minutes.
39. How to use Replay to study indicators?
The reader will learn how to use the Market Simulator feature on the TradingView platform to analyze historical data and test indicators, including step-by-step instructions for activating the simulator, selecting the start date, adjusting the playback speed, and interpreting the results when analyzing NVIDIA Corporation stock. Duration of study: 30 minutes.
40. How to explain my decision-making system?
The reader will learn about the author's approach to choosing stocks for investment, which includes an analysis of the fundamental strength of the company, cash flow dynamics, news, P/E multiple and other aspects of the decision-making system. Duration of study: 35 minutes.
41. The most subjective facet of my decision-making system
The reader will learn how news, although difficult to formalize, influences the investment decision-making process and why its interpretation is the most subjective aspect in stock evaluation. Duration of study: 35 minutes.
42. Full instructions for studying the fundamental strength of a company
The reader will learn how to use applied tools to evaluate a company's financial results, visually track their dynamics over time, and analyze the movement of key cash flows, which accelerates the process of selecting companies with strong fundamental indicators. Duration of study: 90 minutes.
43. Full instructions for determining price ranges for opening and closing positions
The reader will learn how to determine optimal price ranges and trade sizes when investing in stocks, based on the principles of value investing and Benjamin Graham's "margin of safety" concept. Duration of study: 120 minutes.
44. 10 tricks for developing discipline or here was Warren
The reader will learn ten practical methods to help investors develop discipline, including using alerts, keeping a trading journal, and developing good habits, and will understand how discipline affects the achievement of investment goals. Duration of study: 40 minutes.
45. The Inside Out Investor
The reader will learn how emotional states such as fear, excitement, and fear of missing out (FOMO) influence investment decisions and will understand how awareness of these emotions helps an investor stick to their chosen strategy and make informed decisions. Duration of study: 20 minutes.
46. Effective inefficiency
The reader will learn about the different approaches to using Stop Losses in investment strategies, their impact on the profit/loss ratio, as well as the concept of market efficiency and strategies in it. Duration of study: 30 minutes.
47. Institute of Intermediation and 24 Coffee Lovers
The reader will learn about the factors that create market inefficiencies, such as delays in the dissemination of information, high volatility, the actions of large players and participant errors, as well as the role of intermediaries - brokers and exchanges - in ensuring the efficiency and convenience of trading in financial markets. Duration of study: 25 minutes.
48. Eternal Sunshine of the Spotless Mind
The reader will learn about the life of Charles Munger, vice chairman of Berkshire Hathaway, his investment philosophy based on common sense and discipline, as well as his views on the importance of personal relationships and moderation in achieving success. Duration of study: 5 minutes.

Calibrating Trading Indicators for Different MarketsCalibrating Trading Indicators for Different Markets: A Beginner's Guide
(Simple Steps to Adjust RSI , MACD , and Other Tools for Better Results)
Key Idea : Just like you'd tune a guitar differently for rock vs. classical music, trading tools like RSI or MACD need adjustments depending on what you're trading (stocks, crypto, forex) and how it moves. This guide shows you how to tweak these tools using price swings (pivot points) to make them work better for your specific asset.
---
Why "One Size Fits All" Doesn't Work
Most traders use default settings for indicators (like RSI's 14-day period). But these defaults were created for "average " markets. Real markets aren't average!
Example:
- Crypto ( CME:BTC1! ) : Super volatile → Needs faster, more sensitive indicators.
- Blue-Chip Stocks ( NASDAQ:AAPL ) : Less wild swings → Needs slower, smoother indicators.
If you use the same RSI settings for both, you'll get bad signals. Calibration fixes this.
---
The Pivot Point Method for Calibration
One effective approach to calibration is measuring the natural rhythm of price swings between high and low points. Here's how to do it step by step:
Step 1: Find Pivot Points on Your Chart
Pivot points are like "price turning points." Use TradingView's ZigZag indicator (or draw them manually) to spot these swings.
How to Add ZigZag on TradingView :
1. Open your chart.
2. Click "Indicators" → Search " ZigZag " → Select it.
3. Adjust settings (defaults work fine for starters).
The ZigZag will draw lines between significant highs (peaks) and lows (valleys).
---
Step 2: Measure the "Rhythm" of the Market
Count the bars (candles) between pivot points to find the market's natural cycle.
Example :
- If Bitcoin swings from peak to peak every 14 bars on average, its "cycle" is 14 bars.
- If Apple does this every 16 bars, its cycle is 16 bars.
In the picture above, we used the Williams Fractal to identify pivots.
Formula for Indicator Settings :
- RSI Period = Half the average cycle → If cycle = 16 bars → RSI = 8 days.
- MACD Settings : Fast EMA = ¼ cycle, Slow EMA = ½ cycle → Cycle = 16 → Fast EMA = 4, Slow EMA = 8
---
Step 3: Test Your Calibrated Indicators
Backtest on TradingView :
1. Add your indicator (e.g., RSI) with the new settings.
2. Use the Strategy Tester (click "Add to Chart" → " RSI Strategy ") to see if signals improve.
Look For :
- Fewer false signals (e.g., RSI saying "oversold" too early).
- Clearer trends (MACD crossovers matching price moves).
---
Calibrating Popular Indicators (Simple Rules)
1. RSI (Relative Strength Index)
- Default : 14 days.
- Calibrated : Half the average cycle length.
- Example : Cycle = 16 bars → RSI = 8 days.
Why It Works : Shorter RSI reacts faster to volatile markets (like crypto).
2. MACD
- Default : 12, 26, 9.
- Calibrated :
- Fast EMA = ¼ of cycle.
- Slow EMA = ½ of cycle.
- Signal Line = ⅙ of cycle.
- Example : Cycle = 20 → Fast = 5, Slow = 10, Signal = 3.
Why It Works : Matches the asset's natural momentum shifts.
3. Williams %R
- Default : 14 days.
- Calibrated : Same as RSI (half the cycle).
---
How to Avoid Common Mistakes
Mistake 1 : Overfitting (Making It Too Perfect for the Past)
- Problem : If you calibrate too precisely to old data, it might fail in the future.
- Fix : Test on 2 types of data:
1. Training Data : First 70% of your chart (to calibrate).
2. Testing Data : Last 30% (to check if it still works).
Mistake 2 : Ignoring Market Changes
- Problem : What works today might not work next month.
- Fix : Recheck your settings every 3 months or after big news (e.g., Fed rate hikes).
---
Free Tools to Help (No Coding Needed)
1. TradingView's "Auto-Detect Cycle" Scripts
Search for indicators like "Cycle", "RSI Adaptive" or " Rainbow Adaptive RSI " in TradingView's public library. These automatically calculate cycle lengths (Not tested).
2. Adaptive MACD/RSI Indicators
Try pre-built adaptive indicators like:
- Adaptive MACD : Adjusts itself based on volatility.
- Dynamic Pivot : Uses pivots to set stop-loss and take-profit levels.
---
Building a Simple Pivot Calibration System
Basic ZigZag Calibrator Method :
1. Add ZigZag to your chart.
2. Manually count the bars between 5 recent swings.
3. Calculate the average → Divide by 2 → Use that number for your RSI/MACD.
Example :
- Swings: 12, 14, 16, 10, 8 bars → Average = 12.
- Calibrated RSI = 6 days.
---
Why This Works (Without the Math)
Markets move in waves. By matching your indicator's speed to the wave length, you "surf" the trend instead of fighting it. Research shows adaptive methods like this beat default settings.
The Science Behind It
When you calibrate to an instrument's natural rhythm:
- Oscillators (RSI, %R) catch extremes at the right time
- Trend indicators (MACD) signal changes faster
- Volatility bands (Bollinger Bands) expand and contract appropriately
---
A Step Further: Multi-Timeframe Calibration
For even better results, calibrate across timeframes:
1. Calculate cycles on daily charts for swing trading
2. Calculate cycles on 4-hour charts for day trading
3. Use both calibrated indicators together for confirmation
---
Final Tips for Beginners
1. Start Small : Calibrate one indicator (like RSI) first.
2. Use Free Tools : TradingView has thousands of free scripts to automate calculations.
3. Keep Records : Document what settings work for which assets.
4. Be Patient : Finding the right calibration takes time, but the results are worth it.
Calibration isn't about being perfect—it's about making your tools work better for specific markets . Happy trading!

Using The CRADLE Pattern To Time/Execute TradesThis simple video highlights one of my newest pattern definitions - the Cradle Pattern.
In addition to the many other patterns my technology identified, this Cradle Pattern seems to be a constant type of price construct.
I'm sharing it with all of you so you can learn how to identify it and use it for your trading.
Ideally, this pattern represents FLAGGING after a trend phase.
It is a consolidation of price within a flag after a broad trending phase.
It usually resolves in the direction of the major trend, but can present a very solid reversal trigger if the upper/lower pullback range is broken (see the examples in this video).
Learn it. Use it.
Price is the ultimate indicator.
Learn to read price data more efficiently to become a better trader.
Get some.
#trading #research #investing #tradingalgos #tradingsignals #cycles #fibonacci #elliotwave #modelingsystems #stocks #bitcoin #btcusd #cryptos #spy #gold #nq #investing #trading #spytrading #spymarket #tradingmarket #stockmarket #silver

Trend Changing Pattern (TCP) ExplainedIntroduction
One of the most important skills in forex trading is learning how to read price action and understand what the market is telling you. Price is not just numbers — it’s the collective perception of traders, making it the most reliable leading indicator available.
Today, I want to explain a powerful concept known as the Trend Changing Pattern (TCP) — a crucial tool for identifying potential market reversals and shifts in trend direction.
📈 What Is a Trend Changing Pattern?
In any trending market, whether it's an uptrend or downtrend, the trend won’t change easily. The strength of the trend and the timeframe you're trading on will determine how long it takes for a true reversal to occur.
One key signal of a trend change is a shift in momentum:
In an uptrend, when a momentum low forms during a pullback, it can be a sign that the trend is beginning to reverse.
In a downtrend, a momentum high during a pullback can signal a potential bullish reversal.
These are what we refer to as Trend Changing Patterns (TCPs) — moments where the structure of the market starts to shift.
⚠️ Watch for Manipulation After the TCP
After a TCP appears, it's common to see price manipulation before the new trend fully takes hold:
In an uptrend, price may return to manipulate the previous high before continuing down.
In a downtrend, price often dips to manipulate the previous low before reversing higher.
Being aware of this common liquidity grab helps traders avoid being trapped and instead position themselves in alignment with the new trend.
🧠 Final Thoughts
Understanding how to spot and interpret a Trend Changing Pattern gives you a major edge in forex trading. It helps you stay ahead of the market and make informed decisions based on price action, not emotion.
🎥 In the video, I go into more detail about momentum highs and lows, and how to recognize these key patterns in real time. Be sure to check it out if you want to sharpen your trend reversal strategy.
Wishing you success on your trading journey! 🚀

Ultimate Guide to Mastering Chart PatternsChart patterns are essential tools for traders looking to identify high-probability setups based on price action. Among the most reliable continuation and reversal patterns are triangles, wedges, and flags. These formations help traders anticipate market direction and make informed decisions based on breakout potential, trend strength, and volume confirmation.
In this guide, we’ll explore the key characteristics, trading strategies, and confirmation techniques for each of these patterns to improve trade execution and risk management.
Triangle Patterns
Types of Triangle Patterns
Triangles are consolidation patterns that indicate a period of indecision before price continues in the direction of the breakout. There are three main types of triangle patterns:
Ascending Triangle – A bullish continuation pattern where the price forms higher lows while resistance remains flat.
Descending Triangle – A bearish continuation pattern where the price forms lower highs while support remains flat.
Symmetrical Triangle – A neutral pattern where price forms lower highs and higher lows, squeezing into an apex before breaking out.
How to Trade Triangles
Identify the Triangle Formation: Look for at least two touchpoints on each trendline (support and resistance) to confirm the pattern.
Wait for Breakout Confirmation: The price should break above resistance (bullish) or below support (bearish) with strong volume.
Set Entry & Stop-Loss Levels: Enter the trade after a candle closes beyond the breakout point. Set a stop-loss below the most recent swing low (for bullish trades) or above the swing high (for bearish trades).
Measure Target Price: The expected move is typically equal to the height of the triangle measured from the widest part of the pattern.
Wedge Patterns
Types of Wedge Patterns
Wedges are similar to triangles but are characterized by sloping trendlines that converge in the same direction. They indicate a potential trend reversal or continuation depending on the breakout direction.
Rising Wedge – A bearish reversal pattern that forms during uptrends. The price makes higher highs and higher lows, but the slope narrows, signaling weakening momentum before a breakdown.
Falling Wedge – A bullish reversal pattern that forms during downtrends. The price makes lower highs and lower lows within a narrowing channel before a breakout to the upside.
How to Trade Wedges
Identify the Wedge Pattern: Look for a contracting price range within two sloping trendlines.
Watch for a Breakout: The price should break either above (for falling wedges) or below (for rising wedges) with increasing volume.
Confirm the Breakout: Use additional indicators such as RSI divergence or moving average crossovers to validate the move.
Set Entry, Stop-Loss, and Target: Enter after the breakout candle closes beyond the trendline, with a stop-loss outside the opposite side of the wedge. Target the height of the wedge projected from the breakout point.
Flag Patterns
Characteristics of Flag Patterns
Flag patterns are continuation patterns that occur after a strong impulsive move (flagpole), followed by a period of consolidation (flag) before price resumes the trend. Flags can be classified as:
Bullish Flag – Forms after a strong upward move, followed by a downward-sloping consolidation.
Bearish Flag – Forms after a strong downward move, followed by an upward-sloping consolidation.
How to Trade Flag Patterns
Identify the Flagpole: Look for a sharp price move in one direction, which forms the base of the flag.
Confirm the Flag Formation: Price consolidates within parallel trendlines that slightly slope against the prior trend.
Wait for the Breakout: Enter when price breaks out of the flag pattern in the direction of the previous trend with strong volume.
Measure Target Price: The price target is typically equal to the length of the flagpole projected from the breakout point.
Set Stop-Loss: Place the stop-loss below the lower boundary of the flag (for bullish flags) or above the upper boundary (for bearish flags).
Common Mistakes & How to Avoid Them
Trading Before Confirmation: Many traders enter too early without waiting for a breakout confirmation, leading to false signals.
Ignoring Volume: Breakouts should be accompanied by a volume surge for validation; weak volume can indicate a fake breakout.
Setting Tight Stop-Losses: Giving the trade enough room to breathe by placing stops outside key support/resistance levels prevents getting stopped out prematurely.
Forgetting to Manage Risk: Always follow proper risk-reward ratios (at least 1:2) to ensure profitable long-term trading.
Final Thoughts
Triangle, wedge, and flag patterns are powerful tools for traders who understand their structure and breakout behavior. By combining these patterns with volume analysis, trend confirmation indicators, and proper risk management, traders can increase their chances of success. Whether you're trading stocks, forex, or crypto, mastering these patterns will enhance your ability to navigate the markets efficiently.
__________________________________________
Thanks for your support!
If you found this guide helpful or learned something new, drop a like 👍 and leave a comment, I’d love to hear your thoughts! 🚀
Make sure to follow me for more price action insights, free indicators, and trading strategies. Let’s grow and trade smarter together! 📈

2 April Liberation Day: USA-Europe War Impact on ForexHi, I'm Forex Trader Andrea Russo and today I want to talk to you about an event that is shaking global markets: the tariff war between the United States and Europe.
Sunday, April 2, we started in force and new American news, celebrating "Liberation Day" by President Donald Trump. These data, which include 25% tariffs on your steel, aluminum and automobiles, look to rebalance the trade deficit of the United States. However, Europe is not ready to be saved. Ursula von der Leyen, president of the European Commission, has said that Europe has not started this matter, but is ready to defend its interests with a strong plan for control2.
The tension between the economic power has caused a significant impact on the market. The European stock exchange has not recorded consistent losses, with Milan having lost 16.4 million euros. Europe has responded with tariffs to its strategic American products, such as whiskey, motorcycles and legumes, and is evaluating further measures to protect its own industry4.
Forex Impact
This commercial war will bring about repercussions directly on the Forex market. Here's what to expect:
Removal of the American Dollar (USD): Protectionist tariffs tend to reforce the dollar, as they reduce the command of foreign currencies for imports. In addition, the increase in the price could lead the Federal Reserve to modify its own monetary policy, increasing interest rates.
Volatility of European Currencies: The euro (EUR) may rise in pressures due to economic uncertainties and European constraints. Also the value of the Swedish crown (SEK) may be negatively influenced.
Opportunity for the Trader: The volatility generated by these tensions offers opportunities for the Forex trader. Significant movements and exchange rates can be completed with trading strategies soon, but fundamentally adopt rigorous risk management.
Conclusion
The tariff war between the United States and Europe represents a significant loss for the global economy and the Forex market. Tomorrow will be a crucial day, and the trader will not carefully monitor the resources to adapt their own strategy. Always advise me to do my own analysis and operate with prudence.
Happy trading everyone!

What Is the Difference Between ETFs and Index Funds?What Is the Difference Between ETFs and Index Funds?
ETFs and index funds are designed to provide access to diversified portfolios of assets, often tracking the performance of a specific market index. But while they may appear similar at first glance, they have distinct characteristics that cater to different types of investors and strategies. This article breaks down the key differences between ETFs vs index funds, explores how they work, and explains why traders and investors might choose one over the other.
What Are ETFs?
Exchange-traded funds (ETFs) are investment vehicles that trade on stock exchanges, much like individual shares. They’re structured to replicate the performance of a particular benchmark, sector, commodity, or a combination of asset classes.
What sets ETFs apart is their flexibility. Traders and investors buy and sell ETFs throughout the trading day at market prices. This makes them particularly appealing to active traders who value liquidity and the ability to react quickly to price movements.
Another key advantage is their typically low cost. Most ETFs are passively managed, meaning they aim to replicate a benchmark rather than beat it. This reduces management fees, making ETFs a cost-effective choice compared to actively managed offerings.
ETFs also offer diversification in a single transaction. By trading one ETF, investors can gain exposure to hundreds or even thousands of underlying securities. This makes them a popular choice for spreading risk across multiple assets.
What Are Index Funds?
Index funds are investment vehicles designed to mirror the performance of a specific index, like the FTSE 100 or the S&P 500. An index fund provides broad exposure by holding a portfolio of assets that closely matches the composition of the benchmark it tracks. An index vehicle tracking the S&P 500 would invest in the 500 largest companies in the US, in the same proportions as the index. This passive strategy keeps costs low, as there’s no need for active management or frequent trading decisions.
So, how is an index fund different from an exchange-traded fund? The index fund can take the form of either an ETF or a mutual fund; for instance, the SPDR S&P 500 ETF, or SPY, is an index fund.
Mutual fund versions of index funds are traded at the end-of-day net asset value (NAV), while ETF versions are bought and sold throughout the trading day like individual shares. This distinction is important for traders considering factors like liquidity and pricing flexibility.
Low-cost index funds are popular for their relative simplicity compared to some other financial instruments, cost efficiency, and diversification. By investing in a single product, investors can gain exposure to an entire market, reducing the need for extensive research or active management.
Is an ETF an index fund? Not necessarily. An ETF can be an index fund if it tracks an index, but ETFs can also track different sectors, assets, or geographies without being one.
Differences Between ETFs and Index Funds
ETFs and index funds share a common purpose: to track the performance of an underlying benchmark. However, the debate of ETFs vs mutual funds vs index funds often comes down to trading mechanisms and investment strategies, which can influence their suitability for different types of traders and investors.
Trading Mechanism
One of the most noticeable differences between ETFs vs index funds is how they’re traded. ETFs trade on stock exchanges, allowing them to be bought and sold throughout the trading day at market prices. This means their value fluctuates based on demand, similar to individual shares. In contrast, mutual fund indices are priced and traded only once a day, at the net asset value (NAV) calculated after markets close.
Variety
ETFs encompass diverse assets like stocks, bonds, and commodities, covering sectors, regions, or mixed asset classes. Index funds, on the other hand, only track a specific market index, like the S&P 500, FTSE 100, or Nasdaq 100.
Cost Structure
Both ETFs and mutual fund indices are known for low fees, but there are nuances. ETFs typically have slightly lower expense ratios, as they incur fewer administrative costs. However, trading ETFs may involve brokerage fees or bid-ask spreads, which can add up for frequent traders. Mutual fund vehicles often require no trading fees but may impose a minimum investment amount.
Tax Efficiency
ETFs tend to be more tax-efficient than mutual fund indices. This is due to how they handle capital gains. ETFs generally use an “in-kind” redemption process, which minimises taxable events. Mutual fund index funds, on the other hand, may trigger taxable capital gains distributions, even if you haven’t sold your shares.
Liquidity and Accessibility
ETFs can be bought in small quantities, often for the price of a single share, making them more accessible to retail investors. Mutual fund vehicles may require higher minimum investments, which could limit access for some investors. Additionally, ETFs offer instant trade execution, while mutual vehicles require you to wait until the end of the trading day to complete transactions.
ETF CFD Trading
ETF CFD (Contract for Difference) trading is a versatile way to speculate on the price movements of ETFs without actually owning the underlying assets. When trading ETF CFDs, you’re entering into an agreement with a broker to exchange the price difference of an ETF between the time the position is opened and closed. Unlike traditional ETF investing, where you purchase shares on an exchange, CFD trading allows you to take positions on price movements—whether upwards or downwards.
Leverage and Lower Capital Requirements
One major advantage of ETF CFD trading is leverage. With CFDs, you only need to put down a fraction of the trade’s total value as margin, allowing you to control larger positions with less capital. However, leverage amplifies both potential gains and losses, so careful risk management is essential.
Potential Short-Term Opportunities
ETF CFDs add a layer of flexibility for traders exploring the difference between ETFs, mutual funds, and index funds by focusing on short-term speculation rather than long-term holding. Traders can react quickly to news, economic events, or trends without the constraints of traditional ETF investing, such as settlement times or the need to meet minimum investment requirements. Since ETF CFDs can be traded with intraday precision, they allow traders to capitalise on smaller price movements.
A Complement to Long-Term Investing
For those who already invest in traditional ETFs or indices, ETF CFD trading can serve as a complementary strategy. While long-term investments focus on gradual wealth-building, CFDs enable active traders to seize potential short-term opportunities, hedge against risks, or diversify their trading activities.
Flexibility Across Markets
With ETF CFDs, traders gain access to a wide range of markets, from equity indices to commodities and sectors. This diversity allows for tailored trading strategies that align with market conditions or specific interests, such as tech or energy ETFs.
Uses for ETFs and Index Funds
The differences between index funds and ETFs mean they play distinct but complementary roles in financial markets, offering tools for various investment and trading strategies. Whether focusing on long-term goals or seeking potential short-term opportunities, these products provide flexibility and diversification.
Portfolio Diversification
Both are popular for spreading risk across a broad range of assets. For example, instead of buying shares in individual companies, a single investment in an ETF tracking the S&P 500 provides exposure to hundreds of large US firms. This diversification may help reduce the impact of poor performance of any single asset.
Cost-Effective Market Exposure
Both types offer relatively low-cost access to markets. Passive management strategies mean lower fees compared to actively managed products, making them efficient choices for building portfolios or gaining exposure to specific sectors, regions, or asset classes.
Tactical Market Moves
ETFs, with their intraday trading capability, are particularly suited to tactical adjustments. For instance, a trader looking to quickly increase exposure to the tech sector might buy a technology-focused ETF, while potentially reducing risk by selling it as conditions change.
Long-Term Wealth Building
Index funds, particularly in their mutual fund format, are designed for patient investors. By tracking broad indices with minimal turnover, they offer a way to potentially accumulate wealth over time, making them popular instruments for retirement savings or other long-term objectives.
How to Choose Between Index Funds vs ETFs
Choosing between an index fund vs ETF depends on your trading style, investment goals, and how you plan to engage with the markets. While both offer relatively cost-effective access to diverse portfolios, your choice will hinge on a few key factors.
- Trading Flexibility: ETFs are popular among active traders looking for potential intraday opportunities. Their ability to trade throughout the day allows for precision and quick responses to market changes. Index funds, whether ETFs or mutual products, are usually chosen by long-term investors who are less concerned about daily price movements.
- Fees and Costs: While both options are low-cost, ETFs often have slightly lower expense ratios but may incur trading fees or bid-ask spreads. Mutual fund products typically skip trading fees but may have higher management costs or minimum investment requirements.
- Tax Considerations: ETFs often provide better tax efficiency due to their structure, particularly when compared to mutual fund indices. For investors concerned about capital gains distributions, this could be a deciding factor.
- Strategy: If you’re targeting specific themes, sectors, or commodities, ETFs that aren’t tied to an index can provide unique exposure. For broad, passive market tracking, index funds—whether ETFs or mutual funds—offer simplicity and consistency.
The Bottom Line
ETFs and index funds are powerful instruments for traders and investors, each with unique strengths suited to different strategies. Whether you’re focused on long-term growth or short-term price moves, understanding their differences is key. For those looking to trade ETFs with flexibility, ETF CFDs offer a dynamic option. Open an FXOpen account today to access a range of ETF CFDs and start exploring potential trading opportunities with competitive costs and four advanced trading platforms.
FAQ
What Is an Index Fund?
An index fund is an investment vehicle designed to replicate the performance of a specific market index, such as the S&P 500 or FTSE 100. It achieves this by holding the same securities as the index in similar proportions. These vehicles can be either mutual funds or ETFs, offering investors broad market exposure and low costs through passive management.
What Is the Difference Between an ETF and an Index Fund?
An ETF trades like a stock on an exchange throughout the day, with prices fluctuating based on market demand. They track various assets across different sectors, markets, and asset classes. Index funds track indices, like the S&P 500 or FTSE 100, and can be traded as an ETF or mutual fund.
What Is Better, an S&P 500 ETF or Mutual Fund?
The choice depends on your needs. ETFs offer intraday trading, lower fees, and no minimum investment, making them popular among those who look for flexibility. Mutual funds often waive trading costs and are chosen by long-term investors comfortable with end-of-day pricing.
Are ETFs as Safe as Index Funds?
ETFs and index funds carry similar risks since both track market performance. So-called safety depends on the underlying assets, overall conditions, and your investment strategy, not the type itself.
What Is the Difference Between a Mutual Fund and an Index Fund?
A mutual fund is a broad investment vehicle managed actively or passively, while an index fund is a type of mutual fund or ETF specifically designed to replicate an index.
What Are Index Funds vs Equity Funds?
Index funds are designed to track the performance of an index. Equity funds, on the other hand, focus on stocks and can be actively or passively managed. While all index funds are equity funds, not all equity funds track indices.
This article represents the opinion of the Companies operating under the FXOpen brand only. It is not to be construed as an offer, solicitation, or recommendation with respect to products and services provided by the Companies operating under the FXOpen brand, nor is it to be considered financial advice.

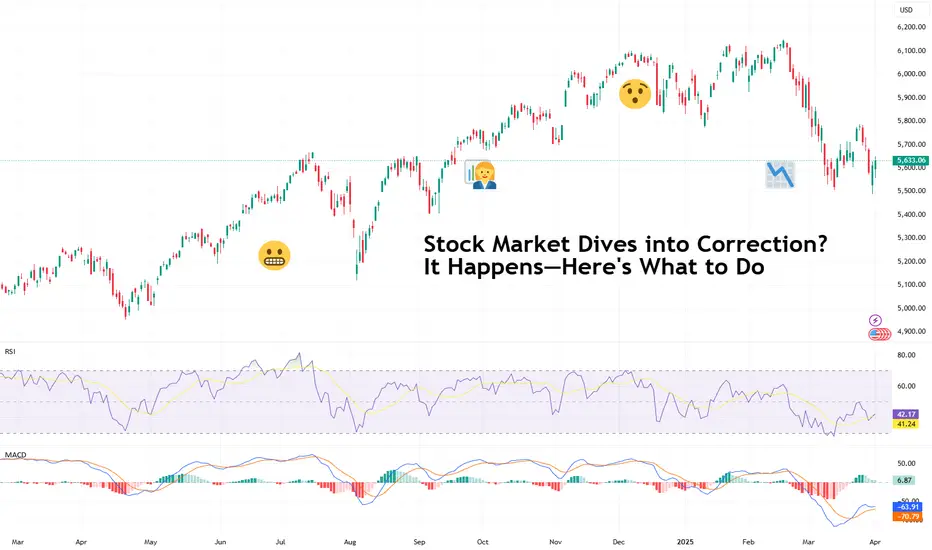
Stock Market Dives into Correction? It Happens—Here's What to DoYou wake up, check your portfolio, and see a sea of red. The market’s down, your stocks are taking a nosedive, and CNBC is running apocalyptic headlines about an impending crash. Sounds familiar?
It’s maybe because we’re in (or super close to) a correction right now — the S&P 500 SP:SPX was down 10% from its record high two weeks ago and a lot of people are unsure what to do.
The truth of the matter is, stock market corrections are routine—not as often as the meeting that should’ve been an email, but also not as rare as a winning trade in the Japanese yen ( widow maker is real, yo ).
And, most importantly, they’re usually not as catastrophic as they feel in the moment.
So, before you hit the panic button (or worse, start revenge trading to “win it all back”), let’s talk about what’s shaking the market right now and how to navigate corrections like a pro.
🤔 First Things First: What’s a Correction?
A stock market correction is a drop of 10% or more from a recent high. It’s not a crash, it’s not the end of capitalism, and it’s definitely not a sign that you should liquidate your entire portfolio and move to a remote cabin in the woods.
Corrections happen regularly, typically once every year or two. They’re a natural part of market cycles, shaking out excessive speculation and resetting valuations to more reasonable levels.
For the record, a drop of 20% is considered a bear market.
🤝 Why the Market’s Getting Jittery
Markets don’t move in straight lines, and sometimes they hit turbulence. Lately, two big themes have been dominating headlines:
Trump’s Hard-Line Tariffs Hit Hard (And Markets Are Nervous About It)
If there’s anything Trump knows how to do is say things online or on-site and move markets. And his hostile and straight up combatant approach to handling international relations has sent traders scrambling to offload risk.
With hiked tariffs on China, Europe, and Mexico and Canada, businesses are bracing for severe supply chain disruptions, higher costs, and tighter margins. When tariffs go up, corporate earnings tend to go down—and the market doesn’t like that math.
Inflation Just Won’t Quit
The Federal Reserve spent most of the last two years trying to tame inflation, and just when it seemed like things were cooling off, it’s creeping back up. The latest readout of the personal consumption expenditures (PCE) report showed prices ticked up more than expected at 2.8% in February.
Higher inflation means the Fed might keep interest rates elevated for longer than expected, making borrowing more expensive and slowing down growth. Every new inflation release has investors guessing: Will the Fed cut rates, hold steady, or—worst case—hike again?
Between trade wars and stubborn inflation, uncertainty is running high, and that dynamics breeds volatility. But a correction doesn’t mean the market is broken—it just means sentiment has shifted.
⚠️ How NOT to React (aka: Rookie Mistakes to Avoid)
When corrections hit, bad decision-making is at an all-time high. Here’s what not to do:
Panic selling – Selling at the bottom is a classic rookie move. If you weren’t planning to sell at the highs, why dump everything when it’s down?
Trying to time the exact bottom – Good luck. Nobody, not even Warren Buffett, can catch the bottom (not that he’s trying). If you’re waiting for the “perfect” dip, you’ll likely miss the rebound.
Going all-in on one asset – Thinking of putting everything into one stock or crypto because it’s “cheap” now? Please don’t. Diversification exists for a reason .
Getting glued to financial news – Watching every market update during a correction is like doom-scrolling Google after a mild headache—you’ll only freak yourself out more.
Now that we’ve covered what not to do, let’s focus on the smart plays.
💪 So, What Should You Do?
If you want to come out of a correction with your sanity (and portfolio) intact, here’s your game plan:
1️⃣ Zoom Out—Corrections Are Temporary
The market moves in cycles, and corrections are just part of the game. Historically, corrections last a few months, while bull markets last years. If you’re investing for the long term, a correction is a blip on the chart, not an extinction event.
2️⃣ Review Your Portfolio Like a Hedge Fund Manager
Corrections are a great excuse to audit your holdings. Ask yourself:
Is this stock/ETF/index still worth holding?
Has anything fundamentally changed, or is this just temporary market noise?
Do I have too much exposure to one sector?
Think of it as spring cleaning for your investments. It's also an opportunity to make some good use of the handy Stock Screener or Stock Heatmap to spot the best (and worst) performers. If something was a FOMO buy and doesn’t belong in your portfolio, consider trimming it.
3️⃣ Buy Selectively, Not Blindly
Corrections create opportunities, but that doesn’t mean you should just throw money at every stock that’s down. Some companies deserve their declines ( looking at you, Nikola )—others are just collateral damage in a broader selloff.
Look for quality companies with strong earnings, manageable debt, and real growth potential. If they were solid before the correction, they’ll likely recover faster than the overhyped names.
Example: Remember when Amazon stock NASDAQ:AMZN tanked 90% in 2000, the dot-com bubble? No, because you were too busy being 2 years old instead of loading up on Jeff Bezos’s dream. And look where the guy’s now.
4️⃣ Do Some Good Old DCA
Instead of dumping all your cash into the market at once, use dollar-cost averaging (DCA). Buying in small increments at regular intervals helps you avoid the stress of trying to time the bottom. If prices drop further, you can buy more at an even better price.
5️⃣ Keep Emotions in Check
Corrections test your patience and discipline. The best investors don’t let fear dictate their strategy. If you’re getting emotional about your trades, step away from the screen and take a breath. The market will be there when you come back.
👍 The Market Always Bounces Back—Eventually
Every correction feels like the worst one while it’s happening. But let’s look at history:
The S&P 500 has faced 30+ corrections since 1950. It survived them all.
The average correction lasts four months before a recovery begins.
After a correction, markets typically rally higher within a year.
Unless you believe the global economy is permanently broken (hint: not yet, at least), every major downturn has eventually turned into a new bull run.
🦸♂ Final Thought: Be the Hero, Not the Victim
Market corrections separate the professionals from the wannabes. The people who panic and sell at the bottom? They usually regret it. The ones who keep a level head, stick to their strategy, and take advantage of good opportunities? They come out stronger.
And finally, if you need to take away one thing it’s this: Corrections aren’t the enemy. They’re the price of admission for long-term gains.
👉 Let’s hear it from you!
How do you handle corrections, what’s your strategy when the market is in a downturn and what’s in your portfolio then? Share your experience in the comment section!
Starting over in trading- A short guideThe internet has made it easier than ever to learn trading for free. You have access to blogs, videos, books, podcasts, and more. Yet, most traders still fail.
Why?
Because there’s too much information. It’s overwhelming, confusing, and filled with conflicting advice.
So, if I had to start over from scratch, here’s exactly how I’d do it—step by step.
________________________________________
Step 1: Master Risk Management
No matter what type of trader you become—day trader, swing trader, options trader, quantitative trader, etc.—risk management is the foundation of long-term success.
It’s also one of the easiest things to master, and once you do, it will pay off for the rest of your trading career.
Risk Management Essentials:
✅ Never risk more than 1-2% of your account per trade.
✅ Always use stop losses to protect your capital.
✅ Focus on risk-to-reward ratios (aim for at least 1:2 or better).
✅ Manage position sizing properly to avoid blowing up your account.
Once you understand how to protect your capital, it’s time to expose yourself to the trading world.
________________________________________
Step 2: Learn & Explore Different Trading Styles
When you're just starting, you don’t know what you don’t know.
Your goal at this stage is to explore different trading strategies, tools, and methods.
What to Learn:
🔹 Candlestick patterns & price action
🔹 Indicators (moving averages, RSI , MACD , etc.)
🔹 Chart patterns (head & shoulders, triangles, etc.)
🔹 Market structures (support/resistance, trends, ranges)
🔹 Different trading styles (day trading, swing trading, scalping, momentum trading, etc.)
Mindset for This Phase:
🚀 Keep an open mind—don’t judge strategies too early.
🚀 Focus on learning rather than making money right away.
🚀 Accept that not everything will work for you—and that’s okay.
At this stage, your goal is not to become an expert in everything but to discover what resonates with you.
________________________________________
Step 3: Pick ONE Strategy & Go Deep
After exploring different strategies, you need to commit to ONE.
This eliminates information overload and allows you to focus on mastering a single trading method.
How to Choose a Strategy:
🔹 Does it fit your personality? (e.g., If you hate fast decision-making, avoid scalping.)
🔹 Does it match your lifestyle? (e.g., If you have a full-time job, swing trading might be better than day trading.)
🔹 Can you understand the logic behind it? (A good strategy should be simple, not overly complicated.)
Example: Mean Reversion Strategy in Stocks
• Identify stocks in an uptrend 📈
• Wait for a pullback (price moves lower)
• Enter when the stock shows signs of resuming the trend
• Sell on the next rally
By focusing on one strategy, you eliminate confusion and make faster progress.
________________________________________
Step 4: Create & Refine Your Trading Plan
Now that you have a strategy, it’s time to turn it into a structured trading plan.
Your trading plan should include:
✅ Market Conditions – When will you trade? Trending or ranging markets?
✅ Entry Rules – What signals will you use to enter a trade?
✅ Exit Rules – When will you take profits or cut losses?
✅ Risk Management – How much will you risk per trade?
💡 Example Trading Plan (Momentum Trading):
• Market: Trade only in strong uptrends.
• Entry: Buy when the price breaks above a key resistance level.
• Exit: Take profit at 2x risk, cut losses at a 1x risk.
• Risk Management: Risk only 1% of the account per trade.
A clear, structured plan removes emotion from trading and keeps you disciplined.
________________________________________
Step 5: Test Your Strategy (Before Risking Real Money)
You never know if a strategy works until you test it.
How to Test a Trading Strategy:
🔹 Backtesting – Analyze past data to see if the strategy has worked historically.
🔹 Forward Testing (Paper Trading) – Trade in a demo account without real money.
What You’ll Learn from Testing:
✔️ Does the strategy make money over time?
✔️ How often does it win vs. lose?
✔️ How big are the drawdowns?
✔️ Does it match your risk tolerance?
If the strategy performs well in testing, you now have a solid foundation to trade with real money.
If it doesn’t work, tweak and improve it—this is part of the process.
________________________________________
Final Thoughts: The Key to Long-Term Success
Starting over isn’t about finding the “perfect” system —it’s about following a structured approach.
Here’s the Path to Trading Success:
1️⃣ Master Risk Management – Protect your capital first.
2️⃣ Learn & Explore – Understand different strategies & tools.
3️⃣ Pick ONE Strategy – Focus on a proven method.
4️⃣ Create a Trading Plan – Define your rules clearly.
5️⃣ Test & Improve – Validate your strategy before going live.
🔥 Bonus Tip: Trading success is 80% psychology and 20% strategy. Stay patient, disciplined, and treat trading like a business—not a get-rich-quick scheme.

A Closer Look at Bitcoin's Elliot Wave PatternHello friends, today we'll attempt to analyze the Bitcoin chart using Elliot Waves. Our approach will involve using Elliot Wave theory and structures, which involve multiple possibilities. The analysis we present here focuses on one potential scenario that seems possible to us.
Please note that this information is for educational purposes only and should not be considered trading advice or investment tips. There's a risk of being completely wrong, so never trade based solely on this post. We're not responsible for any profits or losses. Individuals should consult a financial advisor before making any trading or investment decisions.
Now, let's discuss the Bitcoin chart. On the daily chart, we can see that a black primary degree wave has completed its ((4th)) wave, and the ((5th)) wave has started. Within the fifth wave, an intermediate degree wave is unfolding, which will have its own set of waves (1), (2), (3), (4), (5). The primary black degree wave five will be complete once the intermediate degree wave is finished.
We've drawn accounts on the chart, illustrating the entire structure, including the nearest invalidation level at around $76,666 and the real invalidation level below $50,000.
I hope this analysis based on Elliot Wave theory has helped you understand the chart better and learn something new. Please keep in mind that this is for educational purposes only.
I am not Sebi registered analyst.
My studies are for educational purpose only.
Please Consult your financial advisor before trading or investing.
I am not responsible for any kinds of your profits and your losses.
Most investors treat trading as a hobby because they have a full-time job doing something else.
However, If you treat trading like a business, it will pay you like a business.
If you treat like a hobby, hobbies don't pay, they cost you...!
Hope this post is helpful to community
Thanks
RK💕
Disclaimer and Risk Warning.
The analysis and discussion provided on in.tradingview.com is intended for educational purposes only and should not be relied upon for trading decisions. RK_Charts is not an investment adviser and the information provided here should not be taken as professional investment advice. Before buying or selling any investments, securities, or precious metals, it is recommended that you conduct your own due diligence. RK_Charts does not share in your profits and will not take responsibility for any losses you may incur. So Please Consult your financial advisor before trading or investing.

Supertrend by MarsThis is the explanation of supertrend I wish I had seen ages ago. Great trading tool, but with caveats.

Primer: Solana - A Blazing BlockchainCME Group’s newly launched Solana futures enable institutional grade access to the cryptocurrency, offering investors access to compelling relative value opportunities.
This paper provides a background to Solana in relation to other major blockchain networks and cryptocurrencies. Mint Finance will outline the execution of crypto market spread trades using CME futures in an upcoming paper.
Solana is a high-performance public blockchain launched in 2020 by Solana Labs, founded by Anatoly Yakovenko (a former Qualcomm engineer). Yakovenko first proposed Solana’s novel Proof of History (PoH) concept in 2017 as a solution to blockchain scalability. He assembled a founding team including former Qualcomm colleague Greg Fitzgerald and others and named the project after a California beach town.
Backed by early venture funding, Solana’s mainnet launched in March 2020. The vision was to enable ultra-fast, low-cost transactions for decentralized applications (e.g. DeFi, gaming), addressing limitations of Bitcoin & Ethereum in speed and fees.
Solana has grown rapidly to become one of the most used networks and amassed a market cap of USD 64 billion, making it one of the largest digital assets. What is behind the massive surge? Is it due to flip ETH as the home of DeFi?
How Does Solana’s Blockchain Rank?
While Solana’s low fees and fast transaction speeds have driven high trading volume, transaction count, and wallet growth, it still trails ETH in Total Value Locked (TVL). To achieve its high transaction throughput, Solana has made certain compromises on decentralization.
In terms of ecosystem development, Solana is seeing rapid growth. The Electric Capital 2024 developer report found Solana attracted the most new developers in 2024 – more than any other ecosystem (even Ethereum’s, despite Ethereum’s broader base).
Solana now has ~2,500 monthly active developers, second only to Ethereum’s ~8,900 (which includes many working on Layer-2s). This loyal & expanding developer base has been a key factor behind Solana’s explosive growth.
DEX Surge and Meme Coin Mania
Solana’s early growth was driven by NFTs, supported by low fees and a loyal community that made it a hub for NFT trading. These factors continued to attract users even after the NFT boom subsided. Its fast, low-cost blockchain and strong developer base have enabled the launch of many user-friendly and popular applications. More recently, Solana’s growth has been fuelled by surging decentralized exchange (DEX) volumes and a wave of meme coin minting.
By November 2024, meme coin trading accounted for an all-time high 65% of monthly DEX volume on Solana’s largest DEX, Raydium. Raydium even overtook Uniswap in monthly volume that month.
Solana’s advantages in cost and speed have been pivotal in this trend. Transaction fees on Solana are negligible and on-par with L2 chains. This cost advantage makes minting and trading low-value tokens (like meme coins) economically feasible on Solana but prohibitively expensive on Ethereum layer-1. Similarly, Solana’s block times (~0.4 seconds) and high throughput enable rapid trading. Traders can execute many rapid swaps on Solana DEXs without the delays and slippage that Ethereum’s ~12-second blocks and occasional congestion introduce. Solana’s speed and low fees thus attracted a flood of retail speculators for meme coins and high-frequency trading strategies.
Ethereum’s ecosystem still offers deeper liquidity and broader dApp selection, but Solana capitalized on specific niches (e.g. meme coins, real-time trading) where Ethereum’s costs are a barrier.
However, this explosive growth was not without turbulence. In early 2025, a “meme coin meltdown” saw activity cooling off after several scam tokens collapsed. By February 2025, Solana’s share of total on-chain DEX volume, which had topped 51% in January, retreated to 24% as some froth cleared.
Data Source: Artemis
Scandals like a fake “Libra” token (which vaporized $4.4B in market cap) and a Trump-themed token rug pull dented retail sentiment. Even so, Solana’s DEX volumes remain on par with Ethereum’s entire ecosystem (L1 + L2), a remarkable feat. VanEck’s Feb 2025 report noted that despite an 80%+ drop in new meme token launches since January, Solana DEX activity “is still holding its own – roughly matching the entire ETH ecosystem”.
In short, the meme coin mania has demonstrated Solana’s capacity to manage massive retail-driven bursts of activities that might overwhelm other chains.
Market Metrics For BTC, ETH, and SOL
Since the bottom of the bear market following the FTX collapse. Solana has delivered a stunning recovery, far outperforming both BTC and ETH, but the massive gains were partly explained by the much sharper decline following FTX.
During 2024, SOL performance moved in lockstep with BTC with both assets delivering stunning returns. However, the performance diverged sharply after Jan/2025, coinciding with the collapse in DEX trading volume. The sharp correction since has erased most of the 2024 gains while BTC has remained resilient.
Solana has, nevertheless, managed to outperform ETH which has suffered an even deeper correction over the past few months.
Data Source: TradingView
Historical volatility for all three assets shows a similar trend but differ in magnitude. SOL has the highest volatility while ETH follows second and BTC is least volatile. During spikes, the differences become exaggerated, but during lows, the values can reach similar lows.
For traders, higher volatility can be both an opportunity and a risk.
While SOL’s performance is positively correlated with both ETH and BTC, this correlation breaks frequently (more commonly with ETH) and these periods of divergence present compelling spread opportunities.
The trend for implied volatility (IV) is like HV with SOL’s IV the highest and Bitcoin’s IV the lowest. Recently, IV has started to edge up again following a decline through March.
Trading Solana and Crypto Spreads
With the launch of CME’s Solana and Micro Solana futures, investors can express views on Solana’s growth and take tactical positions that benefit from relative outperformance. Mint Finance will outline the execution of crypto market spread trades using CME futures in an upcoming paper.
CME Solana futures provide exposure to 500 SOL per futures contract and reference the CME CF Solana-Dollar Reference Rate.
CME Micro Solana futures offer a smaller notional value to create more balanced spreads and for fine-tuning exposure. The micro contract provides exposure to 25 SOL.
Additional details about the contract including margins, calendars, and specifications are available on the CME Solana product page .
MARKET DATA
CME Real-time Market Data helps identify trading set-ups and express market views better. If you have futures in your trading portfolio, you can check out on CME Group data plans available that suit your trading needs tradingview.com/cme .
DISCLAIMER
This case study is for educational purposes only and does not constitute investment recommendations or advice. Nor are they used to promote any specific products, or services.
Trading or investment ideas cited here are for illustration only, as an integral part of a case study to demonstrate the fundamental concepts in risk management or trading under the market scenarios being discussed. Please read the FULL DISCLAIMER the link to which is provided in our profile description.

What Is an Inverse Fair Value Gap (IFVG) Concept in Trading?What Is an Inverse Fair Value Gap (IFVG) Concept in Trading?
Inverse Fair Value Gaps (IFVGs) are a fascinating concept for traders seeking to refine their understanding of price behaviour. By identifying areas where market sentiment shifts, IFVGs provide unique insights into potential reversals and key price levels. In this article, we’ll explore what IFVGs are, how they differ from Fair Value Gaps, and how traders can integrate them into their strategies for more comprehensive market analysis.
What Is a Fair Value Gap (FVG)?
A Fair Value Gap (FVG) occurs when the market moves so rapidly in one direction that it leaves an imbalance in price action. This imbalance shows up on a chart as a gap between three consecutive candles: the wick of the first candle and the wick of the third candle fail to overlap, leaving a “gap” created by the second candle. It essentially highlights an area where buying or selling pressure was so dominant that the market didn’t trade efficiently.
Traders view these gaps as areas of potential interest because markets often revisit these levels to "fill" the imbalance. For example, in a bullish FVG, the gap reflects aggressive buying that outpaced selling, potentially creating a future support zone. On the other hand, bearish FVGs indicate overwhelming selling pressure, which might act as resistance later.
FVGs are closely tied to the concept of fair value. The gap suggests the market may have deviated from a balanced state, making it an area traders watch for signs of price rebalancing. Recognising and understanding these gaps can provide insights into where the price might gravitate in the future, helping traders assess key zones of interest for analysis.
Understanding Inverse Fair Value Gaps (IFVGs)
An Inverse Fair Value Gap (IFVG), or Inversion Fair Value Gap, is an Inner Circle Trader (ICT) concept that builds on the idea of an FVG. While an FVG represents a price imbalance caused by strong directional movement, an IFVG emerges when an existing FVG is invalidated. This invalidation shifts the role of the gap, turning a bearish FVG into a bullish IFVG, or vice versa.
Here’s how it works: a bearish FVG, for instance, forms when selling pressure dominates, leaving a gap that might act as resistance. However, if the market breaks through this gap—either with a wick or a candle close—it signals that the sellers in that zone have been overwhelmed. The bearish FVG is now invalidated and becomes a bullish IFVG, marking a potential area of support instead. The same applies in reverse for bullish FVGs becoming bearish IFVGs.
Traders use inverted Fair Value Gaps to identify zones where market sentiment has shifted significantly. For example, when the price revisits a bullish IFVG, it may serve as a zone of interest for traders analysing potential buying opportunities. However, if the price moves past the bottom of the IFVG zone, it’s no longer valid and is typically disregarded.
What makes these reverse FVGs particularly useful is their ability to highlight moments of structural change in the market. They can act as indicators of strength, revealing areas where price has transitioned from weakness to strength (or vice versa). By integrating IFVG analysis into their broader trading framework, traders can gain deeper insights into the evolving dynamics of supply and demand.
Want to test your IFVG identification skills? Get started on FXOpen and TradingView.
How Traders Use IFVGs in Trading
By integrating IFVGs into their strategy, traders can refine their decision-making process and uncover potential setups aligned with their broader market outlook. Here’s how IFVGs are commonly used:
Identifying Key Zones of Interest
Traders begin by spotting FVGs on price charts—areas where rapid movements create imbalances. An inversion FVG forms when such a gap is invalidated; for instance, a bearish FVG becomes bullish if the price breaks above it. These zones are then marked as potential areas of interest, indicating where the market may experience significant activity.
Contextualising Market Sentiment
The formation of an IFVG signals a shift in market sentiment. When a bearish FVG is invalidated and turns into a bullish IFVG, it suggests that selling pressure has diminished and buying interest is gaining momentum. Traders interpret this as a potential reversal point, providing context for the current market dynamics.
Analysing Price Reactions
Once an IFVG is identified, traders monitor how the price interacts with this zone. If the price revisits a bullish IFVG and shows signs of support—such as slowing down its decline or forming bullish candlestick patterns—it may indicate a strengthening upward movement. Conversely, if the price breaches the IFVG without hesitation, the anticipated reversal might not materialise.
How Can You Trade IFVGs?
IFVGs provide traders with a structured way to identify and analyse price levels where sentiment has shifted. The process typically looks like this:
1. Establishing Market Bias
Traders typically start by analysing the broader market direction. This often involves looking at higher timeframes, such as the daily or 4-hour charts, to identify trends or reversals. Tools like Breaks of Structure (BOS) or Changes of Character (CHoCH) within the ICT framework help clarify whether the market is leaning bullish or bearish.
Indicators, such as moving averages or momentum oscillators, can also provide additional context for confirming directional bias. A strong bias ensures the trader is aligning setups with the dominant market flow.
2. Identifying and Using IFVGs
Once a Fair Value Gap (FVG) is invalidated—indicating a significant shift in sentiment—it transforms into an Inverse Fair Value Gap (IFVG). Traders mark the IFVG zone as a key area of interest. If it aligns with their broader market bias, this zone can serve as a potential entry point. For instance, in a bearish bias, traders may focus on bearish IFVGs that act as potential resistance zones.
3. Placing Orders and Risk Management
Traders often set a limit order at the IFVG boundary, anticipating a retracement and for the area to hold. A stop loss is typically placed just beyond the IFVG or a nearby swing high/low to manage risk. For exits, targets might include a predefined risk/reward ratio, such as 1:3, or a significant technical level like an order block or support/resistance area. This approach ensures trades remain structured and grounded in analysis.
Advantages and Disadvantages of IFVGs
IFVGs offer traders a unique lens through which to analyse price movements, but like any tool, they come with both strengths and limitations. Understanding these can help traders incorporate IFVGs into their strategies.
Advantages
- Highlight market sentiment shifts: IFVGs pinpoint areas where sentiment has reversed, helping traders identify key turning points.
- Refined entry zones: They provide precise areas for potential analysis, reducing guesswork and offering clear levels to watch.
- Flexibility across markets: IFVGs can be applied to any market, including forex, commodities, or indices, making them versatile.
- Complementary to other tools: They pair well with other ICT tools like BOS, CHoCH, and order blocks for enhanced analysis.
Disadvantages
- Subject to interpretation: Identifying and confirming IFVGs can vary between traders, leading to inconsistencies.
- Limited standalone reliability: IFVGs need to be used alongside broader market analysis; relying solely on them increases risk.
- Higher timeframe dependence: Their effectiveness can diminish on lower timeframes, where noise often obscures true sentiment shifts.
- Potential for invalidation: While IFVGs signal potential opportunities, they aren’t guarantees; price can break through, rendering them ineffective.
The Bottom Line
Inverse Fair Value Gaps provide traders with a structured approach to identifying market shifts and analysing key price levels. By integrating IFVGs into a broader strategy, traders can uncover valuable insights and potentially refine their decision-making. Ready to apply IFVG trading in real markets? Open an FXOpen account today and explore potential trading opportunities across more than 700 markets, alongside four advanced trading platforms and competitive conditions.
FAQ
What Is an Inverse Fair Value Gap (IFVG)?
The IFVG meaning refers to a formation that occurs when a Fair Value Gap (FVG) is invalidated. For example, a bearish FVG becomes bullish after the price breaks above it, creating a potential support zone. Similarly, a bullish FVG can transform into a bearish IFVG if the price breaks below it, creating a potential resistance zone. IFVGs highlight shifts in market sentiment, providing traders with areas of interest for analysing possible reversals or continuation zones.
What Is the Difference Between a Fair Value Gap and an Inverse Fair Value Gap?
A Fair Value Gap (FVG) is an imbalance caused by aggressive buying or selling, creating a price gap that may act as support or resistance. An Inverse Fair Value Gap (IFVG) occurs when the original FVG is invalidated—indicating a shift in sentiment—and its role flips. For instance, a bearish FVG invalidated by a price breakout becomes a bullish IFVG.
What Is the Difference Between BPR and Inverse FVG?
A Balanced Price Range (BPR) represents the overlap of two opposing Fair Value Gaps (FVGs), creating a sensitive zone for potential price reactions. In contrast, an Inverse Fair Value Gap (IFVG) is a concept based on a single FVG that has been invalidated, flipping its role. While both are useful, BPR reflects the equilibrium between buyers and sellers, whereas IFVG highlights sentiment reversal.
This article represents the opinion of the Companies operating under the FXOpen brand only. It is not to be construed as an offer, solicitation, or recommendation with respect to products and services provided by the Companies operating under the FXOpen brand, nor is it to be considered financial advice.

Behind the Curtain: Macro Indicators That Move the Yen1. Introduction
Japanese Yen Futures (6J), traded on the CME, offer traders a window into one of the world’s most strategically important currencies. The yen is not just Japan’s currency—it’s also a barometer for global risk appetite, a funding vehicle for the carry trade, and a defensive asset when markets turn volatile.
But what truly moves Yen Futures?
While many traders fixate on central bank statements and geopolitical news, machine learning tells us that economic indicators quietly—but consistently—steer price action. In this article, we apply a Random Forest Regressor to reveal the top macroeconomic indicators driving 6J Futures across daily, weekly, and monthly timeframes, helping traders of all styles align their strategies with the deeper economic current.
2. Understanding Yen Futures Contracts
Whether you’re trading institutional size or operating with a retail account, CME Group offers flexible exposure to the Japanese yen through two contracts:
o Standard Japanese Yen Futures (6J):
Contract Size: ¥12,500,000
Tick Size: 0.0000005 = $6.25 per tick
Use Case: Institutional hedging, macro speculation, rate differential trading
o Micro JPY/USD Futures (MJY):
Contract Size: ¥1,250,000
Tick Size: 0.000001 = $1.25 per tick
Use Case: Retail-sized access, position scaling, strategy testing
o Margin Requirements:
6J: Approx. $3,300 per contract
MJY: Approx. $330 per contract
Both products offer deep liquidity and near 24-hour access. Traders use them to express views on interest rate divergence, U.S.-Japan trade dynamics, and global macro shifts—all while adjusting risk through contract size.
3. Daily Timeframe: Top Macro Catalysts
Short-term movements in Yen Futures are heavily influenced by U.S. economic data and its impact on yield spreads and capital flow. Machine learning analysis ranks the following three as the most influential for daily returns:
10-Year Treasury Yield: The most sensitive indicator for the yen. Rising U.S. yields widen the U.S.-Japan rate gap, strengthening the dollar and weakening the yen. Drops in yields could create sharp yen rallies.
U.S. Trade Balance: A narrowing trade deficit can support the USD via improved capital flow outlook, pressuring the yen. A wider deficit may signal weakening demand for USD, providing potential support for yen futures.
Durable Goods Orders: A proxy for economic confidence and future investment. Strong orders suggest economic resilience, which tends to benefit the dollar. Weak numbers may point to a slowdown, prompting defensive yen buying.
4. Weekly Timeframe: Intermediate-Term Indicators
Swing traders and macro tacticians often ride trends formed by mid-cycle economic shifts. On a weekly basis, these indicators matter most:
Fed Funds Rate: As the foundation of U.S. interest rates, this policy tool steers the entire FX complex. Hawkish surprises can pressure yen futures; dovish turns could strengthen the yen as yield differentials narrow.
10-Year Treasury Yield (again): While impactful daily, the weekly trend gives traders a clearer view of long-term investor positioning and bond market sentiment. Sustained moves signal deeper macro shifts.
ISM Manufacturing Employment: This labor-market-linked metric reflects production demand. A drop often precedes softening economic growth, which may boost the yen as traders reduce exposure to riskier assets.
5. Monthly Timeframe: Structural Macro Forces
For position traders and macro investors, longer-term flows into the Japanese yen are shaped by broader inflationary trends, liquidity shifts, and housing demand. Machine learning surfaced the following as top monthly influences on Yen Futures:
PPI: Processed Foods and Feeds: A unique upstream inflation gauge. Rising producer prices—especially in essentials like food—can increase expectations for tightening, influencing global yield differentials. For the yen, which thrives when inflation is low, surging PPI may drive USD demand and weaken the yen.
M2 Money Supply: Reflects monetary liquidity. A sharp increase in M2 may spark inflation fears, sending interest rates—and the dollar—higher, pressuring the yen. Conversely, slower M2 growth can support the yen as global liquidity tightens.
Housing Starts: Serves as a growth thermometer. Robust housing data suggests strong domestic demand in the U.S., favoring the dollar over the yen. Weakness in this sector may support yen strength as traders rotate defensively.
6. Trade Style Alignment with Macro Data
Each indicator resonates differently depending on the trading style and timeframe:
Day Traders: React to real-time changes in 10-Year Yields, Durable Goods Orders, and Trade Balance. These traders seek to capitalize on intraday volatility around economic releases that impact yield spreads and risk appetite.
Swing Traders: Position around Fed Funds Rate changes, weekly shifts in Treasury yields, or deteriorating labor signals such as ISM Employment. Weekly data can establish trends that last multiple sessions, making it ideal for this style.
Position Traders: Monitor PPI, M2, and Housing Starts for broader macro shifts. These traders align their exposure with long-term shifts in capital flow and inflation expectations, often holding positions for weeks or more.
Whatever the style, syncing your trading plan with the data release calendar and macro backdrop can improve timing and conviction.
7. Risk Management
The Japanese yen is a globally respected safe-haven currency, and its volatility often spikes during geopolitical stress or liquidity events. Risk must be managed proactively, especially in leveraged futures products.
8. Conclusion
Japanese Yen Futures are a favorite among global macro traders because they reflect interest rate divergence, risk sentiment, and global liquidity flows. While headlines grab attention, data tells the real story.
Stay tuned for the next installment of the "Behind the Curtain" series, where we continue uncovering what really moves the futures markets.
When charting futures, the data provided could be delayed. Traders working with the ticker symbols discussed in this idea may prefer to use CME Group real-time data plan on TradingView: www.tradingview.com - This consideration is particularly important for shorter-term traders, whereas it may be less critical for those focused on longer-term trading strategies.
General Disclaimer:
The trade ideas presented herein are solely for illustrative purposes forming a part of a case study intended to demonstrate key principles in risk management within the context of the specific market scenarios discussed. These ideas are not to be interpreted as investment recommendations or financial advice. They do not endorse or promote any specific trading strategies, financial products, or services. The information provided is based on data believed to be reliable; however, its accuracy or completeness cannot be guaranteed. Trading in financial markets involves risks, including the potential loss of principal. Each individual should conduct their own research and consult with professional financial advisors before making any investment decisions. The author or publisher of this content bears no responsibility for any actions taken based on the information provided or for any resultant financial or other losses.

Diamond Pattern Trading: How to Spot and TradeSome patterns scream for attention, while others sneak up on traders who aren’t looking closely. The diamond pattern is one of those sneaky ones — a formation that hints at a brewing reversal but requires a sharp eye to catch.
Let’s dive into this pattern, how it forms, and the best strategies for effectively trading diamond top and bottom patterns.
What Is a Diamond Pattern?
The diamond pattern is a reversal chart pattern that occurs after a strong trend, indicating a potential shift in market direction. It forms when price action expands and then contracts, creating a diamond-shaped contour. This pattern is rare compared to triangles or head-and-shoulders formations, but it often signals significant price moves when it appears.
There Are Two Types of Diamond Patterns:
Diamond Top Pattern – A 🐻 Reversal Pattern That Appears After an Uptrend.
Diamond Bottom Pattern – A 🐂 Reversal Pattern That Forms After a Downtrend.
These patterns can help traders identify potential turning points and prepare for a change in trend.
How Can You Identify a Diamond Pattern in Trading?
To spot a diamond pattern trading setup, look for the following characteristics:
Broadening Formation: The price action initially expands, creating higher highs and lower lows.
Narrowing Structure: After the expansion, the price contracts, creating lower highs and higher lows.
Symmetrical Shape: When trendlines are drawn connecting the highs and lows, they create a diamond shape.
Breakout Point: The pattern is confirmed when the price breaks out of the structure, either to the upside or downside.
While it might resemble a diamond quilt pattern or a diamond tile pattern on the chart, the key difference is its role as a market reversal signal.
Diamond Top Pattern: Bearish Reversal
A diamond top pattern forms at the peak of an uptrend and signals that bullish momentum is weakening. Traders often look for a downside breakout to confirm the reversal.
What Does a Diamond Top Pattern Typically Involve?
Identify the diamond formation after a strong uptrend.
Wait for a breakout below the lower trendline with increased volume.
Enter a short position once the breakout is confirmed.
Set a stop-loss above the recent high.
Target price: Measure the height of the pattern and project it downward.
This pattern suggests buyers are losing control, and a downtrend will likely follow.
📊 Diamond Top in Action
Between late 2024 and early 2025, Bitcoin surged toward $105,000. Following this uptrend, price action began to shift: the candles first spread wider, then started to tighten — ultimately forming what resembled a diamond top on the daily chart.
The pattern formed over several weeks, showing the hallmark structure: broad on the left,
symmetrical tightening on the right, with support and resistance lines converging.
Shortly after the narrowing phase was completed, Bitcoin broke downward — a typical outcome of a diamond top pattern. The price declined sharply over several days, validating the pattern and suggesting a broader correction.
Analysts watching the pattern noted that while it wasn’t perfectly symmetrical (as real-world patterns rarely are), the structure was clear enough to support the reversal thesis. The breakout marked a momentum shift as bullish pressure faded and sellers gained temporary control.
Following the initial drop, Bitcoin stabilized and began consolidating. This sideways movement is common after strong breakouts — reflecting indecision and market recalibration.
Diamond Bottom Pattern: Bullish Reversal
A diamond bottom pattern appears at the end of a downtrend, indicating a potential shift to bullish momentum.
How a Diamond Bottom Pattern Is Typically Interpreted
Identify the diamond shape forming after a downtrend.
Wait for an upside breakout above the upper trendline with substantial volume.
Enter a long position once the breakout is confirmed.
Set a stop-loss below the recent low.
Target price: Measure the pattern’s height and project it upward.
This pattern signals that selling pressure decreases, and buyers may take control.
Why the Diamond Pattern Is Important for Traders
Reliable Reversal Signal. The diamond pattern trading setup strongly indicates trend reversals.
Clear Entry and Exit Points. Well-defined breakout levels make risk management easier.
Works in Different Markets. The diamond pattern remains effective when trading stocks, forex, or crypto.
Final Thoughts
The diamond pattern is a rare but powerful tool that can help traders confidently spot trend reversals. Whether you’re trading a diamond top pattern for bearish setups or a diamond bottom pattern for bullish breakouts, understanding this formation can give you an edge in the market.
So, traders, have you spotted a diamond pattern trading setup recently? Share your experiences and strategies in the comments!
This analysis is performed on historical data, does not relate to current market conditions, is for educational purposes only, and is not a trading recommendation.

How to Choose the Right Leverage in Trading: What Metters?One of the most common questions I get from beginner traders is: What leverage should I use ?
And every time, my answer is the same: The leverage offered by the broker is irrelevant. What truly matters is the position size you control in the market.
Understanding Leverage in Trading
Leverage is a tool that allows you to control a larger amount of money in the market than you actually have in your account. Brokers regulated in the U.S., EU, or Australia limit leverage to 1:30, but in other jurisdictions, these restrictions do not apply, and brokers may offer leverage of 1:200 or even higher.
What does this mean? Let’s take a concrete example:
• You have an account with $1,000.
• Your broker offers 1:200 leverage.
• This means you can control $200,000 in the market.
Although this may sound tempting, you must understand that your profit and loss are calculated based on the amount controlled, not your initial capital.
The Real Risk of High Leverage
Let’s assume you open a position using the full leverage available and control $200,000 in the market.
• If the market moves 100 pips against you, your loss is $2,000.
• Your $1,000 account is completely wiped out in just 50 pips of adverse movement.
In other words, high leverage can quickly take you out of the game if you do not manage your risk properly.
How to Trade Safely
If you have an account of $1,000, it is recommended to control much smaller amounts in the market to reduce risk.
A safer approach would be:
• To control $5,000, meaning you open a position of 0.05 lots.
• If you have a higher risk appetite, a maximum of 0.1 lots, which means you control $10,000 in the market.
This way, a 100-pip movement against you will not completely wipe out your account, giving you a better chance to manage risk and learn from experience.
Conclusion
The leverage offered by the broker does not matter; what matters is the position size you open. Set an appropriate risk level for your account and do not be tempted by high leverage offered by brokers. Survival in trading depends on proper risk management, not on how big you can bet on each trade.

Smart Money Technique (SMT) Divergences - The Ultimate GuideIntroduction
SMT Divergences are a powerful concept used by professional traders to spot inefficiencies in the market. By comparing correlated assets, traders can identify hidden opportunities where one market shows strength while the other shows weakness. This guide will break down the major SMT divergences: EURUSD/GBPUSD, US100/US500, and XAUUSD/XAGUSD .
---
What is SMT Divergence?
SMT Divergence occurs when two correlated assets do not move in sync, signaling potential liquidity grabs or market inefficiencies. These divergences can be used to confirm trend reversals, identify smart money movements, and improve trade precision.
Key Concepts:
- If one asset makes a higher high while the correlated asset fails to do so, this suggests potential weakness in the pair making the higher high.
- If one asset makes a lower low while the correlated asset does not, this suggests potential strength in the pair that did not make a lower low.
- Smart Money often exploits these inefficiencies to engineer liquidity hunts before moving price in the intended direction.
---
EURUSD vs. GBPUSD SMT Divergence
These two forex pairs are highly correlated because both share the USD as the quote currency. However, when divergence occurs, it often signals liquidity manipulations.
How to Use:
- If GBPUSD makes a higher high but EURUSD does not, GBPUSD may be trapping breakout traders before reversing.
- If EURUSD makes a lower low but GBPUSD does not, EURUSD might be in a liquidity grab, signaling a potential reversal.
---
US100 vs. US500 SMT Divergence
The NASDAQ (US100) and S&P 500 (US500) are both major indices with a strong correlation, but tech-heavy NASDAQ can sometimes lead or lag the S&P.
How to Use:
- If US100 makes a higher high but US500 does not, it suggests US100 is extended and may reverse soon.
- If US500 makes a lower low but US100 does not, US500 might be experiencing a liquidity grab before a reversal.
---
XAUUSD vs. XAGUSD SMT Divergence
Gold (XAUUSD) and Silver (XAGUSD) have a historic correlation. However, due to differences in volatility and liquidity, they can diverge, presenting trading opportunities.
How to Use:
- If Gold makes a higher high but Silver does not, Gold might be overextended and ready to reverse.
- If Silver makes a lower low but Gold does not, Silver might be in a liquidity grab, signaling strength.
---
Indicator Used for SMT Divergences
To simplify the process of identifying SMT divergences, this guide utilizes the TradingView indicator TehThomas ICT SMT Divergences . This tool automatically detects divergences between correlated assets, highlighting potential trade opportunities.
You can access the indicator here:
Why Use This Indicator?
- Automatically plots divergences, saving time on manual comparisons.
- Works across multiple asset classes (Forex, Indices, Metals, etc.).
- Helps traders spot Smart Money inefficiencies with ease.
---
Final Tips for Trading SMT Divergences
1. Use Higher Timeframes for Confirmation: SMT Divergences on 1H or 4H hold more weight than those on lower timeframes.
2. Combine with Other Confluences: ICT concepts like Order Blocks, FVGs, or liquidity sweeps can strengthen the SMT setup.
3. Wait for Market Structure Confirmation: After spotting SMT divergence, look for a market structure shift before entering trades.
4. Be Mindful of Economic Events: Divergences can appear due to news releases, so always check the economic calendar.
---
Conclusion
SMT Divergences are a valuable tool for traders looking to gain an edge in the markets. By analyzing inefficiencies between correlated assets, traders can anticipate smart money movements and improve trade precision. Practice spotting these divergences on real charts, and soon, you'll develop a keen eye for hidden liquidity traps.
Happy trading!
