Europe - America War, Impact on Forex
Hello, my name is Andrea Russo and today I want to talk to you about an important issue that is shaking up the international market: the trade war between the European Union and the United States. Recently, the European Union responded to the duties imposed by the United States on steel and aluminum with countermeasures worth 26 billion euros. In response, US President Donald Trump threatened to impose 200% duties on all wines, champagnes and spirits from France and other countries represented by the EU2.
This escalation of trade tensions will certainly have a significant impact on the FOREX market. Let's see together what the consequences could be:
Market Volatility: Trade tensions between two of the world's largest economies will increase the volatility of the FOREX market. Investors will seek safe havens, such as the Swiss Franc (CHF) and the Japanese Yen (JPY), increasing the demand for these currencies.
Euro (EUR) depreciation: The euro could come under downward pressure due to concerns about the economic impact of tariffs on key EU sectors, such as wine. The reduction in exports of wine and other alcoholic products could negatively impact the EU's trade balance.
US dollar (USD) appreciation: The dollar could strengthen further, as investors view the US as a safe haven in times of economic uncertainty. However, the increase in tariffs could also lead to higher inflation in the US, complicating the Federal Reserve's decisions regarding interest rates.
Impact on the currencies of wine exporting countries: The currencies of major European wine exporters, such as the euro (EUR) and the Swedish krona (SEK), could come under downward pressure due to the decrease in exports to the US.
In conclusion, the tariff war between the European Union and the US will have a significant impact on the FOREX market. Investors will need to monitor developments closely and adjust their trading strategies accordingly. Stay tuned for more updates and market analysis!
Happy trading to all!
Community ideas
Learn To Invest: Global Liquidity Index & BitcoinGlobal Liquidity Index & BitCoin:
🚀 Positive Vibes for Your Financial Journey! 🚀
BITSTAMP:BTCUSD
Look at this chart! It's the Global Liquidity Index , a measure of how much extra money is flowing through the world's financial systems.
Why is this important? Because when this index is high, it often means good things for investments like #Bitcoin! 📈
Think of it like this: when there's more money flowing, people are often more willing to take risks and invest in things like Bitcoin.
See those "BullRun" boxes? That means things are looking bright! It's showing that money is flowing, and that's often a good sign for potential Bitcoin growth. 🌟
Even if you're not a pro, it's easy to see the good news here. Understanding these trends can help you make smarter decisions.
Let's all aim for growth and success! 💪

O kurwa! Curvature in Technical Analysis: What Does It Tell Us?Curvature in TA is trading approach where curved lines are used instead of traditional straight trendlines. Curved lines help to visualize how trends evolve and can provide insights into potential reversals or trend continuations.
One of the known methods that utilize curvature is the MIDAS (Market Interpretation/Data Analysis System). This system was developed by physicist Paul Levine in 1995 and uses curved support and resistance lines based on Volume-Weighted Average Price (VWAP). The curves adapt dynamically as price and volume change, helping to identify trend shifts and potential reversals.
💡 Why should we use Curvature?
Dynamic Support and Resistance: Curved lines adapt to price changes, unlike static horizontal lines.
Reversal Signals: They can signal potential trend shifts earlier than traditional methods.
Better Trend Visualization: They are particularly useful for parabolic or exponential price movements.
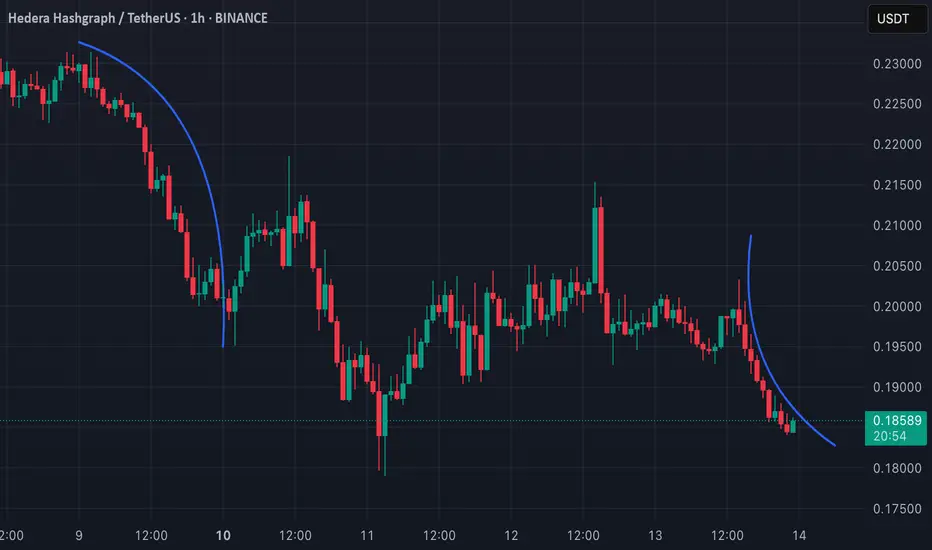
📊 Applying Curvature to HBAR (1H TF)
There are two curves on my chart. Both of them shows a curvature pattern forming on the 1-hour timeframe.
L: The curve on left side indicates a strong downward move, and the price appears to be following this curve closely.
R: On the other hand I have drawn curve on the right side, which is alligned as downward curve as well, but it has different angle.
This post is meant to test my theory on real life example.
🔑 Key Points:
Breaks away from the curvature could indicate a potential trend reversal or consolidation.
Combining this analysis with volume and momentum indicators can improve accuracy when predicting possible bounce or breakdown scenarios. Let's see how it works!
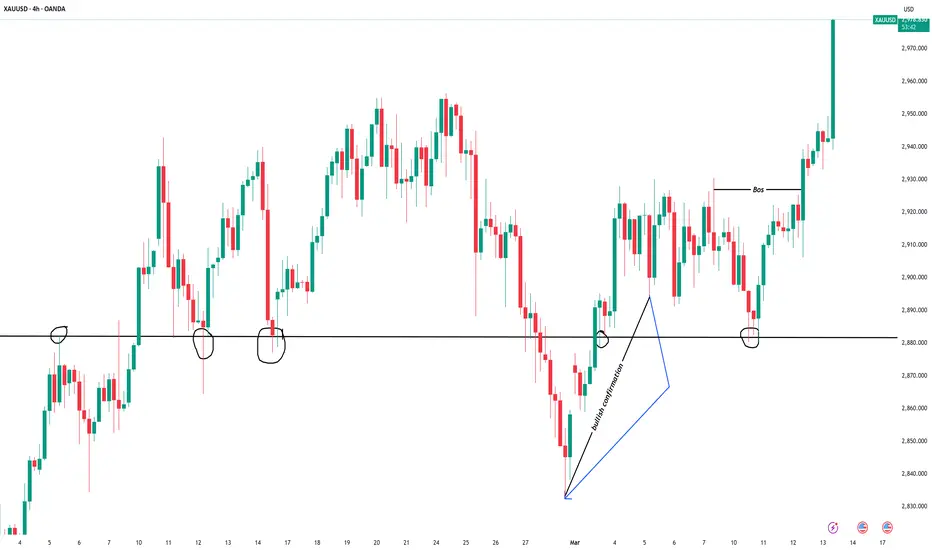
MARKET TREND/STRUCTURE USING XAUUSDTRADEWITHKENNY
EDUCATIVE : The trendline drawn above highlights the bullish confirmation on the 4-hour timeframe at the 2,890 support level , following a fake breakout . The 2,880 level acted as a key support zone and was retested multiple times , as shown on the chart before continuing the trend .
It’s always advisable to perform a top-down analysis , starting from the weekly timeframe down to the hourly and minute timeframes , to refine entries at key levels for better trade execution.
Disclaimer : This is my personal view and should not be considered financial advice.
Quarterly Theory "QT"
Introduction to Quarterly Theory (QT)
Time must be divided into quarters for a proper interpretation of market cycles.
Combining QT (Quarterly Theory) concepts with basic ICT concepts leads to greater accuracy.
Understanding QT allows you to be flexible. It adapts to any trading style as it is universal across all time frames.
QT eliminates ambiguity by providing specific time-based reference points to look for when entering trades
.
THE CYCLE
Annual Cycle - 3 quarters each
Monthly Cycle - 1 week each
Weekly Cycle - 1 day each*
Daily Cycle - 6 hours each
Session Cycle - 90 minutes each
*Monday to Thursday, Friday has its own specific function .
Annual Cycle:
Q1 JANUARY - MARCH
Q2 APRIL - JUNE
Q3 JULY - SEPTEMBER
Q4 OCT - DECEMBER
Monthly Cycle**:
Q1 FIRST WEEK
Q2 SECOND WEEK
Q3 THIRD WEEK
Q4 FOURTH WEEK
Weekly Cycle*:
Q1 MONDAY
Q2 TUESDAY
Q3 WEDNESDAY
Q4 THURSDAY
Daily Cycle:
Q1 ASIA
Q2 LONDON
Q3 NEW YORK
Q4 AFTERNOON
**Monthly Cycle starts with the first full week of the month.
*Friday has its own cycle, which is why it is not listed.
Q1 indicates the quarters that follow.
If Q1 expands, Q2 is likely to consolidate.
If Q1 consolidates, Q2 is likely to expand.
TRUE OPENS
True price opens are the beginning of Q2 in each cycle. It validates key levels.
What are the true opens?
Yearly: First Monday of April (Q2)
Monthly: Second Monday of the month (Q2)
Weekly: Second daily candle of the week
Daily: Start of the London session (6 hours after the open of the daily candle)
Asia - London - NY - Evening: 90 minutes after the open of the 6-hour candle.
DIAGRAM:
Q1 (A) Accumulation - Consolidation.
Q2 (M) Manipulation - Judas Swing (Trade this).
Q3 (D) Distribution (Trade this).
Q4 (X) Continuation - Reversal of the previous quarter.
Q1 (X) Continuation - Reversal of the previous quarter.
Q2 (A) Accumulation - Consolidation.
Q3 (M) Manipulation - Judas Swing (Trade this).
Q4 (D) Distribution (Trade this).
ANNUAL CYCLE:
MONTHLY CYCLE:
WEEKLY CYCLE:
DAILY CYCLE:

UNDERSTANDING CHART/CANDLESTICK PATTERNSTRADEWITHKENNY
EDUCATIVE : The circled hammer candlestick on the chart confirms strong buying pressure on XAUUSD . As shown, the market broke through the key resistance level at 2,923.22 , continuing its upward movement.
I’ll be watching for buy opportunities on a retest of the previous key level at 2,923 . However, if the price breaks below this zone, it could move lower toward the key levels where the hammer candlestick initially formed.
KEY LEVELS : 2,923.22 , 2,911.85 , 2,906.77
CONCLUSION : Understanding chart patterns and market structure is crucial for trading success. Learning the market requires consistency, regardless of the losses you may encounter along the way.
Disclamer : This is my personal view and should not be considered financial advice.

How to manage your money in a way to get out of a bull traplet's say for example you bought 50 shares of BITX (bitcoin 2X bullish) on March 07, at Pivot for $45.50, and now you along with a lot of other longs are trapped.
Each time the market rallies other bulls get out at a loss on every rally. Causing another downturn.. trapping you further.
IF Your strategy is like mine so you won't close the trade in a loss, but you are wasting valuable time.
Also suppose you have 30 or 40% of your overall portfolio that is reserved for shorting.
When you take profits on the shorts, instead of saving the money for yor next short, you buy 50 more shares at the current market price of 37.
Now you can get out halfway to your original target, at $41 by selling both, at the same time. you made money on your long, enough to eliminate the loss if you sold the first lot below your original target.
In this example you can sell at $41, which is a lot easier to reach than $45 which might take another week. To determine the level you an get out simply add the two prices and divide by 2.

Breaking the Trading Matrix: Lessons from The Matrix MovieThe Matrix is more than just a movie—it’s a mind-expanding experience that continues to offer new insights, no matter how many times you watch it. Beyond its philosophical depth and action-packed sequences, the film carries powerful lessons that can be applied to trading.
Just like in The Matrix, financial markets blur the line between reality and illusion. Success in trading requires a shift in perception, a willingness to embrace harsh truths, and the ability to decode the underlying structure of the market.
Let’s break down the key trading lessons inspired by The Matrix.
🕶️ Building Confidence: The Neo Path
Remember Neo’s journey? He started as Thomas Anderson—doubtful and uncertain—before transforming into the confident savior of humanity. This mirrors a trader’s evolution:
• You start hesitant and unsure.
• Greed and ego take over.
• The market humbles you with losses.
• You develop an edge, learning from experience.
• Over time, confidence and resilience grow.
Like Neo, every trader faces setbacks. But every setback is a setup for a comeback. Persistence and adaptation are key.
🏃♂️ Confirmation Bias: Dodging the Bullet
One of the most iconic scenes in The Matrix is Neo dodging bullets, bending reality to his advantage. Traders must do the same by reshaping their biases.
If you only seek confirmation for your trades, you’ll ignore critical counter-signals. To avoid this trap:
✅ Develop a trading system based on logic, not emotion.
✅ Seek diverse viewpoints instead of reinforcing your bias.
✅ Accept that the market moves on probabilities, not personal beliefs.
Dodge the confirmation bias bullet, and you’ll become a more objective and adaptable trader.
🔴 Take the Red Pill: Embrace Reality
In The Matrix, the red pill symbolizes awakening to the truth. In trading, taking the red pill means accepting the realities of the market:
❌ Traders who take the blue pill:
• Chase high win rates.
• Refuse to accept losses.
• Gamble with oversized positions.
✅ Traders who take the red pill:
• Accept risk as part of the game.
• Prepare for inevitable losses.
• Understand that past performance does not guarantee future results.
Those who ignore market realities are doomed to fail. Take the red pill and see the market for what it truly is.
🥄 There Is No Spoon: The Power of Perspective
In the famous "There is no spoon" scene, Neo learns that reality is shaped by perception. The same applies to trading:
• The market isn’t your enemy—your perception of it is.
• Stop trying to “bend” the market to your will.
• Instead, bend your mind to adapt to market conditions.
Traders who develop flexibility thrive, while those who resist change break.
🔢 Understand the Code – Understand the Matrix
Neo eventually sees the code behind The Matrix. Similarly, traders must understand the market’s underlying structure:
📊 Price Action
📈 Volume
📉 Probabilities
Markets move up, down, and sideways. Your job is to recognize patterns and decode them. The more you understand the code, the more clarity you gain in your trades.
👨💼 Agent Smith and Market Manipulators
Just as Agent Smith was a virus in The Matrix, market manipulators exist to exploit uninformed traders. Beware of:
🚨 Extreme volatility
📉 Unusual price gaps
❌ Pump-and-dump schemes
Stay vigilant and avoid manipulated markets that can drain your capital.
🏋️ Training Simulation: Practice Makes Perfect
Before Neo fought in the real world, he trained in simulated battles. Traders should do the same before risking real money:
✅ Backtest strategies to refine your edge.
✅ Use demo accounts to practice execution.
✅ Paper trade to gain confidence before going live.
Mistakes in training are free. Mistakes in live trading cost money. Train smartly.
🕶️ Morpheus’s Faith: Belief in Yourself
Morpheus believed in Neo before Neo believed in himself. Traders must also develop unwavering self-belief:
✔️ Trust your analysis.
✔️ Stick to your system.
✔️ Make decisions with confidence.
Doubt and hesitation lead to poor execution. Confidence, backed by preparation, leads to success.
🏛️ The Architect’s Plan: Strategy is Key
The Architect had a plan for The Matrix—every possible outcome was accounted for. Traders need the same level of structure:
📝 Develop a clear trading strategy.
🎯 Stick to your plan, even when emotions flare up.
⚖️ Adjust when necessary, but never trade impulsively.
Without a plan, you’re just another gambler in the market.
🧘 Free Your Mind: Emotional Control
Neo’s final test was to free his mind. In trading, emotional control is the ultimate skill:
✅ Backtest your system to understand market behavior.
✅ Risk less until you're comfortable with losses.
✅ Trade small before increasing position sizes.
Your worst enemies in trading?
❌ Ego
❌ Fear
❌ Greed
Master them, or the market will master you.
🔥 Final Words: The Path to Financial Awakening
Trading, like The Matrix, is a journey of self-discovery, discipline, and adaptation. If you want to break free from the illusion of quick riches and truly understand the market, you must:
📌 Develop confidence and resilience.
📌 Avoid confirmation bias and seek objective perspectives.
📌 Accept the harsh realities of trading.
📌 Adapt to market conditions instead of resisting them.
📌 Learn to read price action, volume, and probabilities.
📌 Stay vigilant against market manipulation.
📌 Practice before going live.
📌 Believe in yourself and your system.
📌 Have a structured plan and execute with discipline.
📌 Master your emotions to make rational decisions.
The real question is: Are you ready to free your mind and take control of your trading destiny?

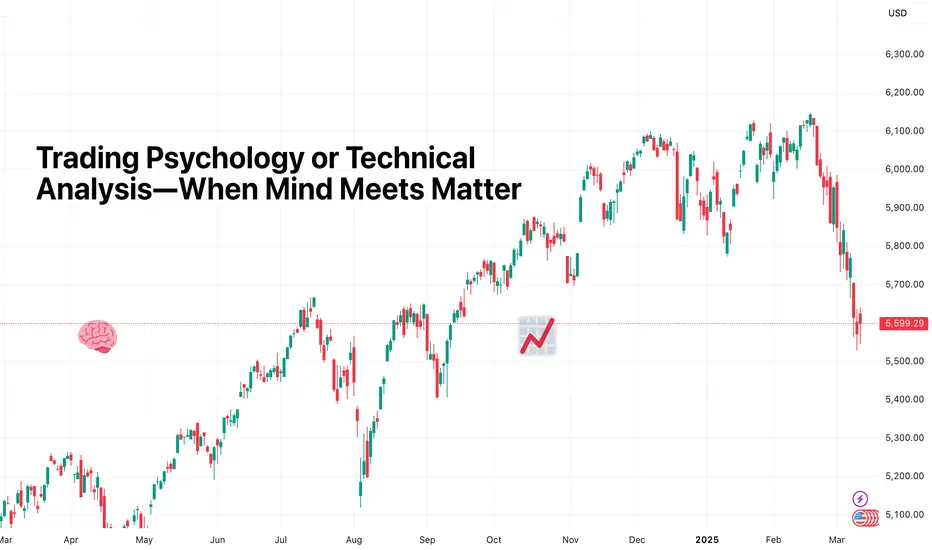
Trading Psychology or Technical Analysis—When Mind Meets MatterThere’s an age-old battle in trading that makes the bull vs. bear debate look like a game of pickleball (no offense, finance bros). It’s the clash between the traders who swear by their charts and the ones who insist it’s all about mindset.
The technicals versus the psychologicals. Fibonacci retracements versus fear and greed. RSI versus your racing heart.
TLDR? Both matter—a lot. But knowing when to trust your indicators, when to trust yourself, and when to blend both is the fine line that separates those who thrive from those who rage-quit.
⚔️ The Cold, Hard Numbers vs. the Soft, Messy Brain
Think of technical analysis as your sometimes inaccurate GPS in trading. It’s structured, predictable, and gives you clear entry and exit points—until it doesn’t. Because markets, much like a GPS in a tunnel, don’t always cooperate.
That’s where psychology creeps in. Your mind is the ultimate trading algorithm, but it’s often running outdated software. Fear of missing out? That’s just your brain throwing a tantrum. Revenge trading? A glitch in emotional processing. Overconfidence after three wins in a row? Well done, you genius.
Technical analysis gives you signals, but trading psychology determines how you act on them.
🤷♂️ When the Chart Says One Thing, and Your Brain Says Another
Picture this: You’ve mapped out the perfect setup. The moving averages align, volume confirms the breakout, and everything screams BUY .
But then your brain whispers, What if it reverses? What if this is a trap? What if I’m about to donate my account balance to the market gods?
You hesitate. The price moves without you. Now, frustration kicks in, and suddenly, you’re clicking BUY at the worst possible moment—just in time for a pullback.
Sometimes, the best trade is the one you don’t take. And sometimes, trusting the chart over your overthinking brain is the only way forward.
🔥 The Big Guys and Their Choices
Legendary investors have picked their sides in this debate. Howard Marks, the co-founder of Oaktree Capital, has long been a big believer in market psychology. He argues that understanding investor sentiment is more valuable than any chart pattern because markets are driven by cycles of greed and fear.
On the other hand, Paul Tudor Jones—one of the greatest traders of all time—leans on technicals, famously saying, “The whole trick in investing is: ‘How do I keep from losing everything?’ If you use the 200-day moving average rule, you get out. You play defense.”
Both approaches work. The question is: Are you the type who deciphers market mood swings, or do you trust that a well-placed moving average will tell you when to cut and run?
🌀 Overtrading: The Technical Trap and the Psychological Spiral
Overtrading usually starts with a good trade, a small win, and a rush of dopamine that convinces you you’ve cracked the code. So, you take another trade. Then another. And before you know it, you’re firing off entries like a caffeinated gamer, except your PnL is the one taking the damage.
Technical traders fall into this trap because they see too many setups. Every candlestick pattern, every little bounce, every “potential” breakout becomes a reason to trade.
Psychological traders, on the other hand, may overtrade out of boredom, frustration, or the need to “make back” losses.
The result? An emotional rollercoaster that ends with an account balance you don’t want to check the next morning.
The fix? Trade selectively. The best setups don’t come every five minutes, and forcing trades is like forcing a bad joke—it just doesn’t land.
💪 Fear, Greed, and the Art of Holding Your Ground
Every trader knows the feeling: You’re in profit, but instead of letting the trade play out, you close early because profit is profit, right?
Wrong.
Fear of losing profits is what keeps traders from maximizing their wins. And greed—the evil twin of fear—is what makes traders hold losing trades, hoping for a miracle. It’s the classic “let winners run, cut losers short” rule in reverse.
Technical traders know where their stops and targets are. The problem? They often ignore them when emotions take over. Psychological traders “feel” the market but get crushed when that gut feeling betrays them.
The best traders find the balance—using technicals to set logical targets and psychology to actually stick to the plan.
🤝 The Solution? A System That Checks Both Boxes
So, what’s the verdict? Do you put matter over mind or mind over matter?
The truth is, great traders do both. They develop strategies based on technicals but manage execution with discipline. They respect risk management rules not just because the chart says so, but because they know how destructive emotions can be.
Here’s what the best do differently:
✅ They journal trades —not just the setups but how they felt during the trade.
✅ They stick to a trading plan so they can trust their system over impulse.
✅ They set rules that help them to properly bounce back from losses .
✅ They know the value of knowledge and never stop learning. (We’ve got you covered here, too. Go check the Top Trading Books if you’re a trader and stop by the Top Books on Investing if you’re an investor).
💚 Final Thoughts: Mind and Market in Harmony
In the end, trading is never just one or the other. It’s not pure math, and it’s not pure mindset. It’s a dance between structure and instinct, strategy and psychology. The ones who get it right aren’t just great at reading charts—they’re great at reading themselves.
Fair Value Gaps vs Liquidity Voids in TradingFair Value Gaps vs Liquidity Voids in Trading
Understanding fair value gaps and liquidity voids is essential for traders seeking to navigate the complexities of the financial markets. These concepts, deeply rooted in the Smart Money Concept (SMC), provide valuable insights into the dynamics of supply and demand, helping to identify potential price movements. In this article, we’ll delve into both ideas, exploring their characteristics, differences, and use in trading.
Fair Value Gap (FVG) Meaning in Trading
A fair value gap, also known as an imbalance or FVG, is a crucial idea in Smart Money Concept that sheds light on the dynamics of supply and demand for a particular asset. This phenomenon occurs when there is a significant disparity between the number of buy and sell orders for an asset. They occur across all asset types, from forex and commodities to stocks and crypto*.
Essentially, a fair value gap in trading highlights a moment where the market consensus leans heavily towards either buying or selling but finds insufficient counter orders to match this enthusiasm. On a chart, this typically looks like a large candle that hasn’t yet been traded back through.
Specifically, a fair value gap is a three-candle pattern; the middle candle, or second candle, features a strong move in a given direction and is the most important, while the first and third candles represent the boundaries of the pattern. Once the third candle closes, the fair value gap is formed. There should be a distance between the wicks of the first and third candles.
Fair value gaps, like gaps in stocks, are often “filled” or traded back through at some point in the future. They represent areas of minimal resistance; there is little trading activity in these areas (compared to a horizontal range). Therefore, they are likely to be traded through with relative ease as price gravitates towards an area of support or resistance.
Liquidity Void Meaning in Trading
Liquidity voids in trading represent significant, abrupt price movements between two levels on a chart without the usual gradual trading activity in between. These are essentially larger and more substantial versions of fair value gaps, often encompassing multiple candles and FVGs, indicating a more pronounced imbalance between buy and sell orders.
While FVGs occur frequently and reflect the day-to-day shifts in market sentiment, liquidity voids signal a rapid repricing of an asset, typically following significant market events (though not always).
These voids are visual representations of moments when the market experiences a temporary absence of balance between buyers and sellers. This imbalance leads to a sharp move as the market seeks a new equilibrium price level. Such occurrences are not limited to specific times; they can happen after major news releases, during off-market hours, or following large institutional trades that significantly move the market with a single order.
Liquidity voids are especially noteworthy on trading charts due to their appearance as particularly sharp moves. Though they appear across all timeframes, they’re most obvious following major news events when the market rapidly adjusts to new information, creating opportunities and challenges for traders navigating these shifts.
Fair Value Gap vs Liquidity Void
Fair value gaps and liquidity voids are effectively the same thing in practice; a fair value gap is simply a shorter-term liquidity void. Both indicate moments of significant imbalance between supply and demand. At the heart of both phenomena is a situation where one significantly outweighs the other, leading to strong market movements with minimal consolidation. The distinction between them often comes down to scale and timeframe.
An FVG is typically identified by a specific three-candle pattern on a chart, signalling a discrete imbalance in order volume that prompts a quick price adjustment. These gaps reflect moments where the market sentiment strongly leans towards buying or selling yet lacks the opposite orders to maintain price stability.
Liquidity voids, on the other hand, represent more pronounced movements in a given direction, often visible as substantial price jumps or drops. They can encompass multiple FVGs and extend over larger portions of the chart, showcasing a significant repricing of an asset.
This distinction becomes particularly relevant when considering the timeframe of analysis; what appears as a series of FVGs on a lower timeframe can be interpreted as a liquidity void. On a higher timeframe, this liquidity void may appear as a singular fair value gap. This can be seen in the fair value gap example above.
For traders, it’s more practical to realise that both FVGs and liquidity voids highlight a key market phenomenon: when a notable supply and demand imbalance occurs, it tends to create a vacuum that the market is likely to fill at some future point. Therefore, it’s important to recognise that both these types of imbalances can act as potential indicators of future price movement back towards these unfilled spaces.
Trading Fair Value Gaps and Liquidity Voids
Trading strategies that leverage fair value gaps and liquidity voids require a nuanced approach, as these concepts alone may not suffice for a robust trading strategy. However, when integrated with other aspects of the Smart Money Concept, such as order blocks and breaks of structure, they can contribute significantly to a comprehensive market analysis framework.
Primarily, both FVGs and liquidity voids signal potential areas through which the price is likely to move rapidly to reach more significant zones of trading activity, such as order blocks or key levels of support and resistance.
This insight suggests that initiating positions directly within an FVG or a liquidity void may not be effective due to the high likelihood of the price moving swiftly through these areas. Instead, traders might find it more strategic to wait for the price to reach areas where historical trading activity reflects stronger levels of buy or sell interest.
Additionally, these market phenomena can inform the setting of price targets. If there is an FVG or liquidity void situated before a key area of interest, targeting the zone beyond the gap—where substantial trading activity is expected—could prove more effective than aiming for a point within the gap itself.
It's also useful to note the relative significance of these features when they appear on the same timeframe. An FVG, being generally smaller and indicating a discrete order imbalance, is more likely to be filled before a liquidity void. This is because liquidity voids represent more considerable and pronounced market movements that can set market direction, marking them as less likely to be filled within a short space of time.
Limitations of Fair Value Gaps and Liquidity Voids
While fair value gap trading strategies and the analysis of liquidity voids offer insightful approaches to understanding market dynamics, they come with inherent limitations that traders need to consider:
- Market Volatility: High volatility can unpredictably affect the filling of fair value gaps and liquidity voids, sometimes leading to incorrect analysis or false signals.
- Timeframe Relativity: The significance and potential impact of gaps and voids can vary greatly across different timeframes, complicating analysis.
- Incomplete Picture: Relying solely on these phenomena for trading decisions may result in an incomplete market analysis, as they do not account for all influencing factors.
- Expectations: There is no guarantee that a FVG/void will be filled soon or at any point in the near future.
The Bottom Line
As we conclude, it's essential to remember that while fair value gap and liquidity void strategies provide valuable insights, they’re part of a broader spectrum of SMC tools available to traders. They’re best combined with other analytical techniques to form a comprehensive approach to trading.
For those looking to delve deeper into trading strategies and enhance their market understanding, opening an FXOpen account can be a step toward accessing a wide array of resources and tools designed to support your trading journey.
FAQs
What Is a Fair Value Gap?
A fair value gap occurs when there's a significant difference between the buy and sell orders for an asset, indicating an imbalance that can influence market prices.
What Are Fair Value Gaps in Trading?
In trading, fair value gaps reflect moments where market sentiment strongly favours either buying or selling, creating potential price movement opportunities.
What Is the Difference Between a Fair Value Gap and a Liquidity Void?
The main difference lies in their scale: a fair value gap is typically a smaller, discrete occurrence, while a liquidity void represents a larger, more pronounced price movement.
How to Find Fair Value Gaps?
Traders identify fair value gaps by analysing trading charts for areas where rapid price movements have occurred. A FVG consists of three candles, where the second one is the largest and the first and third serve as barriers. The idea of the FVG is that it leads to a potential retracement to fill the gap in the future.
Is a Fair Value Gap the Same as an Imbalance?
Yes, a fair value gap is the same as an imbalance in the Smart Money Concept.
*Important: At FXOpen UK, Cryptocurrency trading via CFDs is only available to our Professional clients. They are not available for trading by Retail clients. To find out more information about how this may affect you, please get in touch with our team.
This article represents the opinion of the Companies operating under the FXOpen brand only. It is not to be construed as an offer, solicitation, or recommendation with respect to products and services provided by the Companies operating under the FXOpen brand, nor is it to be considered financial advice.

Predicting sell off, 30"++ in advance of a head and shouldersLet's examine how a head and shoulders is usually formed by a wave 4 and 5 and an A & B wave, the C wave is the sell off after the head and shoulders.
I use this pattern to predict a head and shoulders AT THE RIGHT NECKLINE. In this case 90 minutes in advance.. So 6 X 15 minute candles in advance we can predicted a H & S and a selloff, sound valubale?
if you understand this concept please give a thumbs up.
To go over price action again, we are going up on 5 waves. Wave 4 creates the left shoulder. After wave 5 we come down on an A wave, that is the right neckline.
This is where You can predict an B wave UP, and if it doesn't go higher than the previous wave 5, we will get a typical head and shoulder sell off after the wave B up.

TradeCityPro Academy | Dow Theory Part 3👋 Welcome to TradeCityPro Channel!
Welcome to the Educational Content Section of Our Channel Technical Analysis Training
We aim to produce educational content in playlist format that will teach you technical analysis from A to Z. We will cover topics such as risk and capital management, Dow Theory, support and resistance, trends, market cycles, and more. These lessons are based on our experiences and the book The Handbook of Technical Analysis.
🎨 What is Technical Analysis?
Technical Analysis (TA) is a method used to predict price movements in financial markets by analyzing past data, especially price and trading volume. This approach is based on the idea that historical price patterns tend to repeat and can help traders identify profitable opportunities.
🔹 Why is Technical Analysis Important?
Technical analysis helps traders and investors predict future price movements based on past price action. Its importance comes from several key benefits:
Faster Decision-Making: No need to analyze financial reports or complex news—just focus on price patterns and trading volume.
Better Risk Management: Tools like support & resistance, indicators, and chart patterns help traders find the best entry and exit points.
Applicable to All Markets: Technical analysis can be used in Forex, stocks, cryptocurrencies, commodities, and even real estate.
In the previous session, we explained Principles 3 and 4 of the Dow Theory. Be sure to review and study them, and if you have any questions, let us know in the comments.
📑 Principles of Dow Theory
1 - The Averages Discount Everything (Not applicable to crypto)
2 - The Market Has Three Trends
3 - Trends Have Three Phases
4 - Trend Continues Until a Reversal is Confirmed
5 - The Averages Must Confirm Each Other
6 - Volume Confirms the Trend
📈 Principle 5: Trends Persist Until a Clear Reversal Signal Appears
Full Explanation:
Dow Theory says that once a market picks a direction—like going up (bullish trend) or down (bearish trend)—it keeps moving that way until something big and obvious says, “Nope, we’re turning around!” Think of it like momentum: the market’s lazy and sticks to its path unless it gets a solid reason to switch.
What’s a Trend? It’s the market’s overall direction. Uptrend means higher highs and higher lows (prices keep climbing). Downtrend means lower highs and lower lows (prices keep dropping). Sideways means it’s stuck in a range.
What’s a Reversal Signal? In an uptrend, if prices stop making new highs and start forming lower highs and lows, plus break a key level (like support), that’s a sign the trend’s flipping. In a downtrend, it’s the opposite—higher highs and lows plus breaking resistance mean it’s turning up.
Why Does This Happen? Markets reflect crowd behavior. When everyone’s buying or selling, the trend builds steam and doesn’t stop until the crowd’s mood shifts big-time.
Key Point: Small dips or spikes don’t count. A little drop in an uptrend? Normal. You need a clear pattern or a big break to call it a reversal.
Practical Use: Traders use this to avoid panic-selling on tiny moves and wait for strong signals before jumping ship.
Simple Example:
It’s like riding a bike downhill—you keep rolling fast until you hit a wall or slam the brakes.
📊 Principle 6: Trends Must Be Confirmed by Volume
Full Explanation:
This principle says a trend isn’t legit unless trading volume backs it up. Volume is how much is being bought or sold. If the trend’s real, volume should match it—high volume means lots of people are in on it, low volume means it might be fake or weak.
Uptrend: Prices rising with growing volume? That’s a strong bull run—buyers are all in. Prices up but volume’s tiny? Could be a fluke or manipulation.
Downtrend: Prices falling with big volume? Sellers mean business—bear trend’s solid. Falling prices with low volume? Might just be a quick dip, not a real crash.
How Volume Confirms: It’s like a lie detector for trends. Big volume says, “This move’s for real!” Low volume says, “Eh, don’t trust it yet.”
Extra Detail: In an uptrend, if volume starts dropping, it’s a warning—buyers might be losing steam. In a downtrend, low volume could mean sellers are running out of ammo, hinting at a bounce.
Why It Matters? Dow believed volume shows the market’s true energy. No crowd, no power—simple as that.
Practical Use: Traders check tools like OBV (On-Balance Volume) or volume bars. If a stock jumps but volume’s dead, they might skip it it’s a trap.
Simple Example:
It’s like a party if tons of people show up dancing, it’s a real vibe. If just two guys are there, it’s probably lame.
🎉 Conclusion
We’ve reached the end of today’s educational segment! We’ll start by explaining all of Dow Theory’s principles, and in the future, we’ll move on to chart analysis and the strategy I personally use for trading with Dow Theory. So, make sure you fully grasp these concepts first so we can progress together in this learning journey!
💡 Final Thoughts for Today
This is the end of this part, and I must say we have a long journey ahead. We will continually strive to produce better content every day, steering clear of sensationalized content that promises unrealistic profits, and instead, focusing on the proper learning path of technical analysis.
⚠️ Please remember that these lessons represent our personal view of the market and should not be considered financial advice for investment.

Two Stock Market Crashes explained in one chart(ELLIOTT)The first is the Dot-Com Bubble that happened in Early 2000. This was the end of Wave 1(Black) and a retest was on the horizon. The market corrected with a zigzag marked in Red late in March 2000. What followed was a sharp drop Wave A(Red), B correction, and a 5 Wave move to complete Wave C of the zigzag. The 5 Wave move to Red Wave C is supported by Math as it retests at exactly at the 423% of the Fibonacci and 161.8% of Red Wave A on a Monthly time frame.
The second Stock Market Crash is the Financial Crisis of 2008 which by the way is the largest Stock Market Crash in the last 80 yrs. Historically, it is only second to the Great Depression of 1929. Can it be explained in terms of Elliott Wave? Yes. It was part of Wave 5 after Green Wave C ended. In fact, from Blue Wave 4/C there is a clear 5 wave move with a zigzag as its first correction and a flat as its second. The Financial Crisis is Wave 5 after the mentioned second flat but is called a Stock Market Crash!!
All this is avoidable.

2025 ICT Mentorship: Premium & Discount Price Delivery Intro2025 ICT Mentorship: Lecture 4_Premium & Discount Price Delivery Intro
Greetings Traders!
In this video, we dive into the fundamental concept of Premium and Discount Price Delivery—a crucial aspect of smart money trading that helps us understand how institutions approach the market with precision and efficiency.
Understanding Currency Pairs
Before we explore premium and discount dynamics, it's essential to grasp the basics of currency pairs. A currency pair, like EUR/USD or GBP/USD, represents the value of one currency against another. For example, EUR/USD shows how many U.S. dollars (the quote currency) are needed to purchase one euro (the base currency). Just like any other tradable asset, currency pairs fluctuate in value due to various economic and market factors.
Trading Is Part of Everyday Life
Believe it or not, everyone in the world is a trader. Whether you're buying groceries at a store or negotiating for goods and services, you're participating in trading activities daily. Some people aim to purchase items at a discount, while others can afford to pay a premium—it’s simply part of life.
However, banks and financial institutions take trading to another level. They don’t just trade haphazardly—they operate with extreme precision, aiming to make high-quality investments by executing trades at premium prices and targeting discount levels. This strategic approach allows them to capitalize on market inefficiencies and ensure profitable outcomes.
Why Premium and Discount Matter?
The concept of premium and discount price delivery is foundational for understanding how the market moves. By recognizing where the market is trading at a premium (overvalued) versus a discount (undervalued), traders can make more informed decisions and align their strategies with institutional order flow.
Stay tuned as we break down how to identify these zones on a chart and how to incorporate them into your trading strategy. Make sure to like, subscribe, and turn on notifications so you never miss an update!
Happy Trading,
The_Architect

A Pseudoscience called Technical analysis!Pseudoscience is characterized as a system of theories or beliefs that are presented as scientific but lack the rigors and foundations of the scientific method. It often uses scientific-sounding language while being rooted in unsubstantiated claims or cultural beliefs, and it can be misleading and harmful.
My Evolution as a Market Analyst
Early Success on TradingView
In 2020-2021, I established myself as a leading analyst on the TradingView platform, becoming the top-rated contributor for equities and high-volume tickers including TSLA, AAPL, AMZN, ARKK, COIN, RIOT, WKHS, PLTR, NIO, and Bitcoin.
Educational Background
My journey began fifteen years ago with a comprehensive study of technical analysis methodologies. I immersed myself in seminal works including:
"Technical Analysis of Financial Markets" by John J. Murphy
"Japanese Candlestick Charting Techniques" by Steve Nison
"Trading with the Andrews Pitchfork" by Glenn Wilson
"Elliott Wave - Fibonacci High Probability Trading" by Jared Sanders
Professional Recognition
While my initial goal in publishing analyses on TradingView was personal performance tracking, industry recognition came unexpectedly. Within three months, I ranked among the platform's top six contributors, advancing to the highest-rated position by the fourth month.
This visibility led to multiple partnership offers from brokerages and cryptocurrency projects, including Tiger Broker (NASDAQ: TIGR), all of which I declined to maintain independence.
Client Development
Following requests from followers, I established a contribution system to support ongoing analysis. My work attracted institutional attention, including a hedge fund managing hundreds of millions in assets that engaged me for educational services.
I developed a customized curriculum delivered via virtual platforms, maintaining a rigorous teaching schedule that ultimately revealed limitations in traditional technical analysis approaches—confirming Richard Feynman's observation that "When one teaches, two learn."
Methodological Evolution
This realization prompted a strategic pivot. I paused teaching to focus on skill development, particularly in programming and data analytics. I integrated advanced concepts including:
Game theory applications
Quantitative analysis frameworks
Behavioral finance principles
AI Integration
The emergence of accessible AI models represented a significant advancement for my practice. I leveraged Gemini (formerly Bard), ChatGPT, and Claude to enhance my options trading system, developing proprietary metrics to identify market inefficiencies in derivatives pricing.
Current Approach
Today, I operate as a substantially transformed analyst with a modernized market perspective. While my analytical methods employ sophisticated quantitative techniques, I continue presenting findings in traditional visual formats to accommodate audience preferences—a phenomenon explained by patternicity.
Understanding Cognitive Biases in Trading
Patternicity
A concept introduced by Michael Shermer describes our tendency to identify meaningful patterns within random noise
Highlights humanity's inherent drive to impose order on chaotic information
Significantly impacts decision-making processes as our minds actively seek connections, sometimes where none exist
Apophenia
The broader tendency to perceive connections between unrelated phenomena
First defined by German neurologist Klaus Conrad in 1958 as "unmotivated seeing of connections"
While common in everyday cognition, extreme manifestations can indicate psychological concerns
Trading in the AI Era
For market participants continuing to rely exclusively on traditional technical analysis methodologies—pattern trading, Elliott Wave theory, harmonic patterns, or price action systems—I offer this perspective: these approaches alone are increasingly insufficient for achieving consistent market outperformance in today's technology-driven environment.

Use Buy The Dip Like a LynchWhile we can’t say for certain that Merrill Lynch specifically uses VWAP (Volume Weighted Average Price) in their strategies, one thing is clear: they certainly rely on sophisticated statistical tools and data-driven insights to inform their investment decisions. Merrill Lynch, known for its expertise and successful track record, employs a range of techniques to navigate market fluctuations and identify profitable opportunities.
In the fast-paced world of trading, every decision counts. One strategy that has stood the test of time is Buy the Dip (BTD). This approach involves buying assets after they’ve experienced a temporary drop, anticipating that the price will bounce back 📉➡️📈. However, timing the dip correctly can be challenging without accurate data and predictive tools.
This article explores how to enhance your Buy the Dip predictions using OHLC Range Map and 4 VWAPs set to Century on TradingView.
What is the Buy the Dip Strategy? 🤔
The Buy the Dip (BTD) strategy is simple yet effective. Traders buy an asset after its price has fallen, believing that the dip is temporary and the price will soon rise again 📉➡️📈. The challenge, however, is knowing when the dip is truly an opportunity rather than the start of a longer-term downtrend.
This is where data-driven insights come into play. Rather than relying solely on intuition, having the right tools can make all the difference. With the OHLC Range Map, traders can gain a clearer understanding of price action, which helps identify whether a dip is worth buying 💰.
Strategies for Predicting Buy the Dip Levels 📍
Spot the Dip Using 4 VWAPS set to Century
Spot the Dip Using OHLC Range Map
1. Spot the Dip Using 4 VWAPS set to Century 🎯
Load 4 VWAPs on the chart, and configure them as follow:
1st VWAP: Source - Open, Period - Century
2st VWAP: Source - High, Period - Century
3rd VWAP: Source - Low, Period - Century
4th VWAP: Source - Close, Period - Century
When the price approaches key support or resistance zones, such as VWAP bands, particularly for well-established assets like ES, NQ, BTC, NVDA, AAPL, and others, there's a high probability of price reversal.
By combining this with price action analysis, you can identify precise entry points for a position with greater accuracy.
2. Spot the Dip Using OHLC Range Map 👀
The OHLC Range Map is a powerful statistical tool designed to plot key Manipulation (M) and Distribution levels over a specific time period. By visualizing these levels, traders can gain insights into market behavior and potential price movements.
For example, when analyzing the ES chart, we can observe that the bearish distribution level has already been reached for the next 12 months. This suggests that the market may be poised for a reversal, with the expectation of higher prices in the near future. By identifying these critical levels, traders can anticipate market trends and adjust their strategies accordingly.
Key Takeaways 🔍📊
Buy the Dip (BTD): The BTD strategy involves buying assets after a temporary price drop, expecting a price rebound.
Enhancing BTD Predictions: Using OHLC Range Map and 4 VWAPs on TradingView improves the accuracy of Buy the Dip predictions.
Spotting the Dip with 4 VWAPs: Configuring 4 VWAPs (Open, High, Low, Close) on a chart helps identify key support and resistance zones for potential price reversals.
Using the OHLC Range Map: The OHLC Range Map helps pinpoint Manipulation and Distribution levels, aiding in market trend anticipation and timing.
Combining Tools for Precision: Integrating the OHLC Range Map and VWAPs with price action analysis allows for more accurate Buy the Dip entry points.

Lesson 1.0.1A lesson I find myself forgetting many times over is
DO NOT ENTER IMMEDIATELY AT BREAKOUT/BREAKDOWN
In these markets, it is generally better to wait for a candle close confirmation above zone, followed by a retracement, and then you can enter.
Generally it is better to miss a move than lose money regardless.
Essentially if you want more of your trades to work, even at breakout or breakdown, wait.
While some may argue that you would miss the move, I would counter to say that if a move is incredibly and rapidly directional it is very likely there will be a retracement. Markets prefer a slow and steady rise or decline for stability, if it moves jaggedly it will eventually regress to the mean all the same.

Bitcoin and Elliott Wave Principles This is a good example showing how Bitcoin adheres to Elliott Wave Rules, as does everything in the Market. As stated other publications, the Elliott Wave Theory is more than just a Theory but how the market works. Bitcoin won't always buy, there will be ups and downs. Timing is key. If there is an over-investment just before the top of Wave B, ''Buy The Dip'', this would lead to unimaginable losses. This is what people call ''Stock Market Crash''. To Elliott Wave Theorists, this is a simple Wave 4.

THE IMPORTANCE OF TREND FOLLOWINGMost people tend to not check the overall trend not knowing that could potential be a danger to their trades and account
If the overall trend is a downtrend(making lower lows and lower high)- you should look only for selling entries especially if you trade bigger time frames(M15 to upwards). However it's not that simple or everyone would be making millions of dollars lol.
when you check the overall trend you should make sure the swing lows and high are clear, strong and the bearish/bullish pressure(volatility) should also be strong and clear if one of these is missing
then it's best to stay away from the market or you'll become liquidity for other trades😂
so all in all, combine your Trend following with liquidity and market volatility.

How to Trade Trend ReversalsThey say, “the trend is your friend”—until it bends at the end. Every strong move eventually runs out of steam, but spotting the turn and trading it effectively is no easy task. Some traders try to anticipate the reversal, positioning ahead of time, while others wait for confirmation, entering once the trend has already shifted. Both methods have their strengths and weaknesses, and the best approach depends on your risk tolerance and trading style.
Anticipating the Turn: Catching the Reversal Early
This approach focuses on momentum shifts and false breakouts before the price fully confirms a new trend. The goal is to enter before the crowd, capturing a reversal at the best possible price.
Key Tools:
Momentum Divergence – If price makes a new high or low, but RSI fails to follow, it suggests the trend is weakening.
False Breakouts – If price breaks a key level but immediately reverses, it signals a trap set for traders expecting continuation.
Benefits:
• Better risk-reward – Entering before the confirmation means stops can be tighter, allowing for a larger potential profit.
• First-mover advantage – Catching a trend change early means getting in at a great price before the majority of traders react.
Drawbacks:
• Higher failure rate – Many trends look weak before resuming, leading to premature entries and false starts.
• Requires precision – Entry and stop placement must be exact to avoid being caught in noise.
Waiting for Confirmation: Trading the Break
Rather than trying to predict the turn, this method waits for price to confirm the reversal by breaking key levels or forming a clear new trend structure.
Key Tools:
Trend Structure Shift – A series of lower highs in an uptrend, or higher lows in a downtrend, signals exhaustion.
Break of Key Support/Resistance – Once price decisively moves beyond a critical level, it confirms the trend change.
Benefits:
• Higher probability trades – Waiting for confirmation reduces the risk of being faked out by temporary pullbacks.
• Less stressful – Entering after the break avoids the uncertainty of catching tops and bottoms.
Drawbacks:
• Worse risk-reward – Entry is later, meaning stops tend to be wider and potential profits smaller.
• Missed moves – Sometimes, a reversal happens too quickly, leaving conservative traders behind.
Applying Both Methods: Two Live Market Examples
1. EUR/USD – A Potential Trend Reversal in Progress
Recently, EUR/USD had been stuck in a long-term downtrend, with lower lows forming consistently. But the latest attempt to break support failed spectacularly.
Anticipatory Approach: Traders watching for a false breakout could have entered after price dipped below support and immediately reversed. RSI also showed bullish divergence—momentum was no longer confirming the downtrend. Entry would be placed just above the reclaimed support, with a tight stop below the false breakdown.
Momentum-Based Approach: Traders waiting for confirmation would have looked for a strong breakout above the first major resistance. After the false breakdown, price surged above prior swing highs, confirming buyers had taken control. The break of horizontal resistance provided a clearer entry signal, with stops below the breakout level.
EUR/USD Daily Candle Chart
Past performance is not a reliable indicator of future results
2. S&P 500 – The Start of a Breakdown?
The S&P 500 had been in a strong uptrend, but multiple failed attempts to break through resistance suggested buyers were losing momentum. Eventually, price broke below key support, triggering a sharp decline.
Anticipatory Approach: Traders looking for early signs of weakness could have entered short after noticing a series of failed breakouts. RSI divergence signalled that momentum was waning, and the repeated failures at resistance suggested a sell-off was brewing. The entry would have been placed near resistance, with stops just above the recent highs.
Momentum-Based Approach: A more patient trader would have waited for a confirmed break of support. Once the S&P sliced through a major level, a short trade could be initiated on the retest of the broken support, with stops just above the previous swing low.
S&P Daily Candle Chart
Past performance is not a reliable indicator of future results
Final Thoughts: Choosing the Right Approach
Both methods have their advantages. Anticipating reversals can offer an early entry with strong risk-reward potential, but it also comes with a higher chance of false signals. Waiting for confirmation provides greater clarity and reduces the likelihood of premature entries, though it often means entering later in the move.
Neither approach is inherently better—it depends on your trading style, risk tolerance, and strategy. The key is consistency: whichever method you use, having a clear plan and following it with discipline is what separates successful traders from those who get caught on the wrong side of a trend change.
Disclaimer: This is for information and learning purposes only. The information provided does not constitute investment advice nor take into account the individual financial circumstances or objectives of any investor. Any information that may be provided relating to past performance is not a reliable indicator of future results or performance. Social media channels are not relevant for UK residents.
Spread bets and CFDs are complex instruments and come with a high risk of losing money rapidly due to leverage. 83% of retail investor accounts lose money when trading spread bets and CFDs with this provider. You should consider whether you understand how spread bets and CFDs work and whether you can afford to take the high risk of losing your money.

3 Best Entry Points For Swing Trading (Forex, Gold)
What is the best entry point for swing trading?
You will learn 3 safest places/zones to buy or sell the market from, best swing trading time frame, and the most accurate swing trading setups.
Best Entry 1
Swing Trading After a Confirmed Trend Reversal
It can be a bearish trend violation and a start of a new bullish trend.
Look at a price action on WTI Crude Oil on a daily.
The market violated a bearish trend and started to trade in a new bullish trend, confirming the reversal.
In such a case, your best entry will be the closest daily support.
Alternatively, it can be a bullish trend violation and an initiation of a new bearish trend.
USDCAD was in an uptrend, steadily growing within a parallel channel.
Its violation confirmed the change of sentiment and start of a downtrend.
In this situation, your safest entries will be from the closest daily resistance.
Best Entry 2
Swing Trading with the Trend After Pullback
In a bullish trend, you should wait for
a completion of a bullish movement,
wait for a pullback
swing buy the market after it completes.
AUDCAD is in a rising trend.
A pullback tends to complete on a key support.
That will be your zone for buying.
Otherwise, in a bearish trend, you should let the price:
finish a bearish impulse
start a correctional movement
sell the market after the correction ends.
USDCHF was in downturn and updated the low. A local bullish movement started then.
It usually completes after a test of a key resistance. That will be the area where you should look for swing selling.
Best Entry 3
Swing Trading After Key Level Breakout
Bearish violation of a key daily support is a perfect signal to sell.
It is an important sign of strength of the sellers and a strong indication that the price will continue falling.
NZDUSD broke and closed below a key daily support cluster. After a breakout, it turns into a potentially strong resistance.
For us, the best entry is a retest of a broken structure.
Bullish breakout of a key daily resistance is a reliable signal to buy.
After a violation of a horizontal resistance, it became a support on USDCHF Forex pair on a daily.
Your perfect entry for swing buying is its retest .
The entry zones that we discussed will provide the safest trading opportunities.
Learn to combine that with your trading strategy, it will help you to dramatically increase the profitability of your swing trading.
❤️Please, support my work with like, thank you!❤️
I am part of Trade Nation's Influencer program and receive a monthly fee for using their TradingView charts in my analysis.

What Are Financial Derivatives and How to Trade Them?What Are Financial Derivatives and How to Trade Them?
Financial derivatives are powerful instruments used by traders to speculate on market movements or manage risk. From futures to CFDs, derivatives offer potential opportunities across global markets. This article examines “What is a derivative in finance?”, delving into the main types of derivatives, how they function, and key considerations for traders.
What Are Derivatives?
A financial derivative is a contract with its value tied to the performance of an underlying asset. These assets can include stocks, commodities, currencies, ETFs, or market indices. Instead of buying the asset itself, traders and investors use derivatives to speculate on price movements or manage financial risk.
Fundamentally, derivatives are contracts made between two parties. They allow one side to take advantage of changes in the asset's price, whether it rises or falls. For example, a futures contract locks in a price for buying or selling an asset on a specific date, while a contract for difference (CFD) helps traders speculate on the price of an asset without owning it.
The flexibility of derivatives is what makes them valuable. They can hedge against potential losses, potentially amplify returns through leverage, or provide access to otherwise difficult-to-trade markets. Derivatives are traded either on regulated exchanges or through over-the-counter (OTC) markets, each with distinct benefits and risks.
Leverage is a very common feature in derivative trading, enabling traders to control larger positions with less capital. However, it’s worth remembering that while this amplifies potential returns, it equally increases the risk of losses.
These instruments play a pivotal role in modern finance, offering tools to navigate market volatility or target specific investment goals. However, their complexity means they require careful understanding and strategic use to potentially avoid unintended risks.
Key Types of Financial Derivatives
There are various types of derivatives, each tailored to different trading strategies and financial needs. Understanding the main type of derivative can help traders navigate their unique features and applications. Below are the most common examples of derivatives:
Futures Contracts
Futures involve a contract to buy or sell an asset at a set price on a specific future date. These contracts are standardised and traded on exchanges, making them transparent and widely accessible. Futures are commonly used in commodities markets—like oil or wheat—but also extend to indices and currencies. Traders commonly utilise this type of derivative to potentially manage risks associated with price fluctuations or to speculate on potential market movements.
Forward Contracts
A forward contract is a financial agreement in which two parties commit to buying or selling an asset at a predetermined price on a specified future date. Unlike standardised futures contracts, forward contracts are customizable and traded privately, typically over-the-counter (OTC). These contracts are commonly used for hedging or speculating on price movements of assets such as commodities, currencies, or financial instruments.
Swaps
Swaps are customised contracts, typically traded over-the-counter (OTC). The most common types are interest rate swaps, where two parties agree to exchange streams of interest payments based on a specified notional amount over a set period, and currency swaps, which involve the exchange of principal and interest payments in different currencies. Swaps are primarily used by institutions to manage long-term exposure to interest rates or currency risks.
Contracts for Difference (CFDs)
CFDs allow traders to speculate on price changes of an underlying asset. They are flexible, covering a wide range of markets such as shares, commodities, and indices. CFDs are particularly attractive as they allow traders to speculate on rising and falling prices of an asset without owning it. Moreover, CFDs provide potential opportunities for short-term trading, which may be unavailable with other financial instruments.
Trading Derivatives: Mechanisms and Strategies
Trading derivatives revolves around two primary methods: exchange-traded and over-the-counter (OTC) markets. Each offers potential opportunities for traders, depending on their goals and risk tolerance.
Exchange-Traded Derivatives
These derivatives, like futures, are standardised and traded on regulated exchanges such as the Chicago Mercantile Exchange (CME). Standardisation ensures transparency, making it potentially easier for traders to open buy or sell positions. For example, a trader might use futures contracts to hedge against potential price movements in commodities or indices.
Over-the-Counter (OTC) Derivatives
OTC derivatives, including swaps and forwards and contracts for difference, are negotiated directly between two parties. These contracts are highly customisable but may carry more counterparty risk, as they aren't cleared through a central exchange. Institutions often use OTC derivatives for tailored solutions, such as managing interest rate fluctuations.
Strategies for Trading Derivatives
Traders typically employ derivatives for speculation or hedging. Speculation involves taking positions based on anticipated market movements, such as buying a CFD if prices are expected to rise. Hedging, on the other hand, can potentially mitigate losses in an existing portfolio by offsetting potential risks, like using currency swaps to protect against foreign exchange volatility.
Risk management plays a crucial role when trading derivatives. Understanding the underlying asset, monitoring market conditions, and using appropriate position sizes are vital to navigating their complexity.
CFD Trading
Contracts for Difference (CFDs) are among the most accessible derivative products for retail traders. They allow for speculation on price movements across a wide range of markets, including stocks, commodities, currencies, and indices, without owning the underlying asset. This flexibility makes CFDs an appealing option for individuals looking to diversify their strategies and explore global markets.
How CFDs Work
CFDs represent an agreement between the trader and the broker to exchange the difference in an asset's price between the opening and closing of a trade. If the price moves in the trader’s favour, the broker pays the difference; if it moves against them, the trader covers the loss. This structure is straightforward, allowing retail traders to trade in both rising and falling markets.
Why Retail Traders Use CFDs
Retail traders often gravitate towards CFDs due to their accessibility and unique features. CFDs allow leverage trading. By depositing a smaller margin, traders can gain exposure to much larger positions, potentially amplifying returns. However, you should remember that this comes with heightened risk, as losses are also magnified.
Markets and Opportunities
CFDs offer exposure to an extensive range of markets, including stocks, forex pairs, commodities, and popular indices like the S&P 500. Retail traders particularly appreciate the ability to trade these markets with minimal upfront capital, as well as the availability of 24/5 trading for many instruments. CFDs also enable traders to access international markets they might otherwise find difficult to trade, such as Asian or European indices.
Traders can explore a variety of CFDs with FXOpen.
Considerations for CFD Trading
While CFDs offer potential opportunities, traders must approach them cautiously. Leverage and high market volatility can lead to significant losses. Effective risk management in derivatives, meaning using stop-loss orders or limiting position sizes, can help traders potentially navigate these risks. Additionally, costs like spreads, commissions, and overnight fees can add up, so understanding the total cost structure is crucial.
Key Considerations When Trading Derivatives
Trading derivatives requires careful analysis and a clear understanding of the associated risks and potential opportunities.
Understanding the Underlying Asset
The value of a derivative depends entirely on its underlying asset, whether it’s a stock, commodity, currency, or index. Analysing the asset’s price behaviour, market trends, and potential volatility is crucial to identifying potential opportunities and risks.
Choosing the Right Derivative Product
Different derivatives serve different purposes. Futures might suit traders looking for exposure to commodities or indices, while CFDs provide accessible and potential opportunities for those seeking short-term price movements. Matching the derivative to your strategy is vital.
Managing Risk Effectively
Risk management plays a significant role in trading derivatives. Leverage can amplify both returns and losses, so traders often set clear limits on position sizes and overall exposure. Stop-loss orders and diversification are common ways to potentially reduce the impact of adverse market moves.
Understanding Costs
Trading derivatives involves costs like spreads, commissions, and potential overnight financing fees. These can eat into potential returns, especially for high-frequency or leveraged trades. A clear understanding of these expenses may help traders evaluate the effectiveness of their strategies.
Monitoring Market Conditions
Derivatives are sensitive to their underlying market changes, from geopolitical events to macroeconomic data. In stock derivatives, this might be company earning reports or sudden shifts in management. Staying informed helps traders adapt to shifting conditions and avoid being caught off guard by sudden price swings.
The Bottom Line
Financial derivatives are versatile tools for trading and hedging, offering potential opportunities to access global markets and diversify strategies. While their complexity demands a solid understanding, they can unlock significant potential for informed traders. Ready to explore derivatives trading? Open an FXOpen account today to trade CFDs on more than 700 assets with competitive costs, fast execution, and advanced trading tools. Good luck!
FAQ
What Is a Derivative?
The derivatives definition refers to a financial contract whose value is based on the performance of an underlying asset, such as stocks, commodities, currencies, or indices. Derivatives are financial instruments used to hedge risk, speculate on price movements, or access specific markets. Examples include futures, forwards, swaps, and contracts for difference (CFDs).
What Are the 4 Main Derivatives?
The primary categories of derivatives are futures, forwards, swaps, and contracts for difference (CFDs). Futures are commonly traded on exchanges, while forwards, swaps and CFDs are usually traded over-the-counter (OTC). Each serves different purposes, from risk management to speculative trading.
What Is the Derivatives Market?
The derivatives market is where financial derivatives are bought and sold. It includes regulated exchanges, like the Chicago Mercantile Exchange, and OTC markets where customised contracts are negotiated directly between parties. This market supports hedging, speculation, and risk transfer across global financial systems.
What Is the Difference Between Derivatives and Equities?
Equities signify ownership in a company, typically in the form of stock shares. Derivatives, on the other hand, are contracts that derive their value from the performance of an underlying asset, which can include equities. Unlike equities, derivatives do not confer ownership.
Is an ETF a Derivative?
No, an exchange-traded fund (ETF) is not a derivative. It is a fund that tracks a basket of assets, such as stocks or bonds, and trades like a stock. However, ETFs can use derivatives, such as futures, to achieve their investment objectives.
Is the S&P 500 a Derivative?
No, the S&P 500 is not a derivative. It is a stock market index that tracks the performance of 500 large companies listed in the US. Derivatives, like futures, can be created based on the S&P 500’s performance.
This article represents the opinion of the Companies operating under the FXOpen brand only. It is not to be construed as an offer, solicitation, or recommendation with respect to products and services provided by the Companies operating under the FXOpen brand, nor is it to be considered financial advice.

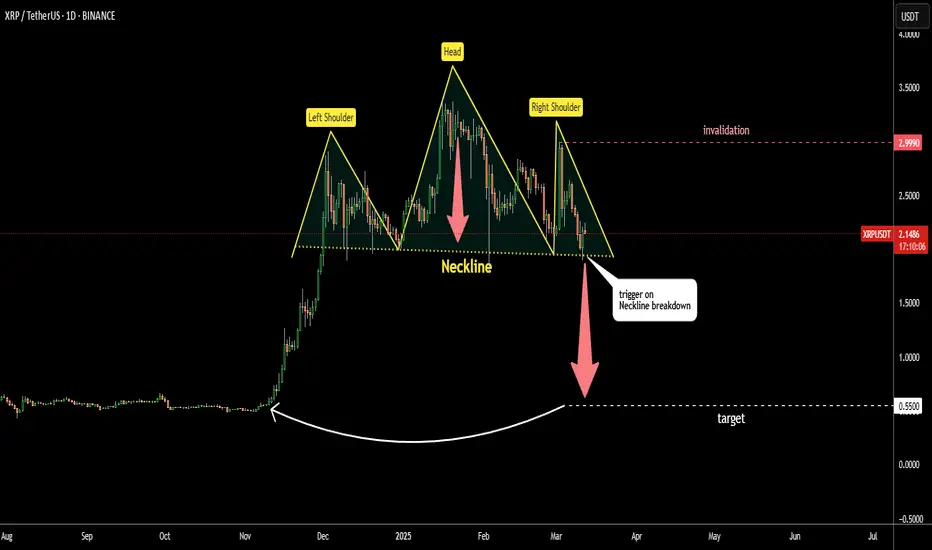
This Pattern Could Return Ripple (XRP) Where It Started Rally Textbook, beautiful symmetric Head & Shoulders reversal pattern emerged on Ripple
approaching the Neckline.
Head is the highest peak among three on the chart
Neckline is built through valleys of the Head.
Price already tested Neckline support and was rejected yesterday.
Bearish trigger is on the clear breakdown.
Target is located at 0.55
It was calculated by subtracting the height of the Head from the Neckline.
It is the support area where XRP started its rally before.
"What goes up should come down"