Trading a Pause in the Price Action
Some candlestick patterns shout their intentions, while others quietly mark a pause before the next move. The Doji falls into the latter category—it doesn’t tell you which way the market is going next, but it does highlight a moment of indecision that often precedes a meaningful move.
While traders sometimes mistake it for a reversal signal, the real significance of a Doji comes when price decisively breaks beyond its range. Let’s explore what a Doji represents, why its range is key and how traders can use it in different market conditions.
What Is a Doji?
A standard Doji forms when a market opens and closes at or very near the same price. This creates a candle with a thin or non-existent body and wicks on either side, showing that price moved up and down during the session but failed to establish a clear direction by the close.
The key takeaway? A Doji does not indicate a directional bias—it simply reflects the natural market cycle between indecision and decisive direction. It tells us that neither buyers nor sellers had the upper hand during that period.
Standard Doji Pattern
Past performance is not a reliable indicator of future results
The Doji’s Range: Why It’s Important
Rather than trading the Doji itself, the focus should be on its high and low. When price breaks and closes beyond the Doji’s range, that’s when a potential trade setup forms:
• A close above the Doji’s high suggests buyers have taken control, increasing the likelihood of further upside.
• A close below the Doji’s low signals sellers are in charge, making downside continuation more probable.
This makes the Doji a pattern that doesn’t rely on lagging indicators. It provides a forward-looking view, allowing traders to anticipate where momentum might emerge.
A single Doji can be significant, but clusters of Doji candles—where price hesitates over multiple sessions—can create even stronger setups, particularly when they resolve with a decisive breakout.
Doji’s Range Becomes Significant
Past performance is not a reliable indicator of future results
Doji Breakout
Past performance is not a reliable indicator of future results
How to Use the Doji in Trading
The Doji pattern works across all timeframes, from intraday charts to daily and even weekly price action. Looking at USD/JPY on the daily timeframe (see chart below), four Doji formations highlight how the pattern plays out in real-world trading:
USD/JPY Daily Candle Chart
Past performance is not a reliable indicator of future results
Pattern 1 (Monday, 25th November 2024): A Doji formed, followed by a strong break below its range, leading to a clear move lower.
Patterns 2 & 3 (Early December 2024): Two Doji candles appeared close together, forming a Doji cluster. This hesitation phase was followed by a steady directional move higher.
Pattern 4 (Early February 2025): The initial break below the Doji’s range led to a short-lived move lower. However, price then pulled back, retested the Doji, and only after that retest did a more sustained downside move develop.
These examples show that the Doji is not a trading signal in isolation—it needs a decisive break to confirm the next move.
Trading the Doji Breakout
If a trader is looking to enter based on a Doji setup, they should consider the following:
• Wait for Confirmation – The most important factor is the breakout. A Doji on its own is just indecision; it’s the next candle that provides the real clue.
• Identify the Key Level – The high and low of the Doji form a mini-range. A close outside this range is the real signal.
• Manage Risk Properly – A common approach is to place a stop-loss just beyond the opposite side of the Doji’s range.
Because Doji candles highlight hesitation, they often form at key support or resistance levels. When price is already in an established trend, a Doji can act as a temporary pause before continuation.
Summary:
The Doji is a pause in price action, not a guarantee of reversal or continuation. The real significance lies in how price reacts after the Doji forms—a decisive break and close beyond its range is the key trigger.
While traders often focus on patterns that appear to provide clear direction, the Doji offers something different—it marks the moment before clarity emerges. Whether it leads to a breakout, a trend continuation, or a reversal depends entirely on the price action that follows.
Disclaimer: This is for information and learning purposes only. The information provided does not constitute investment advice nor take into account the individual financial circumstances or objectives of any investor. Any information that may be provided relating to past performance is not a reliable indicator of future results or performance. Social media channels are not relevant for UK residents.
Spread bets and CFDs are complex instruments and come with a high risk of losing money rapidly due to leverage. 83% of retail investor accounts lose money when trading spread bets and CFDs with this provider. You should consider whether you understand how spread bets and CFDs work and whether you can afford to take the high risk of losing your money.
Community ideas

High Volatility Trade Management & Risk Management Strategies
With a current geopolitical uncertainty and the election of Trump, forex market and gold experience wild price fluctuations. These unpredictable swings can result in substantial losses, particularly for the beginners in trading.
In this article, I will share with you the essential trade management and risk management tips for dealing with extreme volatility in trading.
I will reveal proven strategies and techniques for avoiding losses and unexpected risks.
1. First and foremost, pay attention to the news.
The main driver of high volatility on the markets are the news , especially the bad ones.
In normal times, high impact news events are relatively rare, while in times of uncertainty their frequency increases dramatically.
Such news may easily invalidate the best technical analysis setup: any powerful support or resistance level, strong price action or candle stick pattern can be easily overturned by the fundamentals.
Trump tariffs threats against Canada made USDCAD rise by 400 pips rapidly, while the change of rhetoric quickly returned the prices to previous levels.
One you hold an active trade, monitor the news. If you see the impactful news that may affect the pair or instrument that you trade, immediately protect your position, moving stop loss to entry.
It will help you avoid losses if the market starts going against you.
2. Even constantly monitoring the news, you will not be able to protect yourself from all the surprising movements.
Sometimes your trades will quickly be closed in a loss.
Therefore, I strictly recommend measure a lot size for every trade that you take. Make sure that you risk no more than 1% of your trading account per trade. That will help you to minimize losses cased by the impactful, uncertain events.
3. The impactful events may also occur on weekend, while Forex market is closed. Such incidents can be the cause of huge gap openings.
If you hold an active trading position over the weekend, remember that your entire account can be easily blown with such gaps.
Imagine that you decided to buy EURUSD on Friday during the NY session and keep holding the position over the weekend.
A huge gap down opening would make you face huge losses, opening the market 125 pips below the entry level.
By the way, this day I received a dozen of messages from my followers that their accounts were blown with the opening gaps.
4. If you see a significant price movement caused by some events, and you did not manage to catch it, let it go.
Jumping in such movements is very risky because quite ofter correctional movements will follow quickly.
It will be much safer and better to try to be involved in a trend continuation after a pullback.
Look what happened with Gold when Trump began a new trade war.
The price started to grow rapidly. However, even during such a sentiment, 500 pips pullback occurred, giving patient traders a safe entry point for the trade.
5. In the midst of geopolitical tensions and trade wars, the markets tend to rally or fall for the extended time periods.
The best trading strategies to use to get maximum from such movements are trend-following strategies.
While reversal, counter-trend trading might be extremely risky, providing a lot of false signals.
Trend trading may bring extraordinary profits.
These trading tips, risk management and trade management strategies and secrets are tailored for cutting and avoiding losses during dark times. Empower your strategy with this useful knowledge and good luck to you in trading high volatility on Gold and Forex.
❤️Please, support my work with like, thank you!❤️
I am part of Trade Nation's Influencer program and receive a monthly fee for using their TradingView charts in my analysis.

BTC EMA TRADING STRATEGYIn this video, I show you guys how I trade using the higher timeframe 12,21 EMA bands to find entries on 1min timeframe and capture the bigger trend with tight SL and huge R/R.
Benefits
1. Tight invalidation, leading to Massive winners
2. Entry and SL is based on pure Market structure.
3. Price first apporach

Mastering Fibonacci Retracements & Extensions on TradingView!1. Introduction to Fibonacci in Trading
Fibonacci levels are widely used in trading to identify potential reversal zones, support, and resistance levels. These levels are derived from the Fibonacci sequence, a mathematical pattern found in nature and financial markets. Traders rely on Fibonacci retracements to find potential entry points and Fibonacci extensions to determine profit targets. The most critical area of interest is the golden pocket zone, which ranges between 0.618 and 0.65. Price often reacts strongly in this zone, either reversing or continuing its trend, making it a key level for traders to watch.
2. Key Fibonacci Levels for Trading
Several Fibonacci levels are commonly used in trading. The 0.5 level, although not an actual Fibonacci number, is often observed as a psychological retracement level. The golden pocket zone, which consists of the 0.618 and 0.65 levels, is considered the most important for potential reversals. The 0.786 level represents a deeper retracement and is frequently used by traders for more precise entries before a strong price move. On the other hand, Fibonacci extensions, such as -0.618 and -1.618, are used to project potential price targets. These levels serve as reference points for identifying support and resistance, allowing traders to make more informed trading decisions.
3. How to Draw Fibonacci Retracements on TradingView
To effectively use Fibonacci retracements, traders must first identify a swing high and a swing low on the chart. This process starts by recognizing a strong uptrend or downtrend. Once identified, the Fibonacci tool in TradingView can be used to plot retracement levels. By selecting the swing low and dragging it to the swing high in a bullish setup, or vice versa in a bearish setup, traders can visualize the key Fibonacci levels. It is essential to adjust the settings to only display 0.5, 0.618, 0.65, 0.786, -0.618, and -1.618 for better clarity. This method provides a structured approach to analyzing potential price reactions and planning trades with greater accuracy.
4. Trading Strategies Using Fibonacci Levels
A. The Golden Pocket Entry Strategy (0.618–0.65)
One of the most reliable trading strategies involving Fibonacci retracements is based on the golden pocket zone. When price retraces to the 0.618–0.65 area, traders look for confirmation signals before entering a trade. These confirmations may include bullish or bearish candlestick patterns, such as engulfing candles, pin bars, or hammer formations. Additionally, traders may use momentum indicators like RSI or MACD to identify divergences, which suggest a potential trend reversal. A spike in volume at these levels can further validate the trade setup. A typical strategy involves entering a trade within the golden pocket, setting a stop-loss slightly below the 0.786 level for risk management, and targeting Fibonacci extensions for profit-taking.
B. Fibonacci Extensions (-0.618 & -1.618) for Profit Targets
Fibonacci extensions serve as valuable tools for setting take-profit levels in trending markets. Once price confirms a reversal from a retracement level, traders use extensions to project future price movements. The -0.618 extension is often considered a conservative target, providing an early profit-taking opportunity. Meanwhile, the -1.618 extension is a more aggressive target, generally used in strong trends where price momentum is high. By integrating Fibonacci extensions into their strategy, traders can optimize their exits, ensuring they capture the full potential of a move while minimizing premature exits.
5. Common Mistakes & How to Avoid Them
Despite its effectiveness, Fibonacci analysis requires proper execution. One common mistake traders make is drawing Fibonacci levels incorrectly by selecting the wrong swing points. Accuracy in identifying the correct high and low points is crucial for reliable retracement levels. Another mistake is over-reliance on Fibonacci without additional confirmations. Traders should always seek confluence with other technical indicators, such as support and resistance levels, moving averages, or volume analysis. Additionally, failing to wait for confirmation signals can lead to premature entries, increasing the risk of losses. Understanding these pitfalls and applying Fibonacci with proper validation techniques can significantly improve trading outcomes.
6. Pro Tips for Using Fibonacci Like a Pro
For best results, traders should use Fibonacci analysis on higher timeframes, such as the 1-hour, 4-hour, or daily charts, as these provide more reliable signals compared to lower timeframes. Confluence plays a crucial role in validating Fibonacci levels, so traders should always look for overlapping support and resistance, trendlines, or moving averages. Additionally, backtesting Fibonacci strategies using TradingView’s replay mode can help traders refine their approach and gain confidence in their setups before applying them in live trading. By combining Fibonacci with other technical tools and maintaining discipline in execution, traders can enhance their decision-making process and improve their overall trading success.
Final Thoughts
Mastering Fibonacci retracements and extensions can significantly improve trade accuracy. By focusing on the golden pocket zone (0.618–0.65) and using Fibonacci extensions like -0.618 and -1.618 as profit targets, traders can refine their strategies and maximize profitability. Understanding how price interacts with these levels and applying additional confirmations ensures more precise trade entries and exits. With practice and proper analysis, Fibonacci can become a powerful tool in any trader’s arsenal.
__________________________________________
Thanks for your support!
If you found this idea helpful or learned something new, drop a like 👍 and leave a comment, I’d love to hear your thoughts! 🚀
Make sure to follow me for more price action insights, free indicators, and trading strategies. Let’s grow and trade smarter together! 📈

What Is a Liquidity Sweep and How Can You Use It in Trading?What Is a Liquidity Sweep and How Can You Use It in Trading?
Mastering key concepts such as liquidity is crucial for optimising trading strategies. This article explores the concept of a liquidity sweep, a pivotal phenomenon within trading that involves large-scale players impacting price movements by triggering clustered pending orders, and how traders can leverage them for deeper trading insights.
Understanding Liquidity in Trading
In trading, liquidity refers to the ability to buy or sell assets quickly without causing significant price changes. This concept is essential as it determines the ease with which transactions can be completed. High liquidity means that there are sufficient buyers and sellers at any given time, which results in tighter spreads between the bid and ask prices and more efficient trading.
Liquidity is often visualised as the market's bloodstream, vital for its smooth and efficient operation. Financial assets rely on this seamless flow to ensure that trades can be executed rapidly and at particular prices. Various participants, including retail investors, institutions, and market makers, contribute to this ecosystem by providing the necessary volume of trades.
Liquidity is also dynamic and influenced by factors such as notable news and economic events, which can all affect how quickly assets can be bought or sold. For traders, understanding liquidity is crucial because it affects trading strategies, particularly in terms of entry and exit points in the markets.
What Is a Liquidity Sweep?
A liquidity sweep in trading is a phenomenon within the Smart Money Concept (SMC) framework that occurs when significant market players execute large-volume trades to trigger the activation of a cluster of pending buy or sell orders at certain price levels, enabling them to enter a large position with minimal slippage. This action typically results in rapid price movements and targets what are known as liquidity zones.
Understanding Liquidity Zones
Liquidity zones are specific areas on a trading chart where there is a high concentration of orders, including stop losses and pending orders. These zones are pivotal because they represent the levels at which substantial buying or selling interest is anticipated once activated. When the price reaches these zones, the accumulated orders are executed, which can cause sudden and sharp price movements.
How Liquidity Sweeps Function
The process begins when market participants, especially institutional traders or large-scale speculators, identify these zones. By pushing the market to these levels, they trigger other orders clustered in the zone. The activation of these orders adds to the initial momentum, often causing the price to move even more sharply in the intended direction. This strategy can be utilised to enter a position favourably or to exit one by pushing the price to a level where a reversal is likely.
Liquidity Sweep vs Liquidity Grab
Within the liquidity sweep process, it's crucial to distinguish between a sweep and a grab:
- Liquidity Sweep: This is typically a broader movement where the price action moves through a liquidity zone, activating a large volume of orders and thereby affecting a significant range of prices.
- Liquidity Grab: Often a more targeted and shorter-duration manoeuvre, this involves the price quickly hitting a specific level to trigger orders before reversing direction. This is typically used to 'grab' liquidity by activating stops or pending positions before the price continues to move in the same direction.
In short, a grab may just move slightly beyond a peak or low before reversing, while a sweep can see a sustained movement beyond these points prior to a reversal. There is a subtle difference, but the outcome—a reversal—is usually the same.
Spotting a Liquidity Sweep in the Market
Identifying a sweep involves recognising where liquidity builds up and monitoring how the price interacts with these zones. It typically accumulates at key levels where traders have placed significant numbers of stop-loss orders or pending buy and sell positions.
These areas include:
- Swing Highs and Swing Lows: These are peaks and troughs in the market where traders expect resistance or support, leading to the accumulation of orders.
- Support and Resistance Levels: Historical areas that have repeatedly influenced price movements are watched closely for potential liquidity buildup.
- Fibonacci Levels: Common tools in technical analysis; these levels often see a concentration of orders due to their popularity among traders.
The strategy for spotting a sweep involves observing when the price approaches and breaks through these levels. Traders look for a decisive move that extends beyond the identified zones and watch how the asset behaves as it enters adjacent points of interest, such as order blocks. The key is to monitor for a subsequent reversal or deceleration in price movement, which can signal that the sweep has occurred and the market is absorbing the liquidity.
This approach helps traders discern whether a significant movement is likely a result of a sweep, allowing them to make more informed decisions about entering or exiting positions based on the anticipated reversal or continuation of the price movement.
How to Use Liquidity Sweeps in Trading
Traders often leverage liquidity sweeps in forex as strategic indicators within a broader Smart Money Concept framework, particularly in conjunction with order blocks and fair value gaps. Understanding how these elements interact provides traders with a robust method for anticipating and reacting to potential price movements.
Understanding Order Blocks and Fair Value Gaps
Order blocks are essentially levels or areas where historical buying or selling was significant enough to impact an asset’s direction. These blocks can act as future points of interest where the price might react due to leftover or renewed interest from market participants.
Fair value gaps are areas on a chart that were quickly overlooked in previous movements. These gaps often attract price back to them, as the market seeks to 'fill' these areas by finding the fair value that was previously skipped.
Practical Application in Trading Strategies
Learn how liquidity sweeps can be applied to trading strategies.
Identifying the Trend Direction
The application of liquidity sweeps starts with understanding the current trend, which can be discerned through the market structure—the series of highs and lows that dictate the direction of the market movement.
Locating Liquidity Zones
Within the identified trend, traders pinpoint liquidity zones, which could be significant recent swing highs or lows or areas marked by repeated equal highs/lows or strong support/resistance levels.
Observing Order Blocks and Fair Value Gaps
After identifying a liquidity zone, traders then look for an order block beyond this zone. The presence of a fair value gap near the block enhances the likelihood of the block being reached, as these gaps are frequently filled.
Trade Execution
When the price moves into the order block, effectively sweeping liquidity, traders may place limit orders at the block with a stop loss just beyond it. This action is often based on the expectation that the order block will trigger a reversal.
Utilising Liquidity Sweeps for Entry Confidence
The occurrence of a sweep into an order block not only triggers the potential reversal but also provides traders with greater confidence in their position. This confidence stems from the understanding that the market's momentum needed to reach and react at the block has been supported by the liquidity sweep.
By combining these elements—trend analysis, liquidity zone identification, and strategic use of order blocks and fair-value gaps—traders can create a cohesive strategy that utilises sweeps to enhance decision-making and potentially improve trading results.
The Bottom Line
Understanding liquidity sweeps offers traders a critical lens through which to view market dynamics, revealing deeper insights into potential price movements. For those looking to apply these insights practically, opening an FXOpen account could be a valuable step towards engaging with the markets more effectively and leveraging professional-grade tools to navigate liquidity phenomena.
FAQs
What Is a Liquidity Sweep?
A liquidity sweep occurs when large market participants activate significant orders within liquidity zones, causing rapid price movements. It's a strategic manoeuvre to capitalise on accumulated buy or sell orders at specific price levels.
What Is a Sweep Trade?
A sweep trade is a large order executed through multiple different areas on a chart and venues to optimise execution. This is common in both equities and derivatives trading to minimise market impact.
How to Spot a Liquidity Sweep?
Liquidity sweeps can be identified by sudden, sharp movements towards areas dense with orders, such as previous swing highs or lows or known support and resistance levels, followed often by a rapid reversal.
What Is the Difference Between a Liquidity Sweep and a Liquidity Grab?
A liquidity sweep is a broader market move activating a large volume of orders across a range of prices. In contrast, a grab is a quick, targeted action to hit specific order levels before the price reverses direction.
This article represents the opinion of the Companies operating under the FXOpen brand only. It is not to be construed as an offer, solicitation, or recommendation with respect to products and services provided by the Companies operating under the FXOpen brand, nor is it to be considered financial advice.

The Power of Commitment in Trading Psychology: A Key to Success
The Power of Commitment in Trading Psychology: A Key to Success 📈💡
Hey TradingView community! I’ve been diving into some trading books lately, and one chapter really hit home: it’s all about commitment. Turns out, it’s the key to making it as a trader—especially in the crypto space where volatility can test your emotions. Here’s what I learned and how I’m applying it to my trading mindset.
Commitment isn’t just about showing up—it’s about promising yourself to be the best trader you can be. I read about a guy who made a ton of money but lost it all because he wasn’t fully in. It made me realize: you can’t just dabble in this game. You gotta go all in. For me, this means sticking to my trading plan, even when the market (or my emotions) tempts me to stray. In crypto, where prices can swing wildly, this is crucial.
One big thing that messes with commitment is the battle between wanting quick wins and sticking to a plan. I’ve caught myself following random advice without thinking—anyone else been there? It’s a trap. Commitment means getting your mind, emotions, and actions on the same page. I’m working on staying disciplined by focusing on my system, even during losing streaks. For example, I use stop-losses and take-profits to keep my emotions in check when trading BTC or ETH.
Here’s a 3-step process I picked up to build commitment:
1️⃣ Figure out what you really want from trading (e.g., steady growth, not just mooning coins).
2️⃣ Spot what’s getting in your way (like fear of losses or FOMO).
3️⃣ Make a plan to push through—like setting clear risk management rules.
For me, this has been a game-changer in staying consistent, especially in volatile markets like crypto.
Psychology matters so much! A lot of traders fail not because their system sucks, but because they can’t stick with it. I’m starting to see how knowing myself better helps me stay committed. Some practical stuff I’m trying: starting small to build confidence, sticking to my system no matter what, learning from experienced traders, and not letting fear of losses throw me off. My current focus is on keeping my position sizes small (1-2% risk per trade) and reviewing my equity curve weekly to ensure I’m on track.
Biggest takeaway: commitment is what makes or breaks you as a trader. It’s about knowing yourself, staying disciplined, and pushing through the tough times. I’m ready to step up—how about you?
What’s your biggest challenge with staying committed in trading?
Let’s discuss in the comments! 👇

Mastering Market Movements: Understanding Impulses and CorrectioHello,
Navigating the stock market successfully isn’t just about luck—it requires a keen understanding of market trends and the ability to spot price patterns. One of the most useful concepts traders rely on is the interplay between impulses and corrections. Recognizing these alternating phases can provide valuable insights into potential price movements, allowing you to make more confident and informed trading decisions.
In this article, we’ll break down what impulses and corrections are, how to identify them, and how you can use them to improve your trading strategy.
Understanding Impulses and Corrections
Stock prices move in cycles, alternating between strong trends (impulses) and temporary retracements (corrections). These movements are driven by market psychology, where shifts in supply and demand dictate price action.
Impulses: The Driving Force of Trends
Impulses are powerful, directional moves in the market that reflect strong momentum. These often occur when sentiment aligns with fundamental catalysts, such as positive news, strong earnings reports, or broader market trends. Impulses are the backbone of trends and can provide great opportunities for traders who know how to recognize them.
To spot impulses, look for:
Strong Price Movement: Impulses are characterized by significant and sustained price shifts, indicating a surge in buying or selling pressure. This is as shown in the
Volume Expansion: When an impulse occurs, trading volume typically increases, confirming that more market participants are involved and supporting the price movement.
Break of Key Resistance or Support Levels: Impulses often push through important technical levels, signaling strength and the continuation of a trend.
Corrections: The Market Taking a Breather
Corrections, also called retracements or pullbacks, are temporary price reversals within an ongoing trend. They provide opportunities for the market to pause before resuming its dominant direction.
To identify corrections, watch for:
Counter-Trend Price Movement: Corrections move against the main trend but usually retrace only a portion (25% to 50%) of the previous impulse.
Lower Volume: Unlike impulses, corrections occur on decreased trading volume, suggesting a temporary decline in market participation.
Support and Resistance Levels: Corrections often find support or resistance at previously established price levels, which can serve as potential reversal zones.
Applying Impulses and Corrections in Trading
Understanding these market phases can significantly improve your trading approach. Here’s how:
Identifying Trends: By observing a sequence of impulses and corrections, you can determine the overall market direction and align your trades accordingly.
Finding Entry and Exit Points: Impulses signal strong trends, while corrections present opportunities to enter trades at better prices before the next move higher or lower.
Managing Risk: Setting stop-loss levels strategically—such as below key support levels during corrections—can help minimize losses while allowing room for potential gains.
Final Thoughts
Recognizing and utilizing impulses and corrections can make a huge difference in your trading success. By learning to identify these patterns, you’ll gain deeper insights into market behavior, improve your timing, and enhance your ability to make smart, strategic moves.
Take a look at the US500FU chart—it clearly illustrates impulses and corrections in action.
Good luck, and happy trading!
Disclosure: I am part of Trade Nation's Influencer program and receive a monthly fee for using their TradingView charts in my analysis.

Vanguard - “We are the invisible hand of Adam Smith” John BogleIf anyone ever thought of erecting a monument to the person who did the most for American investors — the choice would fall on John Bogle. These words are not from a promotional brochure but a quote from Warren Buffett himself.
Book summary
But most people don’t even know who Bogle is. And certainly don’t realize that he didn’t just “create index funds.” He built an invulnerable power machine disguised as client care.
📈 From a thesis to $10 trillion under management
Bogle’s story begins with an ordinary guy born during the Great Depression. Through poverty, scholarship-based education, and working from age 10 — he makes his way into Princeton, where he writes a thesis on a topic that would change the industry: "mutual funds."
Over the years, his philosophy turned into what we now know as "passive investing." From day one, the Vanguard he created operated on the principle: "maximum benefit to the investor, minimum — to the managers." No fees, no speculation, no marketing. And it worked. But here’s the paradox: ▶ Vanguard gave up profit for the mission.
▶ The world responded — investors were tired of the noise.
▶ As a result — "Vanguard grew into a monster capable of managing the economies of entire nations."
🧠 A revolutionary idea: a fund owned by investors
Bogle built a structure where "the fund owners are the investors themselves."
Sounds beautiful: no shareholders, no profit pressure — only long-term client interests. But then who de facto manages these trillions?
⚠️ Vanguard is not a public company.
⚠️ Its shares are not traded.
⚠️ The real ownership mechanism — a black box.
It’s the perfect system for... "invisible control." And this isn’t a conspiracy theory, but logic:
If you can’t find the ultimate beneficiary — it means they’re either too big, or hiding for a reason.
🕸️ The “Big Three” and the invisible hand effect
Vanguard, BlackRock, and State Street — three funds that hold between 3% to 8% of shares in most of the world’s largest corporations. It seems small, but only 15–20% of shares are in free float.
❗ This gives the Big Three “real power”: from voting at meetings to influencing media narratives and climate policy.
📌 They own stakes in CNN, Fox, and Disney.
📌 Invest in oil companies that violate human rights.
📌 And at the same time — push the “green transition” agenda.
Conflict of interest? No. It’s “total control over both sides of the conflict.”
🤫 Why Vanguard is impossible to destroy
If you think Vanguard is just an investment fund, here are a few facts:
🔒 No company shares → can’t buy a controlling stake.
🔒 Over 400 legal entities → can’t file a single lawsuit.
🔒 Every investor essentially becomes a “co-owner” → responsibility is blurred.
🔒 All stakes split below 10% → bypass antitrust laws.
You can’t sue a ghost.
You can’t attack a network if you don’t know where its center is.
🧭 What’s next?
Today, Vanguard manages over $10 trillion, which is more than the GDP of Germany, India, and Brazil combined.
Though the fund’s founder passed away as “the conscience of Wall Street,” his creation became an "architecture of global control" that even the U.S. Federal Reserve couldn’t handle.
🎤 “We are the invisible hand of Adam Smith,” John Bogle once said.
A more detailed book review will follow below. I understand how important this is in our time and I appreciate it.
📘 General Concept of the Book:
The book is at once the autobiography of John Bogle, the story of the founding and development of Vanguard, and a manifesto of index investing philosophy. A runaway waiter, Princeton graduate, and "Wall Street rebel," Bogle creates Vanguard — a company that changed the investment world by making it more fair and accessible.
📑 Structure of the Book:
The book is divided into four parts:
Part I — The History of Vanguard.
Part II — The Evolution of Key Funds.
Part III — The Future of Investment Management.
Part IV — Personal Reflections, Philosophy, and Values of the Author.
💡 Key Ideas of the Book (Introductory Chapters, Preface):
- Index investing is the most important financial innovation of the 20th century.
- Passive management beats active managers in returns and costs.
- Vanguard’s mission is not to make money off investors, but to serve them.
- Criticism of Wall Street: high fees, conflicts of interest, short-term thinking.
- Financial revolution — a mass shift of investors from active to index funds.
🧠 Bogle's Values:
- Long-term thinking. Don’t give in to market “noise.”
- Honesty and transparency in investing.
- Minimal costs = maximum return for the investor.
- Fiduciary duty: protecting the client’s interest comes first.
📗 Part I: The History of Vanguard
🔹 Chapter 1: 1974 — The Prophecy
Context:
John Bogle is in a difficult position — he’s fired as head of Wellington Management Company.
During a trip to Los Angeles, he meets John Lovelace of American Funds, who warns: if you create a truly mutual investment company, you’ll destroy the industry.
Main Idea:
⚡ Bogle decides to go against the profit-driven industry and creates Vanguard — a company owned by investors, not managers.
Key Moments:
- Vanguard is founded in 1974 — in the middle of a crisis.
- The company has no external shareholders — all “profits” are returned to investors through lower fees.
- In 1975, the first index fund for individual investors is launched — a revolutionary idea, initially ridiculed as “Bogle’s madness.”
Important Quotes:
"Gross return before costs is market return. Net return after costs is lower. Therefore, to get the maximum, you must minimize costs."
– Bogle’s fundamental rule
🔹 Chapter 2: 1945–1965 — Background: Blair Academy, Princeton, Fortune, and Wellington
Early Life:
Bogle studies at Blair Academy on a scholarship, works as a waiter.
He enters Princeton. Struggles with his economics course, but…
In the library, he accidentally finds the Fortune article “Big Money in Boston” — about mutual funds.
Turning Point:
This article inspires Bogle to write his thesis:
“The Economic Role of the Investment Company”, where he argues:
- Funds should work for investors;
- Don’t expect them to beat the market;
- Costs must be minimized;
- Fund structure must be fair and transparent.
Career Start:
Work at Wellington Management (Philadelphia).
Starts from scratch, rising from junior analyst to president of the company.
Under Walter Morgan’s leadership, he learns the principles of discipline and serving investors.
✍️ Interim Summary
What’s important from these early chapters:
- Vanguard was born from the ruins of Bogle’s former career — an example of how failure can be the beginning of greatness.
- Already in college, Bogle saw the issue of conflicts of interest in the industry.
- His philosophy is idealism in action: don’t play guessing games — just invest in the market and reduce costs.
📘 Chapter 3: 1965–1974 — Rise and Fall
🚀 Appointed President of Wellington Management:
In 1965, at just 35 years old, John Bogle becomes president of Wellington.
He decides to modernize the business and bring in young star managers from Wall Street, especially from the firm Thorndike, Doran, Paine & Lewis.
⚠️ Risky Alliance:
Bogle makes a fatal mistake — he merges with the new management company without ensuring value alignment.
The new partners are focused on profit and short-term gains, not building a strong long-term foundation.
This leads to internal conflict, loss of trust, and poor fund performance.
💥 Dismissal:
In 1974, after a series of conflicts, the board removes Bogle.
He loses control of the company he built for nearly 25 years.
Bogle’s comment:
"I was fired, but I was still chairman of the Wellington mutual funds — and that turned out to be a lifeline."
📘 Chapter 4: 1974–1975 — The Birth of Vanguard
🧩 A Unique Legal Loophole:
Though Bogle was fired from the management company, he remained head of the Wellington Fund trustees — giving him the opportunity to build a new independent structure.
🛠 Creating Vanguard:
In December 1974, he launches The Vanguard Group — a company owned by the investors (shareholders) themselves.
Model: the fund belongs to the investors → the fund owns the management company → no outside profit, only cost recovery.
⚙️ "Vanguard" as a Symbol:
The name was inspired by Admiral Horatio Nelson’s ship — HMS Vanguard.
A symbol of leadership, courage, and moving against the tide.
Key Idea:
Vanguard would be the only truly mutual investment organization — a model where clients = owners.
📘 Chapter 5: 1975 — The First Index Fund
🤯 Revolution: The Indexing Approach
Bogle decides to create the first index mutual fund for retail investors.
Name: First Index Investment Trust (later — Vanguard 500 Index Fund).
Idea: invest in all S&P 500 stocks to reflect the market’s return instead of trying to beat it.
🪓 A Blow to the Industry:
The financial world reacts harshly:
- “Bogle’s madness”;
- “This is a failure”;
- “Who would want to just match the market?”
🔧 Humble Beginning:
The goal was to raise $150 million, but only $11 million was collected — tiny by industry standards.
But Bogle didn’t give up:
"It was a small step, but with a powerful message."
💡 Summary of Chapters 3–5: How Vanguard Was Built
🔑 Event 💬 Meaning
Loss of control at Wellington ----- Collapse of the old model, beginning of a new path
Creation of Vanguard------------- Innovative, investor-first structure
Launch of index fund--------------Start of the indexing revolution, Bogle’s core philosophy
📝 Quotes for Thought:
"All I did was apply common sense. I just said: Let’s leave the returns to the investors, not the managers." — John Bogle
"This is a business where you get what you don’t pay for. Lower costs = better results." — Bogle’s favorite saying, debunking “more is better”
📘 Chapter 6: 1976–1981 — The Survival Period
⏳ Tough Start:
After launching the index fund, Vanguard faces slow growth and constant skepticism.
For 83 straight months (nearly 7 years!), Vanguard sees net outflows — investors are hesitant to trust this new model.
🧱 Laying the Foundation:
Bogle and his team focus on:
- Transparency
- Lowering costs
- Investor education (they explain what it means to “stay the course”)
💬 The Core Dilemma:
"All investors want to beat the market. But no one wants to pay the price: high fees, taxes, risks. We offered an alternative — reliability, simplicity, and low cost."
📈 Small Wins:
Despite modest volume, Vanguard starts building a reputation as an “honest player.”
It becomes evident: investors using Vanguard achieve better long-term results than those chasing trendy funds.
📘 Chapter 7: 1982–1991 — Growth and Recognition
💡 The Power of Philosophy:
Bogle keeps repeating: “Stay the course” — don’t try to predict the market, don’t fall for fear and greed.
This message becomes especially powerful after the 1982 and 1987 market crises.
🏆 The First Fruits:
A slow but steady increase in assets begins.
Vanguard launches new index funds:
- Total Stock Market Index
- Bond Index
- International Index
📣 Educational Mission:
Bogle writes books, articles, gives interviews.
He isn’t just running a fund — he’s changing how people think about investing.
A community of followers emerges — the Bogleheads.
📊 Key Stats:
By 1991, Vanguard's assets reach around $130 billion.
Index funds begin receiving positive reviews from analysts, including Morningstar.
📘 Chapter 8: 1991–1999 — Industry Leadership
🚀 Explosive Growth:
In the 1990s, index funds go mainstream.
Investors realize that most active funds underperform the market — and they vote with their money for Vanguard.
🧰 Expanding the Product Line:
Vanguard introduces:
- Retirement funds
- Bond funds
- International and balanced funds
- Admiral Shares — low-cost funds for loyal investors
📢 Open Fight with the Industry:
Bogle continues to harshly criticize Wall Street:
- For greed, manipulation, and lack of transparency
- For prioritizing company profit over client interest
"The industry hates Vanguard because it proves you can be honest and still succeed."
⚠️ Internal Challenges:
In the late 1990s, Bogle’s health declines.
He passes leadership to Jack Brennan but retains influence on company strategy.
📊 Midpoint Summary (Chapters 6–8)
📅 Phase 📈 Essence
1976–1981 Quiet survival: building the model, fighting for trust
1982–1991 Slow growth: philosophy attracts investors
1991–1999 Recognition and leadership: indexing becomes dominant
💬 Bogle Quotes from These Chapters:
"Investing is not a business. It’s a service. Those who forget this lose everything."
"Every dollar spent on fees is a dollar lost to your future."
"Volatility is not the enemy. The real enemy is you, if you panic."
📘 Chapter 9: Leadership as a Calling
💡 A Leader ≠ A Manager:
Bogle contrasts a true leader with just an efficient executive.
A real leader:
- Puts others’ interests above their own
- Has a moral compass, not just KPIs
- Makes hard, unpopular decisions
🛤 His Leadership Style:
"Don’t ask others to do what you wouldn’t do yourself."
"Always explain why — people follow meaning, not orders."
He genuinely believes Vanguard should be more than a successful business — it should be a force for good in the market.
"Leadership is loyalty to an idea bigger than yourself."
🔄 Feedback Principle:
Bogle constantly interacts with clients, employees, and journalists.
He never isolates himself in an “ivory tower” — he believes this openness is a leader’s true strength.
📘 Chapter 10: Client Service — Vanguard’s Mission
🧭 The Mission:
"Maximize investor returns — not company profits."
Vanguard is built around fiduciary responsibility: every decision must pass the test — is this in the investor’s best interest or not?
🧾 How It’s Implemented:
- Fees below market average → investors keep more
- No ads for “hot” funds → Vanguard sells stability, not trends
- No sales commissions → no one profits off pushing funds to clients
- Ethical code — “Don’t do anything you wouldn’t want on the front page of the newspaper.”
"We’re not trying to be the best for Wall Street. We’re trying to be the best for you."
📘 Chapter 11: The Market Should Serve Society
📉 Critique of Modern Wall Street:
Bogle argues that finance has drifted from its original purpose.
Investing has turned into trading.
The investor became a cash cow, not a partner.
"The market now serves itself — and we’re still paying the price."
🌱 What the System Should Look Like:
- Companies should serve society
- Investors should be owners, not speculators
- Funds should be transparent, accountable, and honest
📢 Call for Reform:
Bogle calls for a rethinking of finance:
- Restore the human element
- Make mission more important than profit
- Protect long-term interests of millions of ordinary investors
"If we want capitalism with a human face, we must return finance to serving society."
📊 Summary of Chapters 9–11: Bogle's Philosophy
📌 Direction------------💬 Essence
Leadership-------------Morality, leading by example, purpose-driven
Business---------------First and foremost — service to the client
Financial System-------Must work for society, not just for profit of the few
✨ Inspirational Quotes:
"The most important thing you can invest is not money — it’s your conscience."
"Honesty in business is not a competitive edge. It’s a duty."
"I’m not against capitalism. I’m against capitalism without morals."
📘 Chapter 12: The Future of Investing — Where the Industry Is Headed
🌐 Bogle sees three main trends:
Victory of Passive Investing:
- Index funds continue to displace active management
- Their share of assets under management is growing rapidly
- More investors are realizing the power of simplicity
Fee Pressure:
- Fees are approaching zero (some funds are effectively free)
- Winners: investors. Losers: traditional management companies
The Role of Technology:
- Rise of robo-advisors (automated investment advisors)
- But Bogle warns: Technology without philosophy is just a tool, not a solution
🚨 Threat #1 — Hyperfinancialization:
"The market is turning into a casino. And the fewer the players, the more the house wins."
Bogle reminds us: the goal of investing is owning businesses — not gambling.
The higher the turnover, the more you lose on fees and taxes.
📘 Chapter 13: The Power of Indexing — Threat or Blessing?
📈 Strength in Scale:
The biggest index providers (Vanguard, BlackRock, State Street) own large shares in nearly all companies in the indexes.
This raises the issue of concentrated power — is too much influence in too few hands?
⚖️ The Indexing Paradox:
Index funds don’t actively vote on corporate governance issues.
So the more power they hold, the less oversight there is over company management.
📣 Bogle’s Proposals:
- Establish a code of conduct for index providers
- Require them to vote in investors’ interests
- Mandate transparency in how they use their voting power
"We fought for the democratization of investing. We cannot let it end in a new monarchy."
📘 Chapter 14: Personal Reflections — On Life, Mission, and Faith
🧬 Personal and Eternal:
Bogle shares his core life principles:
- To serve, not to own
- To leave a mark, not accumulate
- To do what’s right, not what’s profitable
He talks about his battle with heart disease — both as a personal journey and a metaphor for resisting the system.
🙏 Gratitude:
He dedicates the book to his family, colleagues, and investors.
Emphasizes: every day is a chance to be useful.
"I created Vanguard, but Vanguard created me. My career isn’t a triumph — it’s a thank you to fate for the chance to be heard."
📊 Summary of Chapters 12–14: Looking Ahead and Within
📌 Theme-----------------💬 Essence
Future of Investing---------Indexing is the new standard, but needs responsible stewardship
Concentration of Power----Index giants must be accountable to society
Personal Legacy-----------Life is about service, honesty, and setting an example
💬 Final Inspirational Quotes:
"Life isn’t about making more money. It’s about doing more good."
"One day, someone will say: ‘Bogle was stubborn. He never compromised his conscience.’ That will be the best reward."
🧩 Bogle’s Principle Summary (from the book):
- Lower costs — pay less = keep more
- Don’t chase returns — be realistic
- Be a long-term investor — ignore market noise
- Invest broadly, passively, regularly
- Don’t try to beat the market — own the market
- Focus on goals, not trends
- Finance = service. Not a business for profit
💡 Investment Philosophy
🟨 “This is a business where you get what you don’t pay for.”
🟨 “Don’t try to beat the market. Just own it.”
🟨 “In the stock market, investors are rewarded for patience and punished for frenzy.”
🟨 “Gross return minus costs = market return. After costs — less. So: reduce costs — and you win.”
🟨 “The problem isn’t that investors know too little. The problem is they know too much of what doesn’t matter.”
🧭 Principles & Morality
🟩 “Investing is not a business. It’s a service.”
🟩 “Honesty isn’t a strategy. It’s an obligation.”
🟩 “The goal of Vanguard isn’t to make more, but to return to the investor what’s rightfully theirs.”
🟩 “If your investments keep you up at night, change them. Or better — change yourself.”
🧠 On Leadership and Mission
🔷 “A leader isn’t the one in front. It’s the one responsible for the rest.”
🔷 “Respect isn’t bought. It’s earned when you do what’s right, even if it’s unpopular.”
🔷 “We didn’t build Vanguard for glory. We built it to leave something better than what was.”
💬 On the Market and Industry
🔴 “Today's stock market isn’t a place for investors. It’s a casino with a shiny sign.”
🔴 “We’re not against capital. We’re against capitalism without a conscience.”
🔴 “The people selling investments always say they can pick the best. But what if the best is just paying less?”
❤️ On Life and Legacy
💠 “I created Vanguard, but Vanguard created me. It’s not my victory — it’s gratitude for the chance to serve.”
💠 “Every day is a chance to do something not for yourself.”
💠 “You can measure success with money. Or with a conscience, you don’t have to justify.”
It was a lot of work!
Click to like + Write in the comments your favorite books about the financial market
Best regards, EXCAVO
_____________________
Disclosure: I am part of Trade Nation's Influencer program and receive a monthly fee for using their TradingView charts in my analysis.

ETFs vs Mutual Funds: Differences and Advantages ETFs vs Mutual Funds: Differences and Advantages
Exchange-traded funds (ETFs) and mutual funds are two of the most popular investment options, each offering unique features and advantages. While both provide access to diversified portfolios, their differences in structure, management, and trading make them suitable for different strategies. This article breaks down the key distinctions between exchange-traded funds vs mutual funds and how to choose between them.
What Are ETFs?
Exchange-traded funds, or ETFs, are investment vehicles that allow traders to access a diverse range of assets through a single product. An ETF is essentially a basket of investments—such as stocks, bonds, or commodities—that typically tracks the performance of an index, sector, or specific theme. For example, SPDR S&P 500 ETF Trust (SPY) follows the S&P 500 index, providing exposure to the largest companies listed on US stock exchanges.
What sets ETFs apart is how they’re traded. Unlike mutual funds, which are only bought or sold at the end of the trading day, ETFs trade on stock exchanges throughout the day, just like individual shares. This means their prices fluctuate as demand and supply change, giving traders the flexibility to enter or exit positions at market prices.
ETFs are known for their cost-effectiveness, as most are passively managed to mirror the performance of an index rather than exceed it. This passive structure usually leads to lower management fees compared to actively managed funds. Additionally, ETFs are often transparent, with their holdings disclosed daily, so investors know exactly what they’re buying.
ETFs come in various types, from those focused on specific sectors, like technology or healthcare, to broader options covering entire economies or bond markets. This variety makes them a popular choice for traders and investors looking to diversify or target specific market opportunities.
What Are Mutual Funds?
Mutual funds are investment products that pool money from multiple investors to create a diversified portfolio, typically managed by a professional fund manager. These funds invest in a wide range of assets, including stocks, bonds, and other securities, depending on the fund’s objective. For instance, an equity mutual fund focuses on stocks, while a bond fund invests primarily in fixed-income securities.
One defining feature of mutual funds is their pricing. Unlike ETFs, mutual funds aren’t traded on stock exchanges. Instead, they are bought and sold at the fund’s net asset value (NAV), which is calculated at the end of each trading day. This makes them more suited to long-term investment strategies.
Mutual funds often appeal to investors looking for a hands-off approach. The fund manager handles the selection and management of assets, aiming to achieve the fund’s stated goals—whether that’s generating income, preserving capital, or achieving long-term growth.
However, this active management comes with higher fees compared to ETFs. These costs include management fees and sometimes additional charges like entry or exit loads, which can eat into returns over time.
Mutual funds also often require a minimum investment, making them less accessible for some investors. That said, they offer a wide variety of options, from sector-specific funds to diversified portfolios, providing flexibility for different investment goals and risk preferences.
Are There Differences Between an ETF and a Mutual Fund?
ETFs and mutual funds share similarities—they both allow investors to pool money into diversified portfolios. However, the differences between ETFs and mutual funds can significantly impact which one is better suited to an investor’s goals.
Trading and Pricing
ETFs are traded on stock exchanges continuously during market hours, similar to individual shares. Price fluctuations are based on market demand and supply. In contrast, mutual funds are priced only once per day after the market closes, based on the fund’s net asset value (NAV). This makes ETFs more appealing for those seeking flexibility and the ability to react to market movements, while mutual funds cater to long-term investors less concerned with intraday price changes.
Management Style
ETFs are mostly passively managed, designed to track the performance of a specific index, sector, or asset class. Mutual funds, on the other hand, often feature active management. This involves fund managers selecting assets to outperform the market, which can offer potential opportunities for higher returns but also comes with increased costs.
Fees and Costs
ETFs typically come with a lower expense ratio compared to mutual funds, making them more cost-efficient. This is due to their passive management approach and lower operational costs. Mutual funds may charge higher fees to cover active management and administrative expenses. Additionally, mutual funds may have extra costs like sales charges or redemption fees, whereas ETFs incur standard brokerage commissions.
Liquidity
When considering mutual funds versus ETFs, liquidity becomes a critical factor, as ETF prices change intraday, while mutual funds are limited to end-of-day pricing. This difference can influence how quickly you can access your funds.
Tax Efficiency
ETFs tend to be more tax-efficient because of their structure. When investors sell ETF shares, transactions occur directly between buyers and sellers on the exchange, limiting taxable events. In mutual funds, redemptions often require the fund manager to sell securities, which can result in capital gains distributed to all investors in the fund.
Minimum Investment
Mutual funds often require a minimum initial investment, which can range from a few hundred to thousands of dollars. ETFs, however, don’t have such requirements—traders can purchase as little as a single share, making them more accessible for those with smaller starting capital.
ETF CFD Trading
ETF CFD trading offers a flexible way for traders to speculate on the price movements of exchange-traded funds without the need to buy them on stock exchanges. CFDs, or Contracts for Difference, are derivative products that track the price of an ETF, allowing traders to take positions on whether the price will rise or fall. This approach is particularly appealing for short-term speculation, making it a useful complement to traditional long-term ETF or mutual fund investing.
Flexibility
One of the standout features of ETF CFDs is their flexibility. Unlike investing directly in ETFs, CFD trading enables you to capitalise on price fluctuations without owning ETF shares. Traders can go long if they anticipate a rise in the ETF’s value or short if they expect a decline. This ability to trade in both directions can potentially create opportunities in both bullish and bearish markets. Moreover, CFDs allow for trading over shorter timeframes like 1-minute or 5-minute charts, providing potential opportunities for scalpers and day traders.
Leverage
Leverage is another significant feature of ETF CFDs. With leverage, traders can gain larger exposure to an ETF’s price movements with smaller initial capital. For example, using 5:1 leverage, a $1,000 position would control $5,000 worth of ETF exposure. However, you should remember that while this magnifies potential returns, losses are also amplified, making risk management a critical component of trading CFD products.
Costs
Actively managed ETFs can charge expense ratios to cover management and operational costs. CFDs eliminate these fees, as traders don’t directly invest in the ETF’s assets. However, both ETF investing and ETF CFD trading include brokerage fees or spreads.
Wider Range of Markets
With CFDs, traders can access a variety of global ETF markets through a single platform. This reduces the need to open accounts in different jurisdictions, saving on administrative and currency conversion costs.
CFD trading is popular among traders who want to take advantage of short-term price movements, diversify their strategies, or access ETF markets straightforwardly. While traditional ETFs are often favoured for long-term growth, ETF CFDs provide an active, fast-paced alternative for traders looking to react quickly to market changes.
Use Cases for ETFs and Mutual Funds
In comparing ETFs vs mutual funds, it’s important to recognise their use cases based on an investor’s goals, strategies, and time horizons.
ETFs
ETFs are used by investors seeking flexibility and real-time market engagement. They are attractive for those who want to take advantage of price movements or actively manage their portfolios. For example, an investor might focus on sector-specific ETFs, like technology or energy, to capitalise on industry trends. ETFs also offer a lower-cost option for diversification, making them useful for those building broad exposure across markets without significant capital.
Additionally, ETFs may be effective for hedging. An investor with exposure to a specific market segment can use an ETF to potentially offset risks, especially in volatile markets. For instance, during an anticipated downturn in equities, an inverse ETF could be used to possibly mitigate losses.
Mutual Funds
Mutual funds are popular among long-term investors prioritising professional management. Their hands-off approach makes them appealing to individuals who prefer not to monitor markets daily. For instance, someone saving for retirement might opt for a diversified mutual fund that balances risk and growth over time.
Mutual funds are also advantageous for accessing specialised strategies, such as actively managed funds focusing on niche markets or themes. While they typically involve higher fees, the tailored management can align with specific financial objectives.
Factors for Choosing Between ETFs and Mutual Funds
Selecting between mutual funds vs ETF options depends on an investor’s financial goals, trading style, and the level of involvement they are comfortable with in managing their investments.
- Time Horizon: ETFs are popular among short- to medium-term investors and traders who prefer flexibility and the ability to follow intraday price movement. Mutual funds, on the other hand, are mostly used by long-term investors focused on gradual growth or income over time.
- Cost Sensitivity: ETFs generally have lower expense ratios and no minimum investment requirements, making them cost-efficient. Mutual funds often involve higher management fees and, in some cases, additional charges like entry or exit fees, which can add up over time.
- Active vs Passive Management: If you’re looking for a hands-off approach with professional oversight, actively managed mutual funds might be more appealing. However, if you prefer to track indices or specific sectors at a lower cost, ETFs might be more suitable.
- Liquidity Needs: Investors who need quick access to their capital often prefer ETFs because they can be traded throughout the day. Mutual funds lack this intraday liquidity, as transactions are only processed at the trading day’s end.
The Bottom Line
Understanding the differences between mutual funds vs exchange-traded funds is crucial for selecting the right investment approach. ETFs offer flexibility and cost-efficiency, while mutual funds are popular among long-term investors seeking professional management. For those interested in ETF CFD trading, which allows traders trade in rising and falling markets, opening an FXOpen account provides access to a diverse range of ETF markets alongside competitive trading conditions.
FAQ
What Is an ETF vs Mutual Fund?
An ETF is a fund traded on stock exchanges, offering intraday liquidity and lower fees, typically tracking an index or sector. A mutual fund pools investor money for professional management, priced once at the end of a trading day at its net asset value per share.
Mutual Funds and ETFs: Differences
ETFs trade like stocks, are generally more cost-efficient, and offer intraday liquidity. Mutual funds are actively managed, have higher fees, and are designed for long-term investing with end-of-day pricing.
Is the S&P 500 an ETF or a Mutual Fund?
The S&P 500 itself is an index, not a fund. However, it can be tracked by both ETFs (like SPDR S&P 500 ETF) and mutual funds, offering similar exposure but with differing management styles and fee structures.
This article represents the opinion of the Companies operating under the FXOpen brand only. It is not to be construed as an offer, solicitation, or recommendation with respect to products and services provided by the Companies operating under the FXOpen brand, nor is it to be considered financial advice.

What is a Swing Failure Pattern? - Basic explanation!A Swing Failure Pattern (SFP) is a technical chart pattern often used in price action trading to identify potential reversals in the market. It is typically seen on candlestick or bar charts in the context of trend analysis.
The basic idea behind a Swing Failure Pattern is that the price temporarily breaks above or below a previous swing high or low, but fails to sustain that move and reverses direction quickly. This indicates a potential shift in market sentiment, and it can be a signal for a trend reversal or breakdown.
When is it a SFP?
- In needs to sweep the previous low
- It has to close the candlestick above the previous low. So only a wick down When the price closes the body of a candle below the last low, it will not be considered an SFP. In this case, it is highly likely that the trend will continue in that direction.
The SFP can occur across various timeframes, from lower to higher timeframes.
Example on the daily timeframe
Here, we see two SFPs: one to the upside and one to the downside.
Thanks for your support.
- Make sure to follow me so you don't miss out on the next analysis!
- Drop a like and leave a comment!

Using Bands to define the stages according to WeinsteinAlways hard to see which stage a stock is in. This is a tentative way to define it

Power of trendline + support/resistanceI would like to show the power of combining trendlines and support & resistance on your chart work. As we all know in order for a trendline to be effective it must be used with key major points and the trend must be clear whether it's an uptrend or downtrend, cause if the trend is neither then that would lead to false signals that would cause people to get stopped out.
If used with S&R it can give us way better entries and more accurate with high probability of winning, We all know if for example an Uptrend trendline is broken then that would mean we have sellers active and that means the trend will go down, however that is not entirely true if it was then we would all be millionaires lol. So in order to fix this and know for sure the trend is changing for real we need to combine both our Trendlines and S&R, as you can see from the chart our uptrend trendline was broken and those who entered immediately after the breakout would have been trapped by professional traders when the price pulled back to their entry points, but to avoid this and get a much better entry that has high accuracy like mine you would also need to use your "visible" support and resistance.
As the uptrend line was broken that gave us a sign sellers are active and might push the price down but that is not enough confirmation to sell, unless you want to make a loss obviously💀,If you noticed I also marked my Visible Support(CHANGE OF TREND), since this is the lowest point in the uptrend then we know if price breaks below it then it's a clear confirmation that sellers will overpower buyers and push the price down, our first confirmation was Price breaking the uptrend(not enough to sell), our second powerful confirmation was price breaking below the CHANGE OF TREND, now this shows that bears overpowered bulls causing a CHANGE OF TREND and a much higher winning probability and a much better R:R.
I know most people would see this as a late entry, but it's not trust me there's no better entry you can get better than this that has higher chance of winning and a better R:R also less risky. Most people chase the trend instead of waiting for the trend to come to them, that's also why they make many losses because they enter with few confirmations that have low probability

Gann Trading Strategy: Understanding Gann Price CyclesGann Trading Strategy: Understanding Gann Price Cycles.
Gann Trading Strategy with a deep dive into Gann Price Cycles and candle range averaging to forecast upcoming highs and lows. Learn how to apply Gann's time and price principles, predict market turning points, and enhance your trading accuracy.
Gann Price Cycles: Understanding Market Movements with Precision
- Gann Price Cycles are a fundamental concept in W.D. Gann's trading methodology, used to predict market highs and lows based on historical price movements and time cycles. Gann believed that markets move in predictable cycles, influenced by both price and time relationships. By studying these cycles, traders can anticipate future turning points with greater accuracy.
Key Principles of Gann Price Cycles:
1. Repeating Market Patterns – Price movements follow specific cyclical patterns that repeat over time. Identifying these patterns helps traders forecast future price swings.
2. Time and Price Symmetry – Gann emphasized that time and price must be in balance. When a market completes a significant time cycle, it often results in a reversal or acceleration of trend.
3. Natural Market Rhythms – Just like planetary cycles, financial markets move through predictable 360-degree price cycles, based on Gann’s Square of Nine and Gann Angles.
4. Averaging Price Ranges – By analyzing historical price ranges and averaging them, traders can estimate the next high or low in the market.

Repaying the Italian debt in 40 years. The method.
Hello, I am Trader Andrea Russo and today I want to talk to you about an ambitious, innovative and potentially revolutionary idea for the management of the Italian public debt. A strategy that, in theory, could heal the enormous accumulated debt and bring Italy to a stronger and more stable financial position. Let's find out together how it could work.
The basic idea
Italy, with a public debt that amounts to about 2,900 billion euros, pays 70 billion euros in interest annually to its creditors. However, imagine an alternative scenario in which those 70 billion, instead of being paid for the payment of interest, are invested in index funds with an estimated average annual return of 10%. Furthermore, the profits generated would be reinvested annually. It is a solution that is based on the power of compound interest.
From the second year, Italy would also have the 70 billion euros available annually no longer tied to the payment of interest. These funds could be used in strategic ways to support economic recovery.
Agreements with creditors
To make this proposal feasible, Italy would have to negotiate an agreement with creditors. The agreement would include a temporary suspension of interest payments, with the promise that the State will repay the entire debt within 40 years, also guaranteeing a compensatory interest of 10% as a "disturbance".
This implies that creditors must accept a long-term vision, trusting in the profitability of investments and the ability of the Italian State to honor the final commitment.
Simulation: how it could work
If the 70 billion were invested from the first year in index funds with an average annual return of 10%, the capital would grow exponentially thanks to compound interest. Over 40 years, the investment would accumulate over 3,241 billion euros, a sum sufficient to repay the public debt of 2,900 billion and to provide a surplus to satisfy the extra interest promised to creditors.
Meanwhile, from the second year, Italy would have at its disposal the 70 billion annually previously earmarked for interest payments. Over 40 years, this figure would represent a total of 2,800 billion euros, which could be used to:
Strengthen strategic infrastructure in the transport, energy and digital sectors.
Reduce the tax burden and encourage economic growth.
Improve social services, such as healthcare, welfare and education.
Further reduce the residual debt, strengthening the country's financial stability.
Conclusion
With this strategy, Italy would not only repay its public debt, but would also start an unprecedented phase of economic recovery. The combination of compound interest and the reallocation of freed funds represents an innovative vision to solve one of the main economic challenges of our time.
However, the implementation of such an ambitious plan would require financial discipline, political stability and careful management of investments. Furthermore, it would be essential to negotiate a transparent and advantageous agreement with creditors, ensuring trust and credibility in international markets.
Whether this is a utopia or a real opportunity will depend on the ability to imagine and adopt bold solutions for the good of the country.

Decoding Fed Rate Changes via Federal Funds Futures Index◉ What Are Federal Funds Futures?
● Definition: Federal Funds Futures are financial contracts traded on the Chicago Mercantile Exchange (CME) that allow market participants to bet on or hedge against future changes in the federal funds rate (the interest rate at which banks lend to each other overnight).
● Purpose: These futures reflect the market's expectations of where the Fed will set interest rates in the future.
◉ How Federal Funds Futures Work?
● Pricing: The price of a federal funds futures contract is calculated as 100 minus the expected average federal funds rate for the contract month.
➖ Example: If the futures price is 95.00, it implies an expected federal funds rate of 5.00% (100 - 95 = 5).
● Contract Expiry: Each contract represents the market's expectation of the average federal funds rate for a specific month.
◉ Why Use Federal Funds Futures?
● Predict Fed Policy: Traders and investors use these futures to gauge the likelihood of the Fed raising, cutting, or holding interest rates.
● Hedge Risk: Institutions use them to protect against potential losses caused by interest rate changes.
● Market Sentiment: They provide insight into what the broader market expects from the Fed.
◉ Steps to Analyze Fed Policy Using Federal Funds Futures
● Step 1: Check Current Federal Funds Futures Prices
Look up the prices of federal funds futures contracts for the months you're interested in. These are available on financial platforms like Bloomberg, Reuters, or the CME Group website.
● Step 2: Calculate the Implied Federal Funds Rate
Implied Federal Funds Rate = 100 - Futures Price.
➖ Example: If the futures price for March is 95.5, the implied rate is 4.5% (100 - 95.5 = 4.5).
● Step 3: Compare Implied Rates to the Current Rate
If the implied rate is higher than the current federal funds rate, the market expects the Fed to raise rates. If it's lower, the market expects a rate cut.
● Step 4: Estimate the Probability of Rate Changes
By comparing the implied rates of contracts expiring before and after an FOMC meeting, you can estimate the probability of a rate change.
➖ Example: If the implied rate for March is 4.75% and the current rate is 4.5%, the market is pricing in a 25 basis point (0.25%) hike.
● Step 5: Monitor Changes Over Time
Track how futures prices change over time. Shifts in prices indicate changes in market expectations. For example, if futures prices drop (implying higher rates), it suggests the market is anticipating a more hawkish Fed.
◉ Practical Applications
● Trading: Traders use federal funds futures to speculate on interest rate movements.
● Economic Forecasting: Economists use them to predict the Fed's monetary policy and its impact on the economy.
● Investment Strategy: Investors adjust their portfolios based on expected rate changes (e.g., shifting from bonds to equities if rates are expected to rise).
◉ Limitations of Federal Funds Futures
● Market Sentiment: Futures prices reflect market expectations, which can be influenced by sentiment and may not always accurately predict Fed actions.
● External Shocks: Unexpected events (e.g., geopolitical crisis, pandemics) can disrupt rate expectations.
● Liquidity: Less liquid contracts (further out in time) may not accurately reflect expectations.
◉ Example Analysis
Let’s assume:
➖ Current federal funds rate: 4.5%
➖ March federal funds futures price: 95.5
● Step 1: Calculate the implied rate:
100 − 95.5 = 4.5%.
● Step 2: Compare to the current rate:
The implied rate (4.5%) is equal to the current rate (4.5%), suggesting the market expects no change in rates by March.
● Step 3:
If the futures price drops to 95.25, the implied rate becomes 4.75%, indicating the market now expects a 25 basis point rate hike..
◉ Why This Matters?
● For Traders: Federal funds futures provide a direct way to bet on or hedge against interest rate changes.
● For Investors: Understanding rate expectations helps in making informed decisions about asset allocation.
● For Economists: These futures offer valuable insights into market expectations of monetary policy.
◉ Conclusion
Federal funds futures are a powerful tool for analyzing and predicting the Fed's interest rate decisions. By understanding how to interpret these futures, traders, investors, and economists can gain valuable insights into market expectations and make more informed decisions. However, it's important to consider their limitations and use them in conjunction with other economic indicators for a comprehensive analysis.
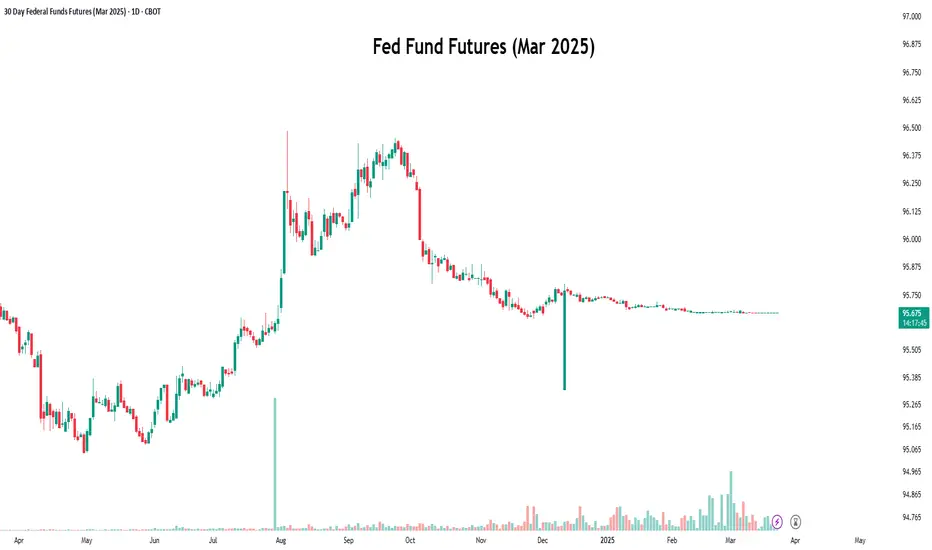
Behind the Curtain The Economic Pulse Behind Euro FX1. Introduction
Euro FX Futures (6E), traded on the CME, offer traders exposure to the euro-dollar exchange rate with precision, liquidity, and leverage. Whether hedging European currency risk or speculating on macro shifts, Euro FX contracts remain a vital component of global currency markets.
But what truly moves the euro? Beyond central bank meetings and headlines, the euro reacts sharply to macroeconomic data that signals growth, inflation, or risk appetite. Using a Random Forest Regressor, we explored how economic indicators correlate with Euro FX Futures returns across different timeframes.
In this article, we uncover which metrics drive the euro daily, weekly, and monthly, offering traders a structured, data-backed approach to navigating the Euro FX landscape.
2. Understanding Euro FX Futures Contracts
The CME offers two primary Euro FX Futures products:
o Standard Euro FX Futures (6E):
Contract Size: 125,000 €
Tick Size: 0.000050 per euro = $6.25 per tick per contract
Trading Hours: Nearly 24 hours, Sunday to Friday (US)
o Micro Euro FX Futures (M6E):
Contract Size: 12,500 € (1/10th the size of 6E)
Tick Size: 0.0001 per euro = $1.25 per tick per contract
Accessible to: Smaller accounts, strategy testers, and traders managing precise exposure
o Margins:
6E Initial Margin: ≈ $2,600 per contract (subject to volatility)
M6E Initial Margin: ≈ $260 per contract
Whether trading full-size or micro contracts, Euro FX Futures offer capital-efficient access to one of the most liquid currency pairs globally. Traders benefit from leverage, scalability, and transparent pricing, with the ability to hedge or speculate on Euro FX trends across timeframes.
3. Daily Timeframe: Key Economic Indicators
For day traders, short-term price action in the euro often hinges on rapidly released data that affects market sentiment and intraday flow. According to machine learning results, the top 3 daily drivers are:
Housing Starts: Surging housing starts in the U.S. can signal economic strength and pressure the euro via stronger USD flows. Conversely, weaker construction activity may weaken the dollar and support the euro.
Consumer Sentiment Index: A sentiment-driven metric that reflects household confidence. Optimistic consumers suggest robust consumption and a firm dollar, while pessimism may favor EUR strength on defensive rotation.
Housing Price Index (HPI): Rising home prices can stoke inflation fears and central bank hawkishness, affecting yield differentials between the euro and the dollar. HPI moves often spark short-term FX volatility.
4. Weekly Timeframe: Key Economic Indicators
Swing traders looking for trends spanning several sessions often lean on energy prices and labor data. Weekly insights from our Random Forest model show these three indicators as top drivers:
WTI Crude Oil Prices: Oil prices affect global inflation and trade dynamics. Rising WTI can fuel EUR strength if it leads to USD weakness via inflation concerns or reduced real yields.
Continuing Jobless Claims: An uptick in claims may suggest softening labor conditions in the U.S., potentially bullish for EUR as it implies slower Fed tightening or economic strain.
Brent Crude Oil Prices: As the global benchmark, Brent’s influence on inflation and trade flows is significant. Sustained Brent rallies could create euro tailwinds through weakening dollar momentum.
5. Monthly Timeframe: Key Economic Indicators
Position traders and institutional participants often focus on macroeconomic indicators with structural weight—those that influence monetary policy direction, capital flow, and long-term sentiment. The following three monthly indicators emerged as dominant forces shaping Euro FX Futures:
Industrial Production: A cornerstone of economic output, rising industrial production reflects strong manufacturing activity. Strong U.S. numbers can support the dollar, while a slowdown may benefit the euro. Likewise, weaker European output could undermine EUR demand.
Velocity of Money (M2): This metric reveals how quickly money is circulating in the economy. A rising M2 velocity suggests increased spending and inflationary pressures—potentially positive for the dollar and negative for the euro. Falling velocity signals stagnation and may shift flows into the euro as a lower-yield alternative.
Initial Jobless Claims: While often viewed weekly, the monthly average could reveal structural labor market resilience. A rising trend may weaken the dollar, reinforcing EUR gains as expectations for interest rate cuts grow.
6. Strategy Alignment by Trading Style
Each indicator offers unique insights depending on your approach to market participation:
Day Traders: Focus on the immediacy of daily indicators like Housing Starts, Consumer Sentiment, and Housing Price Index.
Swing Traders: Leverage weekly indicators like Crude Oil Prices and Continuing Claims to ride mid-term moves.
Position Traders: Watch longer-term data such as Industrial Production and M2 Velocity.
7. Risk Management
Currency futures provide access to high leverage and broad macro exposure. With that comes responsibility. Traders must actively manage position sizing, volatility exposure, and stop placement.
Economic indicators inform price movement probabilities—not certainties—making risk protocols just as essential as trade entries.
8. Conclusion
Euro FX Futures are shaped by a deep web of macroeconomic forces. From Consumer Sentiment and Oil Prices to Industrial Production and Money Velocity, each indicator tells part of the story behind Euro FX movement.
Thanks to machine learning, we’ve spotlighted the most impactful data across timeframes, offering traders a framework to align their approach with the heartbeat of the market.
As we continue the "Behind the Curtain" series, stay tuned for future editions uncovering the hidden economic forces behind other major futures markets.
When charting futures, the data provided could be delayed. Traders working with the ticker symbols discussed in this idea may prefer to use CME Group real-time data plan on TradingView: www.tradingview.com - This consideration is particularly important for shorter-term traders, whereas it may be less critical for those focused on longer-term trading strategies.
General Disclaimer:
The trade ideas presented herein are solely for illustrative purposes forming a part of a case study intended to demonstrate key principles in risk management within the context of the specific market scenarios discussed. These ideas are not to be interpreted as investment recommendations or financial advice. They do not endorse or promote any specific trading strategies, financial products, or services. The information provided is based on data believed to be reliable; however, its accuracy or completeness cannot be guaranteed. Trading in financial markets involves risks, including the potential loss of principal. Each individual should conduct their own research and consult with professional financial advisors before making any investment decisions. The author or publisher of this content bears no responsibility for any actions taken based on the information provided or for any resultant financial or other losses.

How to Trade Descending Channels Like a Pro!
🚀 TRON (TRX) is stuck in a descending channel! But how can you trade this setup effectively? Let’s break it down:
📌 What is a Descending Channel?
A descending channel forms when price makes lower highs and lower lows, staying between two parallel trendlines. It shows a downtrend, but it also creates trading opportunities!
🔥 How to Trade It?
✅ Breakout Strategy: If price breaks above the channel and retests, it could signal a bullish move! (Potential target: $0.29)
✅ Breakdown Strategy: If price drops below the key level, it might dump to the next support ($0.19).
✅ Mid-Range Trades: You can short at resistance and long at support inside the channel – but only with strong confirmations!
💡 Pro Tip: Always wait for confirmation candles before entering a trade to avoid false breakouts!
📊 What do you think? Will TRX break out or dump? Comment below! 👇👇
🔄 Tag a trader who needs to learn this! 🚀 #CryptoEducation #TradingTips #TRX #TradingView
#Miracle #TradeWithMky #MegaAltseason 2025

Trading Is Not Gambling: Become A Better Trader Part III'm so thankful the admins at Tradingview selected my first Trading Is Not Gambling video for their Editor's Pick section. What an honor.
I put together this video to try to teach all the new followers how to use analysis to try to plan trade actions and to attempt to minimize risks.
Within this video, I try to teach you to explore the best opportunities based on strong research/analysis skills and to learn to wait for the best opportunities for profits.
Trading is very similar to hunting or trying to hit a baseball... you have to WAIT for the best opportunity, then make a decision on how to execute for the best results.
Trust me, if trading was easy, everyone would be making millions and no one would be trying to find the best trade solutions.
In my opinion, the best solution is to learn the skills to try to develop the best consistent outcomes. And that is what I'm trying to teach you in this video.
I look forward to your comments and suggestions.
Get some.
#trading #research #investing #tradingalgos #tradingsignals #cycles #fibonacci #elliotwave #modelingsystems #stocks #bitcoin #btcusd #cryptos #spy #gold #nq #investing #trading #spytrading #spymarket #tradingmarket #stockmarket #silver

Let's Explore Swing Trading !Hello, Trading Community!
I'm excited to share my 100th publication with you all! Grateful for the support and learning from this journey. To mark this milestone, I’m sharing an educational post on Swing Trading—hope it adds value to your trading.
Thank you for being a part of this! Let’s keep growing together.
Happy trading!
Introduction-:
Swing trading is a powerful trading strategy that allows traders to capture market fluctuations over a period of several days to weeks. Unlike day trading, which requires constant monitoring of charts, swing trading enables traders to take advantage of medium-term price movements without being glued to the screen all day.
This guide explores the fundamentals of swing trading, key indicators, strategies, risk management, and common mistakes traders should avoid. By the end of this article, you’ll have a solid foundation to approach swing trading effectively and improve your trading success.
Have you ever wondered how professional traders capitalize on market swings without constantly watching the charts? Let's break it down.
🔹What is Swing Trading-:
Swing trading is a trading style that focuses on capturing short- to medium-term price movements in financial markets. Traders hold positions for several days or weeks, aiming to profit from price swings within a trend.
Unlike day traders, who enter and exit positions within the same day, or long-term investors who hold assets for months or years, swing traders take advantage of short-term fluctuations while aligning with the broader trend.
A key principle in swing trading is identifying trends and trading in their direction. For instance, in an uptrend, a trader looks for pullbacks to enter at a favorable price, while in a downtrend, they may look for rallies to enter short positions.
A well-structured chart example showing an uptrend with higher highs and higher lows can help illustrate this concept effectively.
🔹Key Indicators and Tools for Swing Trading-:
Swing traders rely on technical analysis to find high-probability trade setups. Some of the most commonly used indicators and tools include:
1. Moving Averages (50 & 200 EMA) – Helps identify the overall trend. A price above the 50-day EMA indicates an uptrend, while a price below suggests a downtrend.
2. Relative Strength Index (RSI) & MACD – Used for entry confirmation. RSI helps identify overbought and oversold conditions, while MACD provides trend direction and momentum shifts.
3. Fibonacci Retracement – Useful for identifying pullback levels within a trend. Traders use Fibonacci levels (38.2%, 50%, 61.8%) to anticipate where price might find support or resistance.
4. Support and Resistance Levels – Key price areas where reversals or consolidations often occur. Identifying these levels helps traders find entry and exit points.
A well-annotated chart with these indicators applied can illustrate their importance in real trading scenarios.
🔹Swing Trading Strategies with Examples-:
Trend-Following Swing Trading
This strategy involves entering trades in the direction of the prevailing trend.
Traders wait for pullbacks to enter a position rather than buying at the peak.
Moving averages and RSI are commonly used to confirm the trend and entry points.
Example: A stock in an uptrend retracing to the 50-day moving average with RSI bouncing from the 40 level can be an ideal entry point.
🔹Breakout Swing Trading-:
This strategy focuses on trading breakouts from consolidation patterns such as triangles, flags, and channels.
Traders use volume and MACD to confirm the breakout’s strength before entering.
Example: A stock breaking out from a flag pattern with increased volume signals a strong continuation. A stop-loss is placed below the breakout level to manage risk.
🔹Mean Reversion Swing Trading-:
This approach involves buying oversold conditions and selling overbought conditions.
Bollinger Bands and RSI divergence help identify potential reversals.
Example: If the price touches the lower Bollinger Band and RSI is below 30, traders anticipate a reversal and enter a long position.
Charts illustrating each strategy with proper entry, stop-loss, and target levels can significantly enhance the reader’s understanding.
🔹Risk Management in Swing Trading-:
Successful swing trading isn’t just about finding the right setups—it’s also about managing risk effectively.
1. Risk-Reward Ratio (Minimum 1:2) – Ensuring that potential profits outweigh potential losses. If a trade has a stop-loss of 10 points, the target should be at least 20 points.
2. Stop-Loss Placement – Placing stop-loss orders below swing lows for long trades and above swing highs for short trades to limit downside risk.
3. Position Sizing – Avoiding excessive exposure by ensuring no more than 2% of total capital is risked on a single trade.
4. Using ATR (Average True Range) – A dynamic way to set stop-loss levels based on market volatility.
An example chart demonstrating a well-placed stop-loss and take-profit target can reinforce these concepts.
Common Mistakes to Avoid in Swing Trading-:
1. Overtrading – Entering too many trades based on impulse rather than solid setups.
2. Ignoring Market Context – Trading against the trend or ignoring macroeconomic factors.
3. Not Using Stop-Loss Orders – Holding onto losing trades in the hope that the market will reverse.
4. FOMO (Fear of Missing Out) Trades – Entering trades too late, after the move has already happened.
Understanding these common pitfalls can help traders refine their strategy and improve long-term success.
🔹Conclusion: Becoming a Profitable Swing Trader-:
Swing trading offers an excellent balance between short-term trading and long-term investing. By using technical indicators, proper risk management, and well-defined strategies, traders can capitalize on price movements while minimizing risk.
Before implementing these strategies in a live market traders should backtest them using TradingView to see how they perform over historical data.
Best Regards-: Amit

Ultimate 2025 Forex Prop Trading FAQ + Strategy Guide🧠 Forex Prop Trading: What Is It?
Prop trading (proprietary trading) is when a trader uses a firm’s capital to trade the markets (instead of their own), and keeps a share of the profits – usually 70–90%.
✅ Low startup cost
✅ No personal risk (firm takes the loss)
✅ Big upside potential with scaling plans
📋 Step-by-Step Action Plan to Get Started (2025)
🔍 1. Understand the Prop Firm Model
🏦 Prop firms fund skilled traders with $10K to $500K+
🎯 You pass a challenge or evaluation phase to prove your skills
💵 Once funded, you earn a profit split (70%–90%)
🧪 2. Choose a Top Prop Firm (2025)
Look for reliable and regulated firms with transparent rules:
FTMO 🌍 – Trusted globally, up to $400K scaling
MyFundedFX 📊 – Up to 90% profit split, no time limit
E8 Funding ⚡ – Fast scaling and instant funding
FundedNext 💼 – 15% profit share during challenge phase
The Funded Trader 🏰 – Up to $600K with leaderboard bonuses
🔎 Compare features: fees, drawdown limits, trading style freedom
💻 3. Train & Master Your Strategy
🧠 Pick a clear, rule-based strategy (e.g. trend following, breakout, supply/demand)
📅 Backtest over 6–12 months of data
💡 Use AI tools & trade journals like Edgewonk or MyFXBook
🎯 Focus on:
Win rate (above 50–60%)
Risk-reward ratio (1:2 or better)
Consistency, not wild profits
🧪 4. Pass the Evaluation Phase
🔐 Follow risk rules strictly (daily & max drawdown)
⚖️ Use proper risk management (0.5–1% risk per trade)
🧘♂️ Trade calmly, avoid overtrading or revenge trades
📈 Most challenges:
Hit 8–10% profit target
Stay under 5–10% total drawdown
Trade for at least 5–10 days
🧠 Tip: Pass in a demo environment first before going live!
💵 5. Get Funded & Start Earning
🟢 Once approved, you trade real firm capital
💰 You keep up to 90% of profits, with withdrawals every 2 weeks to 1 month
🚀 Many firms offer scaling plans to grow your account over time
💬 FAQ – Prop Trading in 2025
❓ How much can you make?
🔹 Small accounts ($50K): $2K–$8K/month with 4–8% returns
🔹 Large accounts ($200K+): $10K+/month possible for consistent traders
💡 Many traders start part-time and scale as they build trust with the firm
❓ How much do I need to start?
💳 Challenge fees range from:
$100 for $10K
$250–$350 for $50K
$500–$700 for $100K+
⚠️ No need to deposit trade capital – just the challenge fee
❓ What are the risks?
You can lose the challenge fee if you break rules or over-leverage
You won’t owe money to the firm
The biggest risk is psychological – many fail from overtrading or emotional decisions
🚀 Final Tips to Succeed
✅ Trade like a robot, think like a CEO
✅ Journal every trade – self-awareness is key
✅ Avoid over-leveraging and gambling mindset
✅ Stick to one strategy and master it
✅ Focus on consistency over quick wins
DOGS Main Trend. Tactics of Working on Risky Crypto 03 2025Logarithm. Time frame 3 days. Tactics of working on super-risky cryptocurrencies of low liquidity, which are always sold (without loading the glass), by the creators of “nothing”. In order to increase sales, of course, when they rationally reverse the trend and make pumps at a large % and marketing positive news "have time to buy". On such assets with such liquidity, “killed faith” (at the moment), and control of the emission in “one hand” it is not difficult. Something like in BabyDOGE.
On such assets you should always remember:
1️⃣ allocate a certain amount for work in general on such assets from the deposit as a whole.
2️⃣ distribute money (potential reversal and decline zones) from this allocated amount to each similar asset in advance.
3️⃣ diversify similar assets themselves (5-10 cryptocurrencies), understanding that sooner or later they will scam. The scam of one of them should not be reflected significantly on the balance of the pump/dump group of low liquidity. It is impossible to guess everything that does not depend on you, and it is not necessary. Your miscalculations (what does not depend on you) are smoothed out by your initial trading plan and risk control, that is, money management (money management).
4️⃣ Set adequate goals. Part of the position locally trade 40-80% (not necessary, but this sometimes reduces the risk).
5️⃣ Work with trigger orders and lower them if they did not work and the price falls.
6️⃣ Remember that in consolidation and cut zones in assets of such liquidity, stops are always knocked out, so the size of the stop does not really matter. It will be knocked out, especially before the reversal.
7️⃣ Before the reversal of the secondary trend, as a rule, they first do a “hamster pump” by a conditionally significant %, when everyone is "tired of waiting". They absorb all sales. Then the main pumping without passengers by a very large % takes place to form a distribution zone. As a rule, it will be lower than the pump highs, that is, in the zone when they are not afraid to buy, but believe that after a large pump, the highs will be overcome significantly.
8️⃣ Remember that assets of such liquidity decrease after listings or highs by:
a) active hype, bull market -50-70%
b) secondary trend without extraordinary events -90-93%
c) cycle change -96-98% or scam, if it is a 1-2 cycle project (there is no point in supporting the legend, how it is easier to make a candy wrapper from scratch without believing holders with coins).
9️⃣In the capitulation zone, there can be several of them depending on the trend of the market as a whole and rationality, the asset is of no interest to anyone. Everyone gets the impression that everything is a scam. That is, on the contrary, you need to collect the asset, observing money management, that is, your initial distribution of money and the risk that you agreed with in advance. As a rule, in such zones people "give up" and abandon their earlier vision.
🔟 After the entire position is set (pre-planned, according to your money management), stop and do not get stuck in the market and news noise. Wait for your first goals.
Remember, people always buy expensive, and refuse to buy cheap ("it's a scam", they try to "catch the bottom"), when "the Internet is not buzzing". This all happens because there is no vision, and as a consequence, no tactics of work and risk control . Many want to guess the “bottom”, or “maximums”, and refuse to sell when they are reached. The first and second are not conditionally available, on assets of such liquidity and emission control. But, there are probabilities that you can operate and earn on this, without getting stuck in the market noise. And also in the opinions of the majority (inclination to the dominant opinion and rejection of your plan and risk control), from which you must fence yourself off.
Most people, immersed in market noise and the opinions of others , choose for themselves the price movement, which is beneficial to them at the moment , and to which they are inclined, but do not provide themselves with the tactics of work. This is a key mistake, and the main manipulation that the conditional manipulator achieves, who, by the way, is sometimes not on the asset, to form an opinion and, as a consequence, the actions of the majority.
Because, in essence, most people do not have the tactics of work. Where the news FUD (inclination to the dominant opinion), “market noise” (cutting zones and collecting liquidity), the opinion of the majority, is directed, that is what they are inclined to.
When the price goes in the other direction, it is disappointment.
If these are futures — liquidation of the position. Zeroing out due to greed.
If this is spot — "proud random holders" , without the ability to average the position (no money), to reduce the average price of the position set as a whole, and as a result increase the % of profit in the future.
A trading plan and risk control are the basis, not guessing the price movement. If you do not have the first “two whales” of trading in your arsenal, then you have nothing. It doesn't matter how much you guess the potential movement, as the outcome of such practice is always the same, and it is not comforting.
Gann Trading Strategy | Predict Market Highs & Lows with Gann.Gann Trading Strategy | Predict Market Highs & Lows with Gann Trading Strategy
In this video we will unlock historical secrets of Sacred Geometry and how they apply to financial markets through W.D. Gann's Time & Price concepts. This video explores the deep connection between natural mathematical principles, the Golden Ratio (0.618), Fibonacci levels, and market structure—all rooted in ancient sacred geometry used in art, architecture, and astronomy.
Markets are not random; they follow universal laws found in nature, human anatomy, and celestial movements. Gann discovered that time and price cycles repeat in predictable patterns, allowing traders to anticipate reversals with precision. This video will guide you through how to use these ancient principles in modern trading.
What You'll Learn in This Video:
✅ Understanding Gann’s Time & Price Geometry – The foundation of market movements
✅ Golden Ratio & Fibonacci Trading – How 0.618, 0.786, and 1.618 shape market trends
✅ The ABCD Pattern in Trading – How to use structured price action setups.
Discover the hidden connections between Sacred Geometry, W.D. Gann’s Time & Price principles, and financial markets in this powerful Gann trading lesson. Markets are not random; they move according to natural laws, mathematical ratios, and planetary cycles—the same principles found in ancient architecture, astronomy, and human biology. Gann’s work revealed that time and price must synchronize for major market reversals, and by understanding these patterns, traders can anticipate key turning points with accuracy. This lesson will dive deep into Gann’s geometric approach, the Golden Ratio (0.618), Fibonacci levels, and structured price action setups, all of which play a crucial role in market movements.

THE IMPORTANCE of Multiple Time Frame Analysis in Forex Gold
In my daily posts, I quite frequently use multiple time frame analysis.
If you want to enhance your predictions and make more accurate decisions, this is the technique you need to master.
In the today's post, we will discuss the crucial importance of multiple time frames analysis in trading the financial markets and forex gold in particular.
1️⃣ Trading on a single time frame, you may miss the important key levels that can be recognized on other time frames.
Take a look at the chart above. Analyzing a daily time frame, we can spot a confirmed bullish breakout of a key daily resistance.
That looks like a perfect buying opportunity.
However, a weekly time frame analysis changes the entire picture, just a little bit above the daily resistance, there is a solid weekly resistance.
From such a perspective, buying GBPUSD looks very risky.
2️⃣ The market trend on higher and lower time frames can be absolutely different.
In the example above, Gold is trading in a bullish trend on a 4h time frame.
It may appear for a newbie trader that buyers are dominating on the market. While a daily time frame analysis shows a completely different picture: the trend on a daily is bearish, and a bullish movement on a 4H is simply a local correctional move.
3️⃣ It may appear that the market has a big growth potential on one time frame while being heavily over-extended on other time frames.
Take a look at GBPJPY: on a weekly time frame, the market is trading in a strong bullish trend.
Checking a daily time frame, however, we can see that the bullish momentum is weakening: the double top pattern is formed and the market is consolidating.
The sentiment is even changing to a bearish once we analyze a 4H time frame. We can spot a rising wedge pattern there and its support breakout - very bearish signal.
4️⃣ Higher time frame analysis may help you to set a safe stop loss.
In the picture above, you can see that stop loss placement above a key daily resistance could help you to avoid stop hunting shorting the Dollar Index.
Analyzing the market solely on 1H time frame, stop loss would have been placed lower and the position would have closed in a loss.
Always check multiple time frame when you analyze the market.
It is highly recommendable to apply the combination of at least 2 time frames to make your trading safer and more accurate.
❤️Please, support my work with like, thank you!❤️
I am part of Trade Nation's Influencer program and receive a monthly fee for using their TradingView charts in my analysis.
