PH, PD High/LowWhen applied, this script draws the previous day's high and low lines. It also plots the open price of the current 1-hour and 4-hour candles. Additionally, it displays the high and low of the previous 1-hour and 4-hour candles. Please note that 4-hour lines are shown only on the 15-minute and 4-hour charts, while 1-hour lines are shown only on the 5-minute and 1-hour charts.
Educational

MTF Dashboard 9 Timeframes + Signals📊 MTF Dashboard — Multi-Timeframe Market Signal Matrix
Overview
The MTF Dashboard is an open-source Pine Script tool that enables traders to monitor key trend and momentum indicators across nine timeframes simultaneously—ranging from 1 minute to monthly—within a single unified view. This script is designed to support both discretionary and rules-based traders by improving efficiency in multi-timeframe analysis.
✅ Key Features
🔄 Multi-Timeframe Coverage
1m, 5m, 15m, 30m, 1H, 4H, 1D, 1W, 1M supported
Toggle individual timeframes on/off as per your trading style
📈 Built-in Technical Indicators
Trend Detection: Based on moving average (EMA) crossovers
Momentum Evaluation: Using Relative Strength Index (RSI)
MACD Status: Displays histogram trend
Volume Confirmation: Compares current volume to average
Confluence Rating: Optional logic combining indicator signals
🎨 Custom Dashboard Appearance
Supports light/dark chart modes
Adjustable panel positioning (Top/Bottom/Center Left/Right)
Multiple text size options
Color settings for bullish, bearish, and neutral signals
🔔 Optional Alerts
Alert conditions for confluence setups or trend changes (user must configure manually)
Use Cases
Identify trend alignment across short, medium, and long timeframes
Confirm entry or exit signals with high-confidence confluence
Detect early shifts in trend direction using EMA, RSI, MACD divergence
Quickly assess overall market sentiment in one glance
Limitations:
This script does not provide financial advice or guaranteed signals
Not intended for automatic trading or strategy backtesting
Users should interpret dashboard signals in the context of price structure and risk management
How to Use:
Add the script to your chart from your favorites
Open the settings panel:
Enable only the timeframes you want to analyze
Customize colors, position, and table layout
Optionally, right-click the script to configure alerts based on confluence or indicator changes
Technical Notes
EMA settings can be adjusted to match your trading system
Designed for visual clarity and performance with multiple timeframes enabled
Credits
This tool was developed to help the TradingView community simplify MTF analysis. Inspired by institutional-grade dashboards and adapted for manual charting use by retail traders.
Tags
#multi-timeframe #EMA #RSI #MACD #volume #confluence #dashboard #trend #momentum #open-source #pine-script #tradingview
License
Published as open-source under the TradingView community sharing model. Users are encouraged to modify, improve, and credit respectfully.

Contrarian RSIContrarian RSI Indicator
Pairs nicely with Contrarian 100 MA (optional hide/unhide buy/sell signals)
Description
The Contrarian RSI is a momentum-based technical indicator designed to identify potential reversal points in price action by combining a unique RSI calculation with a predictive range model inspired by the "Contrarian 5 Levels" logic. Unlike traditional RSI, which measures price momentum based solely on price changes, this indicator integrates a smoothed, weighted momentum calculation and predictive price ranges to generate contrarian signals. It is particularly suited for traders looking to capture reversals in trending or range-bound markets.
This indicator is versatile and can be used across various timeframes, though it performs best on higher timeframes (e.g., 1H, 4H, or Daily) due to reduced noise and more reliable signals. Lower timeframes may require additional testing and careful parameter tuning to optimize performance.
How It Works
The Contrarian RSI combines two primary components:
Predictive Ranges (5 Levels Logic): This calculates a smoothed price average that adapts to market volatility using an ATR-based mechanism. It helps identify significant price levels that act as potential support or resistance zones.
Contrarian RSI Calculation: A modified RSI calculation that uses weighted momentum from the predictive ranges to measure buying and selling pressure. The result is smoothed and paired with a user-defined moving average to generate clear signals.
The indicator generates buy (long) and sell (exit) signals based on crossovers and crossunders of user-defined overbought and oversold levels, making it ideal for contrarian trading strategies.
Calculation Overview
Predictive Ranges (5 Levels Logic):
Uses a custom function (pred_ranges) to calculate a dynamic price average (avg) based on the ATR (Average True Range) multiplied by a user-defined factor (mult).
The average adjusts only when the price moves beyond the ATR threshold, ensuring responsiveness to significant price changes while filtering out noise.
This calculation is performed on a user-specified timeframe (tf5Levels) for multi-timeframe analysis.
Contrarian RSI:
Compares consecutive predictive range values to calculate gains (g) and losses (l) over a user-defined period (crsiLength).
Applies a Gaussian weighting function (weight = math.exp(-math.pow(i / crsiLength, 2))) to prioritize recent price movements.
Computes a "wave ratio" (net_momentum / total_energy) to normalize momentum, which is then scaled to a 0–100 range (qrsi = 50 + 50 * wave_ratio).
Smooths the result with a 2-period EMA (qrsi_smoothed) for stability.
Moving Average:
Applies a user-selected moving average (SMA, EMA, WMA, SMMA, or VWMA) with a customizable length (maLength) to the smoothed RSI (qrsi_smoothed) to generate the final indicator value (qrsi_ma).
Signal Generation:
Long Entry: Triggered when qrsi_ma crosses above the oversold level (oversoldLevel, default: 1).
Long Exit: Triggered when qrsi_ma crosses below the overbought level (overboughtLevel, default: 99).
Entry and Exit Rules
Long Entry: Enter a long position when the Contrarian RSI (qrsi_ma) crosses above the oversold level (default: 1). This suggests the asset is potentially oversold and due for a reversal.
Long Exit: Exit the long position when the Contrarian RSI (qrsi_ma) crosses below the overbought level (default: 99), indicating a potential overbought condition and a reversal to the downside.
Customization: Adjust overboughtLevel and oversoldLevel to fine-tune sensitivity. Lower timeframes may benefit from tighter levels (e.g., 20 for oversold, 80 for overbought), while higher timeframes can use extreme levels (e.g., 1 and 99) for stronger reversals.
Timeframe Considerations
Higher Timeframes (Recommended): The indicator is optimized for higher timeframes (e.g., 1H, 4H, Daily) due to its reliance on predictive ranges and smoothed momentum, which perform best with less market noise. These timeframes typically yield more reliable reversal signals.
Lower Timeframes: The indicator can be used on lower timeframes (e.g., 5M, 15M), but signals may be noisier and require additional confirmation (e.g., from price action or other indicators). Extensive backtesting and parameter optimization (e.g., adjusting crsiLength, maLength, or mult) are recommended for lower timeframes.
Inputs
Contrarian RSI Length (crsiLength): Length for RSI momentum calculation (default: 5).
RSI MA Length (maLength): Length of the moving average applied to the RSI (default: 1, effectively no MA).
MA Type (maType): Choose from SMA, EMA, WMA, SMMA, or VWMA (default: SMA).
Overbought Level (overboughtLevel): Upper threshold for exit signals (default: 99).
Oversold Level (oversoldLevel): Lower threshold for entry signals (default: 1).
Plot Signals on Main Chart (plotOnChart): Toggle to display signals on the price chart or the indicator panel (default: false).
Plotted on Lower:
Plotted on Chart:
5 Levels Length (length5Levels): Length for predictive range calculation (default: 200).
Factor (mult): ATR multiplier for predictive ranges (default: 6.0).
5 Levels Timeframe (tf5Levels): Timeframe for predictive range calculation (default: chart timeframe).
Visuals
Contrarian RSI MA: Plotted as a yellow line, representing the smoothed Contrarian RSI with the applied moving average.
Overbought/Oversold Lines: Red line for overbought (default: 99) and green line for oversold (default: 1).
Signals: Blue circles for long entries, white circles for long exits. Signals can be plotted on the main chart (plotOnChart = true) or the indicator panel (plotOnChart = false).
Usage Notes
Use the indicator in conjunction with other tools (e.g., support/resistance, trendlines, or volume) to confirm signals.
Test extensively on your chosen timeframe and asset to optimize parameters like crsiLength, maLength, and mult.
Be cautious with lower timeframes, as false signals may occur due to market noise.
The indicator is designed for contrarian strategies, so it works best in markets with clear reversal patterns.
Disclaimer
This indicator is provided for educational and informational purposes only. Always conduct thorough backtesting and risk management before using any indicator in live trading. The author is not responsible for any financial losses incurred.

Open Range Breakout (ORB) with Alerts
🚀 ChartsAlgo – Open Range Breakout (ORB) with Alerts
The Open Range Breakout (ORB) Indicator by ChartsAlg is designed for intraday traders looking to capitalize on price movements after the market’s opening range. This tool is especially effective for futures (MNQ, MES) and high-volatility stocks or crypto where initial volatility sets the tone for the session.
This indicator identifies a user-defined opening range window, plots the high/low lines of that range, and visually alerts users when price breaks out above or below the range — with options to customize breakout repetitions, background fill, and alerts.
💡 What is an Open Range Breakout (ORB)?
The opening range represents the high and low established during the first few minutes of the trading session — usually 15 or 30 minutes. Many intraday strategies are based on the idea that breaking out of this initial range often signals strong momentum and trend continuation.
Traders often enter:
Long when price breaks above the range high.
Short when price breaks below the range low.
⚙️ How It Works
You define a session window (e.g., 09:30–09:45 EST).
The indicator tracks the high and low during this time.
Once the session ends, the high and low become your range breakout levels.
The indicator then:
Plots lines for visual clarity
Optionally fills background between the range
Triggers breakout signals if price crosses the levels
Provides alerts when breakouts occur
🛠️ Settings Breakdown
🔹 Session Settings
Range Session: Set your preferred window (e.g., 0930–0945). Can be premarket, first 30 mins, or any custom time.
Time zone: Use "America/New York" for EST (default) or change to "GMT+0" for international traders.
🔹 Breakout Settings
Bullish Breakout Signals: Number of allowed breakout alerts above the range.
Bearish Breakout Signals: Number of allowed breakout alerts below the range.
This prevents repeated alerts once breakout has been confirmed.
🔹 Display Settings
Show Background Fill: Fills area between high/low of the range for easier visual analysis.
Show Breakout Signals: Triangle markers plotted on the chart when breakouts happen.
Only Show Today’s Range: Keeps the chart clean by showing only the most current day’s range.
🔹 Color Settings
Range High/Low Line Colors: Choose any color for clarity.
Range Fill Color: Customize the highlight area for your chart style.
📊 Chart Features
Range High/Low Lines: Automatically plotted after range session ends.
Visual Fill Box: Optional background shading between the opening range.
Triangle Breakout Markers: Appear at the breakout candle.
Alerts: Can be used with TradingView’s alert system to notify you of breakouts in real-time.
🔔 Alerts
Two alert conditions are built in:
Bullish Breakout: Triggers when price breaks above the high of the range.
Bearish Breakout: Triggers when price breaks below the low of the range.
Example Alert Message:
📈 “Bullish Breakout above Open Range on AAPL!”
To activate:
Click “🔔 Alerts” on TradingView.
Set condition to this script.
Choose “ORB Breakout Up” or “ORB Breakout Down”.
Choose alert frequency and notification method.
⚠️ DISCLAIMER
ChartsAlgo tools are for informational and educational purposes only.
They are not financial advice or signals. Past performance does not guarantee future results. Use at your own risk and always implement solid risk management.
By using this indicator, you agree that you are solely responsible for any trades or decisions made based on the information provided.

DTC AIO [India]✨ DTC AIO — The Ultimate All-in-One Market Intelligence Suite
DTC AIO isn’t just another indicator—it’s a complete market intelligence dashboard, purpose-built for Indian equities. Designed for traders who demand more than just signals, DTC AIO fuses professional-grade analytics, pattern recognition, and actionable insights into a single, visually stunning overlay.
✨ What Makes DTC AIO Unique?
All-in-One Dashboard: No more juggling multiple indicators. DTC AIO brings together volatility, volume, trend, momentum, pattern recognition, and even earnings data—right on your chart.
Dynamic Visuals: Modern, theme-adaptive tables and color-coded highlights make complex data instantly readable, whether you prefer dark or light mode.
Pattern Powerhouse: Go beyond the basics with advanced pattern detection—mini-coils, inside bars (with candle coloring!), pocket pivots, and strict shakeout logic.
Burst Ranker: Proprietary “Power Gauge” quantifies explosive price action (+5%, +10%, +17% days) and visualizes it with a unique scoring system.
Earnings Intelligence: See quarterly EPS and sales, with YoY and optional QoQ growth, in a clean, auto-updating table—no more hunting for fundamentals.
Sector/Industry Awareness: Instantly know the context of any stock with sector and industry tags, right on your chart.
Customizable Everything: From moving average types to table positions and text sizes, DTC AIO adapts to your workflow.
🚀 Feature Highlights
Main Metrics Table: ADR%, Relative Volume, 50D Avg Volume, U/D Ratio, and RS vs. custom benchmarks.
Momentum Table: See price distance from key EMAs and 52-week highs/lows, color-coded for clarity.
Pattern Recognition: Mini-coil, inside bar (with painted colored bar), pocket pivot, and shakeout detection—each with visual cues.
Burst Ranker Table: Track and score high-momentum days over your chosen lookback period.
Earnings & Sales Table: Quarterly EPS and sales, YoY and optional QoQ growth, all in one place.
Sector/Industry Table: Know the bigger picture at a glance.
🛠️ Built for the Demanding Trader
DTC AIO is engineered for those who want a true edge—combining technical, fundamental, and behavioral analytics in a single, elegant package. Whether you’re scanning for breakouts, tracking momentum, or analyzing earnings, DTC AIO is your all-in-one solution.
Ready to level up your trading? Add DTC AIO to your chart and experience the difference.

Weinstein Stage Analysis HelperA helper script to visualize the Weinstein Stages intuitively along with other factors like
- Relative Strength
- Volume (On Balance Volume)
- RoE
- P/E
- Growth Rate
- EPS Growth Rate

WMA cross with filtered Signals [Dr.K.C.Prakash]WMA cross with filtered Signals
📌 Description
This indicator is designed to generate trend-filtered Buy and Sell signals based on the crossover of two Weighted Moving Averages (WMAs), with confirmation from a long-term EMA trend filter.
It helps traders avoid false signals in choppy markets by trading only in the direction of the broader trend.
✅ Features
Fast WMA (?) and Slow WMA (?)
Core crossover logic for detecting local trend shifts.
EMA Trend Filter (?)
Confirms overall trend direction.
Buy signals only occur when price is above the EMA ? (uptrend).
Sell signals only occur when price is below the EMA ? (downtrend).
Signal Markers on Chart
BUY label below bar for valid bullish crossovers.
SELL label above bar for valid bearish crossunders.
EMA 200 Line
Clearly plotted to visualize the trend filter level.
Customizable Length Inputs
Users can adjust Fast WMA, Slow WMA, and EMA filter length.
Lines for both WMAs and the EMA trend filter.
Signal labels on valid Buy/Sell events.
✅ Use Cases
Trend-following traders who want cleaner entries.
Avoiding counter-trend signals.
Works on any timeframe (but EMA 200 is best for larger trend context).

ETF Leverage VerificationDo leveraged ETFs really return what they promise?
Do they return the exact 2x or 3x? Or a slightly different multiple?
How much do they deviate from the promised leverage multiples?
Do these deviations impact investors in a positive or negative manner?
These are the questions that I want to answer with this indicator.
The ETF Leverage Verification indicator challenges the conventional understanding of leveraged ETFs by measuring how they actually perform versus their theoretical targets.
Instead of assuming leveraged ETFs perfectly track their target multiple, this indicator quantifies the real-world behavior by comparing the expected returns versus the actual results on every trading day.
Key Features
Measures actual versus expected performance of leveraged ETFs
Tracks deviation patterns across thousands of trading days
Identifies asymmetric behavior in up versus down markets
Quantifies beneficial "cushioning effect" during market declines
Provides statistical summary of performance patterns
Works with any leverage factor (2x, 3x, -1x, etc.)
Compatible with all leveraged ETFs (equity, bond, commodity, volatility)
How to Use the Indicator
Enter the Expected Leverage Factor (default: 2.0)
Select the Base Asset (underlying index, e.g., SPX)
Select the Leveraged Asset (leveraged ETF, e.g., SSO)
Understanding the Results
Green markers: Days when the ETF outperformed its expected multiple
Red markers: Days when the ETF underperformed its expected multiple
Data Table:
Positive Deviations: Count of days with better-than-expected performance
Negative Deviations: Count of days with worse-than-expected performance
Avg Deviation: Average magnitude of deviation from expected returns
Frequency Skew: Difference between beneficial deviations in down vs. up markets
Impact: Overall assessment of pattern benefit to investors
Summary Label:
Percentage of positive deviations in up and down markets
Total sample size for statistical significance
Key Patterns to Look For
Positive Deviation in Negative Days:
This occurs when a leveraged ETF falls less than expected during market declines. For example, if SPX falls 1% and a 2x ETF falls only 1.8% (instead of the expected 2%), this creates a +0.2% deviation. This pattern is beneficial as it provides downside protection.
Negative Deviation in Positive Days:
This happens when a leveraged ETF rises less than expected during market advances. For example, if SPX rises 1% and a 2x ETF rises only 1.9% (instead of the expected 2%), this creates a -0.1% deviation. This pattern reduces upside performance.
Frequency Skew:
The most critical metric that measures how much more frequently beneficial deviations occur in down markets compared to up markets. A higher positive skew indicates a stronger asymmetric pattern that helps long-term performance.
Mathematical Background
The indicator computes the deviation between expected and actual performance:
Deviation = Actual Return - Expected Return
Where:
Expected Return = Base Asset Return × Leverage Factor
The deviation is then categorized into four possible outcomes:
Positive deviation on positive market days
Negative deviation on positive market days
Positive deviation on negative market days
Negative deviation on negative market days
In short, more positive deviations are good for investors.
Please feel free to criticize. I'm happy to improve the indicator.

Steez's Timeframe TableSimple timeframe indicator which can assist with daily bias or draw on liquidity.
Shows all timeframes from 1 minute to 1 day.
Shows close time and if the candle is currently bearish or bullish.

Boxed EMA + Volume PanelBoxed EMA - where Numbers show the price distance from each EMA.
RVOL
VOL percentage + contraction
Average 50 day volume
todays volume

✅ 200 EMA + RSI Pullback + Volume Surge (Full Strategy)200 EMA Trend + RSI Pullback + Volume Surge Strategy (Advanced)
📖 Strategy Description:
This strategy is designed to identify high-probability entries in trending markets using a combination of trend-following and momentum re-entry principles. It works effectively for intraday and swing trading on equities, indices, and crypto.
🔍 Entry Logic:
✅ Long Entry Conditions:
Trend Confirmation:
Price must be above the 200 EMA, indicating a bullish trend.
RSI Pullback:
RSI must drop below a defined level (default 40), indicating a healthy pullback in an uptrend.
Volume Surge:
Current volume must be above 1.5× the 20-period average, confirming strong buying activity.
Entry Triggered on Candle Close:
Ensures reliable confirmation instead of premature entries.
Short Entry Conditions (reverse logic):
Price below the 200 EMA
RSI above threshold (default 60)
Volume surge
Entry only after candle close
Exit Conditions:
Take Profit (TP):
Book profits at 2% move (configurable).
Stop Loss (SL):
Protect capital at 1% loss (configurable).
Trailing Stop Loss (TSL):
Follows the price with a 1.5% trail to lock in profits.
Time-Based Exit:
Closes position automatically after a fixed number of candles (default: 5 bars).
Alerts:
Built-in alerts notify when a Long or Short setup is triggered, allowing traders to act or automate execution.
Best Used On:
Timeframes: 15-minute, 1-hour, or Daily
Markets: NIFTY, BANKNIFTY, RELIANCE, INFY, BTC/USD, ETH/USD
Styles: Intraday, Swing, Trend-followinG
Ideal For:
Traders who follow pullback entries in strong trends
Users looking for automated alerts and exits
Strategies requiring volume confirmation + trend bias

Buying/Selling Climax DetectorBuying/Selling Climax Detector (VSA-Based)
📝 Description:
This indicator identifies potential buying and selling climaxes using principles from Volume Spread Analysis (VSA). It highlights candles where:
Buying Climax: Wide price spread + high volume + bearish close
Selling Climax: Wide price spread + high volume + bullish close
These events may signal exhaustion of trend, smart money activity, or potential reversals.
🔍 How It Works:
Calculates average volume and spread over the last 20 candles.
Flags candles where volume exceeds 120% of the average and spread is wider than usual.
Plots red and green labels on the chart to mark climax events.
⚙️ Best Used On:
High-volume assets (e.g., BTC/USD, major stocks)
Lower timeframes (e.g., 5m, 15m) for intraday signals

JIYANS FVGJIYAN'S FVG is a powerful Fair Value Gap (FVG) indicator designed to help traders visually identify and track bullish and bearish imbalances across customizable timeframes. The script automatically detects FVGs based on market structure and plots them with shaded boxes and clear boundary lines on the chart.
Key Features:
Multi-Timeframe Detection: Select your preferred timeframe for FVG detection (e.g., H4, H1, M30).
Visual Clarity: Displays shaded gaps with customizable colors, upper and lower boundary lines, and optional midpoint lines for precise reference.
Dynamic Management: Automatically removes mitigated (filled) gaps to keep the chart clean and focused.
Labeling: Annotates each FVG with the selected timeframe for easy tracking.
Alerts: Built-in alerts notify you when a new FVG forms or when price touches the boundary of an existing unmitigated FVG.
This tool is perfect for traders who rely on price imbalances and fair value gaps to identify potential trading opportunities and key areas of interest.

Daily/Weekly/Monthly Levels as per INDVIX By Biswaranjan_MDescription: This indicator dynamically draws Daily, Weekly, and Monthly range levels based on the INDIAVIX volatility index. It helps traders visualize potential price zones derived from market volatility and trend behavior.
Note: The indicator dynamically pulls the INDIAVIX value for the previous day and the previous day close of Index (Nifty 50/Bank Nifty/Sensex etc.), then calculates the daily/weekly/monthly ranges as per the user input and draws the levels on the chart as support and resistance.
Key Features:
1. INDIAVIX-Based Range Levels
Calculates projected range levels using the current or past INDIAVIX value, combined with the closing price of the stock or index.
2. Timeframe Flexibility
Choose to display Daily, Weekly, or Monthly levels — each derived from either:
- Today’s close and INDIAVIX, or
- Previous Week/Month close with the corresponding historical INDIAVIX value.
3. Historical Context Mode
Toggle historical mode to project how past levels would have looked using actual INDIAVIX values at the time.
Additional Tools:
* Day Open Line – Marks the opening price of the current trading day.
* Option to add 4 EMAs/SMAs – Moving average for trend following.
* VWAP – Volume-Weighted Average Price for intraday bias and mean reversion analysis.
* Open Range - This option plots the Open Range Box based on the first N minutes of the trading session (e.g., 15, 30, or 60 minutes) and automatically extends the range zone across the entire intraday session up to 3:30 PM.
It is designed for intraday traders, particularly those trading NSE stocks, F&O scripts, and index futures, but works globally on any market with regular intraday sessions.
This all-in-one tool gives you a volatility-informed structure for understanding intraday and positional market dynamics. Designed for any equity/index where INDIAVIX relevance applies.
Release Notes:
In this release, added an option to include a mid level between support and resistance levels.
This mid level option can be enabled or disables from indicators Input tab
Release Notes:
Just rounding down the IndiaVix number.
Release Notes:
Removed the Zero-Lag EMAs and added 4 Moving options to the indicator.
Release Notes:
Added ORB Range to this indicator
Release Notes:
Increased the support and resistance levels from maximum 5 to 10. No other changes to the indicator.

Candle Streak 5 mints This is a free indicator for GOLD on 5 minutes Timeframe
This will give you Entry with SL and TP

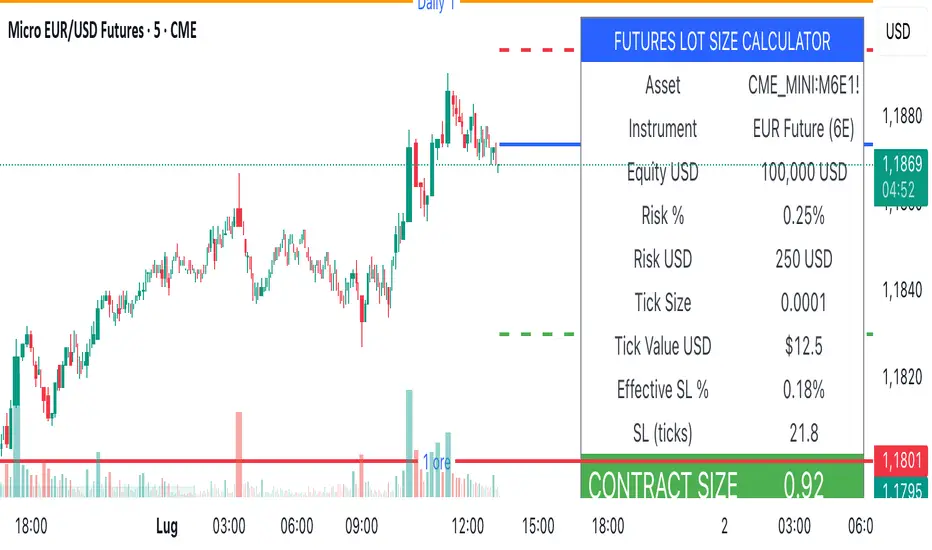
Lot Size Calculator (SL Percentage) - Futures ⚠️ IMPORTANT DISCLAIMER
This indicator is provided for educational and informational purposes only. The author assumes no responsibility for any financial losses, code errors, calculation mistakes, or trading decisions based on this tool. Use at your own risk and responsibility. Always manually verify calculations before opening real positions.
Contract size calculations are based on standard full-size futures contracts, not micro contracts (even though micro contracts are supported for identification).
Description
Money management tool for automatic calculation of optimal contract size (lot size) in futures trading. Supports over 50 futures instruments with pre-configured tick sizes and pip values for CME and other exchanges.
Supported Instruments
Currency Futures: 6J, 6E, 6B, 6A, 6C, 6S, 6N
Index Futures: ES, NQ, YM, RTY, MES, MNQ, MYM, M2K, NKD
Energy: CL, NG, HO, RB, QM
Metals: GC, SI, HG, MGC, SIL
Agricultural: ZC, ZS, ZW, HE, LE, ZO, ZR, ZM, ZL
Interest Rates: ZN, ZB, ZT, ZF
Crypto: MBT, MET
Others: VX
Main Parameters
Equity : Total available capital
Risk : Maximum risk percentage per trade
Stop Loss : Percentage distance of stop loss
Risk/Reward Ratio: Ratio to calculate take profit
Entry Price: Entry price (0 = current price)
Stop Loss Modes
Percentage Stop Loss (Use SL in % = ON):
Automatically calculates SL level as percentage from entry price
Example: Entry 100, SL 2% → Long SL at 98, Short SL at 102
Manual Stop Loss (Use SL in % = OFF):
Enter exact stop loss price directly
Greater precision for specific technical levels (support/resistance)
Interactive feature: You can drag the red stop loss line directly on the chart to modify the level in real-time
How to Use
Set equity and risk % according to your trading plan
Choose direction (Long/Short) and stop loss (percentage or price)
Enter entry price (optional)
Read the CONTRACT SIZE in the green table
Verify levels Entry/SL/TP on the graphic lines
Output
Information table with all parameters and highlighted CONTRACT SIZE
Graphic lines: Entry (blue), Stop Loss (red), Take Profit (green)
Configurable alerts with calculated values
Advantages
✅ Automatic calculation of optimal size
✅ Precise tick sizes for each instrument
✅ Systematic risk management
✅ Clear visual interface
✅ Multi-asset support on futures
Warnings
⚠️ Always verify that the instrument is recognized (no orange warning)
⚠️ Manually check calculations before trading
⚠️ Test in demo before using with real money
⚠️ Update regularly for any contract modifications
⚠️ DISCLAIMER IMPORTANTE
Questo indicatore è fornito esclusivamente a scopo educativo e informativo. L'autore non si assume alcuna responsabilità per eventuali perdite finanziarie, errori nel codice, calcoli errati o decisioni di trading basate su questo strumento. L'utilizzo è a proprio rischio e responsabilità. Si raccomanda di verificare sempre manualmente i calcoli prima di aprire posizioni reali.
I calcoli della dimensione del contratto sono basati su contratti futures standard full-size, non micro contratti (anche se i micro contratti sono supportati per l'identificazione).
Descrizione
Strumento di money management per il calcolo automatico della dimensione ottimale del contratto (lot size) nel trading di futures. Supporta oltre 50 strumenti futures con tick size e pip value pre-configurati per mercati CME e altri exchange.
Strumenti Supportati
Currency Futures: 6J, 6E, 6B, 6A, 6C, 6S, 6N
Index Futures: ES, NQ, YM, RTY, MES, MNQ, MYM, M2K, NKD
Energy: CL, NG, HO, RB, QM
Metals: GC, SI, HG, MGC, SIL
Agricultural: ZC, ZS, ZW, HE, LE, ZO, ZR, ZM, ZL
Interest Rates: ZN, ZB, ZT, ZF
Crypto: MBT, MET
Altri: VX
Parametri Principali
Equity : Capitale totale disponibile
Risk : Percentuale massima di rischio per trade
Stop Loss : Distanza percentuale dello stop loss
Risk/Reward Ratio: Rapporto per calcolare il take profit
Entry Price: Prezzo di entrata (0 = prezzo corrente)
Modalità Stop Loss
Stop Loss Percentuale (Use SL in % = ON):
Calcola automaticamente il livello SL come percentuale dal prezzo di entrata
Esempio: Entry 100, SL 2% → SL Long a 98, SL Short a 102
Stop Loss Manuale (Use SL in % = OFF):
Inserisci direttamente il prezzo esatto dello stop loss
Maggiore precisione per livelli tecnici specifici (supporti/resistenze)
Funzione interattiva: Puoi trascinare direttamente la linea rossa dello stop loss sul grafico per modificare il livello in tempo reale
Come Usare
Imposta equity e risk % secondo il tuo piano di trading
Scegli direzione (Long/Short) e stop loss (percentuale o prezzo)
Inserisci entry price (opzionale)
Leggi il CONTRACT SIZE nella tabella verde
Verifica i livelli Entry/SL/TP sulle linee grafiche
Output
Tabella informativa con tutti i parametri e il CONTRACT SIZE evidenziato
Linee grafiche: Entry (blu), Stop Loss (rosso), Take Profit (verde)
Alert configurabile con i valori calcolati
Vantaggi
✅ Calcolo automatico della size ottimale
✅ Tick size precisi per ogni strumento
✅ Risk management sistematico
✅ Interfaccia visiva chiara
✅ Supporto multi-asset su futures
Avvertenze
⚠️ Verifica sempre che lo strumento sia riconosciuto (no warning arancione)
⚠️ Controlla manualmente i calcoli prima di tradare
⚠️ Testa in demo prima dell'uso con denaro reale
⚠️ Aggiorna regolarmente per eventuali modifiche ai contratti
NQ Hourly Stats - Detailed Prob (24h)Hourly Sweep Statistics - Probability Engine (Credits to nqstats.com)
Overview
This indicator is a powerful statistical tool designed for intraday traders, particularly those focused on session-based patterns and mean reversion strategies. It automatically tracks the previous hour's high, low, and open, and when a sweep of the high or low occurs, it instantly displays the historical probability of the price returning to the hourly open within that same hour.
The core of this indicator is a comprehensive probability model built on historical price data, providing traders with an objective, data-driven edge.
Key Concepts
The indicator operates on a simple but effective premise: after the high or low of the previous hour is taken, what is the statistical likelihood that price will revert back to the opening price of the current hour?
• Previous Hour High (PHH) & Previous Hour Low (PHL): These levels often act as key liquidity zones. A sweep of these levels can signify either a stop run before a reversal or the start of a strong continuation.
• Return to Open: This is a classic mean-reversion concept. The indicator quantifies the probability of this event happening based on the exact time the sweep occurs.
• Time-Based Probability: The probability of returning to the open is not static; it changes depending on when the sweep happens. A sweep in the first 5 minutes of the hour has a different statistical outcome than a sweep in the last 5 minutes. This indicator accounts for that variance by breaking down the hour into 12 distinct 5-minute buckets.
How It Works
1. Automatic Level Plotting: At the start of each new hour, the indicator automatically draws three lines on your chart:
o The Previous Hour's High (Teal, solid line)
o The Previous Hour's Low (Maroon, solid line)
o The Current Hour's Open (Gray, dotted line)
2. Sweep Detection & Labeling: The script constantly monitors price action. The moment the current price action sweeps (touches or breaks) the PHH or PHL, a label appears.
o High Sweep: A label will appear above the PHH line.
o Low Sweep: A label will appear below the PHL line.
3. Information-Rich Labels: Each label provides crucial, real-time information:
o Direction: "Took PHH" or "Took PHL".
o Time: The exact time (@ HH:MM) the sweep occurred.
o Probability: The historical probability ("Prob to Open: XX.XX%") of price returning to the hourly open after that specific sweep.
4. Dynamic Color-Coding: The labels are color-coded for at-a-glance interpretation:
o Green: High probability (>70%) - Strong statistical likelihood of returning to the open.
o Orange: Medium probability (40%-70%) - Neutral/moderate likelihood.
o Red: Low probability (<40%) - Weak statistical likelihood of returning to the open; may suggest trend continuation.
How to Use in Your Trading
This indicator is not a standalone signal generator but a powerful confluence tool to enhance your decision-making.
• Mean Reversion Setups: When a sweep occurs and a high-probability (green) label appears, it can serve as strong confirmation for a mean-reversion trade. You can look for entries on a lower timeframe, targeting the hourly open.
• Trend Continuation Setups: If a sweep generates a low-probability (red) label, it suggests that the move has strength and is less likely to reverse. This can be used to validate a breakout or trend-following strategy, or to avoid taking a counter-trend trade.
• Filtering Trades: Use the probabilities to filter your existing setups. You might choose to only take reversion trades when the probability is above a certain threshold (e.g., 70%) or avoid them entirely when the probability is low.
Features & Customization
• Full 24-Hour Data: The statistical model includes data for all 24 hours of the day, making it useful for trading any session (Asia, London, New York).
• Timezone Setting: Ensure you set the Chart Timezone input to match your chart's timezone (e.g., 'America/New_York') for the probabilities to be accurate.
• Custom Colors: All line colors are fully customizable to match your chart's theme.
Disclaimer: This indicator is based on historical statistics and does not guarantee future results. It should be used as part of a comprehensive trading plan that includes proper risk management. Always do your own research and backtesting.

WMA+VWAP with Buy & Sell signals [Dr.K.C.Prakash]WMA+VWAP with Buy & Sell signals
✅ Purpose:
This TradingView indicator helps traders identify trend shifts and trade opportunities by combining:
Weighted Moving Average (WMA) crossover signals (for trend direction)
VWAP (Volume Weighted Average Price) (for intraday fair-value levels)
It is designed to visually signal Buy/Sell entries on the chart when the faster WMA crosses the slower WMA, while also showing the VWAP for additional trade context.
The crossover logic highlights potential shifts in trend momentum.
2️⃣ VWAP (Volume Weighted Average Price)
Plotted as an orange line.
VWAP is widely used by intraday traders to identify a "fair value" price level, helping confirm if price is trading above/below the session’s average price.
✅ Traders often use VWAP as dynamic support/resistance or to filter trade entries (e.g., only take buys if price is above VWAP).
3️⃣ Visual Signals
BUY label: Green, below bar.
SELL label: Red, above bar.
These labels appear directly on the chart when crossovers occur, making it easy to spot entry points.

CVD Battle Tape Strategy 🔥
⸻
🔍 What This Tool Does & How It Helps You
The CVD Battle Tape Strategy™ is a pro-level market analyzer that helps you instantly see who’s in control — buyers or sellers — and whether they’re strong or getting trapped.
It uses live Cumulative Volume Delta (CVD) and Directional Movement Index (DMI) to track aggressive buying and selling pressure, then tells you if that pressure is actually moving price or failing to.
⸻
✅ What It Gives You
• Clear Buy/Sell Control Signals – Know when real buyers or sellers are stepping in.
• Trap Detection – Spot when price moves against volume pressure (a major edge).
• Execution Bias – Real-time cues like “Lifting the Ask” or “Selling the Bid” to stay aligned.
• Live Strength Meter – CVD, Net Force, and Price Change shown in a quick-read dashboard.
⸻
🚀 Why It’s Powerful
Most traders can’t read raw order flow — this script does the heavy lifting for you.
It decodes complex volume behavior and gives you real-time insights on control shifts and sentiment changes.
Pair it with our live Discord order flow feed, and you now have two tools confirming the same story — like a radar and compass working together.
Whether you’re scalping, swinging, trading forex, futures, options, or commodities — this tool raises your decision-making to a professional level.

Box Breakout EMA OI Strategy
🔹 Matching Tool for Order Flow Insight 🔹
This is a proprietary-level matching tool I designed to reverse-engineer order flow behavior in a way that’s clear, visual, and instantly actionable.
Rather than relying on traditional volume indicators or lagging signals, this tool reveals who is in control of the market in real time—buyers or sellers—using a unique algorithm built from the logic of professional order flow systems.
It’s an excellent companion for traders across forex, futures, options, commodities, and equities, and works seamlessly for both scalping and swing trading styles.
This tool is not just reactive—it’s strategically built to mirror institutional behavior, helping traders align their execution with the actual flow behind price moves. When paired with live order flow data (like we use in our community), it becomes a powerful real-time edge.

ParthFintech MARKETSParthFintech MARKETS
Session Mapping & Real-Time Countdown Indicator
Overview
ParthFintech MARKETS is a lightweight, fully on-chart Pine Script indicator that:
Automatically detects your chart’s timezone
Shades each of the four major FX sessions (Tokyo, London, New York, Sydney) in muted background colors
Highlights the currently active session with a soft green overlay
Displays a live countdown label showing time remaining until the end of the current session—or, if markets are closed, until the next session opens
Whether you trade forex, indices or commodities, this tool gives you instant visual context around session openings and closings—so you can better plan entries, exits and high-volatility news events.
---
🚀 Key Features
Auto-Timezone: All session times (Tokyo 00:00–09:00, London 08:00–17:00, New York 13:00–22:00, Sydney 22:00–06:00) are calculated in your chart’s local timezone—no manual offsetting required.
Session Shading:
Tokyo: semi-transparent blue
London: semi-transparent orange
New York: semi-transparent purple
Sydney: semi-transparent yellow
Current-Session Highlight: A light green background indicates which session is now active.
Countdown Label:
When a session is open: “Session: ends in hh:mm”
When closed: “No session. Next in hh:mm”
Automatically updates on every new bar.
Flexible Timeframes: Works on any chart timeframe (1 m, 5 m, 15 m, 1 h, 4 h, daily, etc.).
---
📈 How to Use
1. Add to Chart: In TradingView’s Pine Editor, paste the ParthFintech MARKETS script and click Add to Chart.
2. Publish: When you publish, use the description above to let other traders know exactly what they’re getting.
3. Customization (Optional):
Open the script and modify the session start/end hours at the top if you have a different trading schedule.
Adjust the shading opacity or colors by editing the color.new() parameters.
------
> Note: This indicator is designed for informational and planning purposes. Always combine session-based insights with your own technical and fundamental analysis before placing trades.
Enjoy clearer session visibility and pinpoint timing on your charts—courtesy of ParthFintech MARKETS!
For more information, contact support@parth-fintech, Telegram: @ParthFintech
www.parth-fintech.com

MNQ1! 15min NW Strategy V2.0This strategy is built specifically for the MNQ1! futures contract on the 15-minute timeframe. It identifies and trades a specific price action setup where candles have little to no wick (either top or bottom), indicating potential momentum continuation. The system places pending limit orders with defined stop-loss and take-profit levels based on ATR volatility.
🔍 Key Features:
Only runs on MNQ1! and the 15-minute chart (errors otherwise to prevent misuse).
Detects "no-wick" candles based on configurable wick and body size filters.
Supports session-based trading (default: 02:00–16:00 NY time).
Executes limit-style entries placed a set number of points away from candle levels.
Uses ATR-based stop-loss and take-profit calculations for adaptive risk control.
Cancels orders automatically after a configurable number of bars if not filled.
Built-in performance statistics table shows live metrics on strategy results.
Trade signals and SL/TP levels are plotted directly on the chart for easy visualization.
⚙️ User Inputs Include:
Candle Settings: Wick percentage, min/max body size
Risk Settings: ATR multiplier, risk/reward (TP), contract size
Strategy Settings: Session time, entry offset distance, cancel-after bars
Performance Table: Toggle visibility, starting balance for display calculations
📈 Performance Table Metrics:
Total trades
Starting and ending balance
Net return in $ and %
Win rate
Maximum drawdown (in $ and %)
⚠️ Notes:
This strategy does not repaint.
Meant for educational and research purposes only — it is not financial advice.
Results may vary based on market conditions, latency, and broker execution. Always forward-test before using in live trading.

Tuga SupertrendDescription
This strategy uses the Supertrend indicator enhanced with commission and slippage filters to capture trends on the daily chart. It’s designed to work on any asset but is especially effective in markets with consistent movements.
Use the date inputs to set the backtest period (default: from January 1, 2018, through today, June 30, 2025).
The default input values are optimized for the daily chart. For other timeframes, adjust the parameters to suit the asset you’re testing.
Release Notes
June 30, 2025
• Updated default backtest period to end on June 30, 2025.
• Default commission adjusted to 0.1 %.
• Slippage set to 3 ticks.
• Default slippage set to 3 ticks.
• Simplified the strategy name to “Tuga Supertrend”.
Default Parameters
Parameter Default Value
Supertrend Period 10
Multiplier (Factor) 3
Commission 0.1 %
Slippage 3 ticks
Start Date January 1, 2018
End Date June 30, 2025
