Obsession.FX Sessions IndicatorSession & Fractal Structure Tool — for Market Phases and Microstructure Analysis
This script combines session timeframes with local fractal identification to help traders analyze market context and structural shifts. It is designed for those applying Smart Money Concepts, where precise session boundaries and reactions to key levels are critical.
Session Zones
The script visualizes the three main trading sessions: Asia, London, and New York. It helps to:
– identify active phases of market participation;
– track each session’s Highs and Lows;
– interpret price behavior in relation to intraday liquidity shifts.
Each session is fully customizable — including start/end time, background and border colors, and display style (box, high/low lines, filled zones).
Fractal Structure
Fractals are shown as local highs and lows, supporting:
– detection of BOS/CHOCH on lower timeframes;
– building A→B ranges for structural flow;
– confirming short-term directional changes.
The fractal algorithm is optimized for responsiveness and clarity, with no repainting and minimal delay.
Purpose and Usage
This tool is intended for contextual reading of price action: determining the active session and monitoring price behavior within its boundaries, with a focus on microstructural reactions. It supports building precise entry logic based on the interaction between session ranges and fractal structure.
Closed Source Justification
The script is closed-source due to its use of proprietary logic for fractal detection and session integration, developed as part of a private trading methodology not available in public libraries.
Educational

Trading Desk 💩 Stocks WarningA simple script that shows an obnoxious warning on top of the main chart when you pull up one the stocks that the collective brain trust of J's Trading Desk has decided is complete 💩. It can't be trusted and is likely to just burn you.

ICT Setup 04 [TradingFinder] SFP Sweep Liquidity Fake CHoCH/BOS🔵 Introduction
In smart money and ICT based trading, liquidity is never random. Some of the most meaningful market moves begin with a liquidity sweep where price intentionally hunts a previous swing high or swing low to trigger stop loss orders and absorb volume.
This manipulation is often followed by a sharp reversal from a reaction zone, creating ideal conditions for a high probability entry. This indicator is built to detect exactly that. It identifies a valid swing point and defines a reaction zone where price is likely to react.
For short setups, the zone lies between the swing high and the maximum of the candle’s open or close. For long setups, it’s drawn from the swing low to the minimum of the open or close.
When price returns to this zone and forms a qualified confirmation candle typically a doji or a small bodied candle that closes inside the zone while sweeping the liquidity this is a potential sign of reversal.
The candle must show both the sweep and the inability to hold above or below the key level, signaling a fake breakout or failed move. By combining elements of liquidity hunt, reaction zone rejection, and candle based entry confirmation, this tool highlights sniper entry points used by smart money to trap retail traders and reverse the trend. It helps filter out noise and enhances timing, making it ideal for trading in alignment with institutional order flow.
Long Position :
Short Position :
🔵 How to Use
This indicator is designed to highlight precise moments where price sweeps liquidity and reacts within a high probability reversal zone. By identifying clean swing highs and lows and defining a smart reaction zone around them, it filters out weak fakeouts and focuses only on setups with strong institutional footprints.
The tool works best when combined with market structure analysis and is suitable for both scalping and intraday trading. Below is a breakdown of how to interpret the signals for long and short positions based on the visual setups provided.
🟣 Long Setup
In a long setup, the indicator first detects a valid swing low where liquidity has likely accumulated below. A reaction zone is then drawn between the swing low and the minimum of the open or close of the swing candle.
When price returns to this zone, it must sweep the previous low and form a precise confirmation candle, such as a doji or a small bodied candle, that closes inside the zone. This candle must also reject the lower level, showing failure to continue downward.
As shown in the chart, once the liquidity grab is complete and the confirmation candle forms, a clean long signal is issued, indicating a potential bullish reversal backed by smart money behavior.
🟣 Short Setup
In a short setup, the indicator identifies a swing high where buy-side liquidity is resting. It then constructs a reaction zone between the high and the maximum of the open or close of the swing candle. Price must return to this zone, sweep the swing high, and form a bearish confirmation candle inside the zone.
A classic example is a doji or rejection candle that traps breakout buyers and fails to hold above the previous high. In the provided chart, the price aggressively hunts the liquidity above the swing high, but the close within the reaction zone signals exhaustion, prompting a short signal with high reversal probability.
These setups represent moments where price action, liquidity behavior, and candle structure align to offer strong entries. By focusing on clean sweeps and reactive confirmations, the indicator helps traders stay on the side of smart money and avoid common breakout traps.
🔵 Settings
🟣 Logical settings
Swing period : You can set the swing detection period.
Max Swing Back Method : It is in two modes "All" and "Custom". If it is in "All" mode, it will check all swings, and if it is in "Custom" mode, it will check the swings to the extent you determine.
Max Swing Back : You can set the number of swings that will go back for checking.
Maximum Distance Between Swing and Signal :The maximum number of candles allowed between the swing point and the potential signal. The default value is 50, ensuring that only recent and relevant price reactions are considered valid.
🟣 Display settings
Displaying or not displaying swings and setting the color of labels and lines.
🟣 Alert Settings
Alert SFP : Enables alerts for Swing Failure Pattern.
Message Frequency : Determines the frequency of alerts. Options include 'All' (every function call), 'Once Per Bar' (first call within the bar), and 'Once Per Bar Close' (final script execution of the real-time bar). Default is 'Once per Bar'.
Show Alert Time by Time Zone : Configures the time zone for alert messages. Default is 'UTC'.
🔵 Conclusion
This indicator is built for traders who rely on liquidity driven setups and smart money principles. By combining swing structure analysis with precision reaction zones and strict entry confirmation, it isolates the exact moments where price sweeps liquidity and fails to continue. These are high value points where institutional activity often reveals itself, and retail traps unfold.
Unlike generic breakout tools, this script focuses on quality over quantity by requiring both a sweep of a swing high or low and a confirmed rejection candle that closes inside a predefined zone. With customizable swing depth, proximity filters, visual highlights, and alert functions, it offers a complete framework for identifying and acting on fake breakouts with confidence. Whether you trade forex, crypto, or indices, this tool enhances your ability to align with true order flow and take entries where liquidity is most likely to shift.

Grid Bot v6 StrategyGrid Bot v6 Strategy
Adaptive parabolic grid that turns market structure into a step-by-step trading plan
Idea of strategy and source code of base indicator provided by my subscriber @Sergio_Nov
1. Core concept
Grid Bot v6 draws a dynamic parabola from a user-defined time/price anchor and builds a 10-level grid around it (five lines above, five below).
Each level is colour-coded:
Green – preferred buy area
Red – preferred sell area
Yellow – overlap of buy-and-sell zones (balance)
Grey – neutral zone
Orders are fired when price touches or reverses from a grid line and the signal is confirmed by current market sentiment. If sentiment contradicts the signal, the order is tagged secondary and uses a reduced lot size.
2. How the logic works
Parabola – the function f_parabola computes the curve from Accel, Curve and Sensitivity. Zero values give a flat horizontal grid; non-zero values create an accelerating or decelerating trendline.
Grid spacing – controlled by Intervals (percentage of price). Lines are recalculated every bar, so the grid “breathes” with the market.
Triggers – choose which part of the candle must reach the level (Wick, Close, Midpoint, SWMA).
Confirmation – decide whether a simple touch is enough or a full reversal is required (Touch vs Reverse).
Sentiment filter – by default the slope of the parabola (up = long bias, down = short bias). You can override it to Long, Short or Neutral.
Order types – four independent sizes: Main Buy, Secondary Buy, Main Sell, Secondary Sell. Pyramiding up to 100 entries is allowed.
Visuals – the script plots actual and projected grid lines (100 bars ahead), the SWMA trigger and the parabola itself. Trade symbols: ▲ ▼ △ ▽.
3. User inputs
Strategy Settings
Main Buy Lot / Secondary Buy Lot
Main Sell Lot / Secondary Sell Lot
Grid Settings
Accel – tilt of the curve (positive for uptrend, negative for downtrend)
Curve – concavity; higher absolute value = stronger bend
Intervals – distance between grid lines (in %)
Sensitivity – how fast the parabola adapts; higher = more reactive
Buy Zones / Sell Zones – number of active lines below/above the curve
Trigger – Wick, Close, Midpoint, SWMA
Confirm – Touch or Reverse
Sentiment – Slope, Long, Short, Neutral
Show Signals / Show Selector – toggle on-chart markers and SWMA line
Chart Settings – individual colours for active grid, projection, parabola and SWMA.
Time/Price Anchor
B_Time – starting bar (e.g. a recent swing high/low)
B_Price – price at that bar
Tip: drop the anchor on a clear pivot, then tune Accel and Curve so the parabola hugs the trend.
4. Quick-start guide
Open your favourite symbol and timeframe (works best on volatile markets from 5-minute to 4-hour).
Set B_Time / B_Price to the last significant extreme.
Adjust Accel and Curve:
Uptrend – positive Accel, negative Curve for a concave support.
Range – both zero for a flat ladder.
Choose Intervals: smaller values = more frequent trades.
Limit Buy Zones and Sell Zones if you prefer a tighter grid.
Run a back-test, check P/L, max drawdown and trade count.
Fine-tune: lower Sensitivity if the curve outruns price; switch Trigger to SWMA to filter noise.
5. Pros and cons
Strengths
Adaptive levels that keep up with trend acceleration.
Clear colour coding plus forward projection for better context.
Sentiment filter reduces counter-trend exposures.
Weaknesses
Many parameters – each asset/timeframe needs its own calibration.
In narrow ranges frequent fills can accumulate fees.
pyramiding = 100 grows exposure quickly; monitor margin closely.
6. Risk disclaimer
This script is for educational and research purposes only. Historical performance does not guarantee future results. Before going live:
Forward-test bar-by-bar;
Check that your broker supports similar order handling;
Apply sound position sizing and, where appropriate, stop-losses or hedging.

Ergin Swing V2"Wealth doesn’t come in a hurry. Be patient with yellow, take a break with purple."
Ergin Swing V2 is a minimalistic yet highly effective visual strategy built on a single indicator: EMA14.
✅ Yellow candle → First close above EMA14 = Buy signal
🟣 Purple candle → First close below EMA14 = Sell signal
🔇 No noisy signals in between. Only the first cross is marked.
Ideal for:
Swing traders who prefer clean charts
Trend-followers who avoid indicator overload
Anyone who wants to "see the signal" clearly without alerts popping every bar
➕ Can be extended with RSI, TP/SL logic, or trend filters
Created by Ergin • Powered by Patience • Verified by Candles


Watermark Clarity V33🌟 Introducing Watermark Clarity V33 – Banner 🌟
Watermark Clarity V33 is a visual utility tool designed to enhance chart awareness, focus, and clean aesthetics without adding market noise. Unlike traditional indicators, this script does not generate buy/sell signals or perform technical analysis. Instead, it provides a customizable on-chart watermark banner that clearly communicates your current mindset, risk awareness, or trading bias directly on the chart — helping traders stay aligned with their pre-defined plans and reducing impulsive behavior.
Whether you’re a discretionary trader, scalper, or swing trader, Watermark Clarity V33 offers an adaptive display that blends clarity with minimalism, keeping your chart clean while remaining informative.
🛠 Customizable Parameters
• Dual Text Banners: Configure two independent headers to reflect trading goals, risk posture, or emotional cues.
• Smart Animation Toggle: Optionally animate between messages to help reinforce shifting market awareness or draw attention during high-alert periods.
• Size, Color & Positioning: Adjust the info box’s text size, banner dimensions, background color, transparency, and placement (top/middle/bottom – left/center/right).
• Transparent Mode: Switch to semi-transparent mode for cleaner overlays during live sessions or screen recording.
🚀 New Feature – Custom Alerts & Smart Animation Control
• Market-Aware Animation Logic:
When Enable Animation is turned on and both Heading 1 and Heading 2 are filled:
• 📈 During Market Hours → The banner alternates smoothly between both headings, helping maintain awareness and visual engagement.
• 💤 Outside Market Hours → The banner remains fixed on Heading 1. This acts as a subtle visual cue that markets are currently closed — giving you peace of mind and a cleaner screen.
✨ Visual Utility Use Cases
• Accountability Layer: Keep yourself accountable to your trading rules or session checklist.
• Mindset Anchor: Display motivational or tactical reminders that guide your trading behavior.
• Multi-Timeframe Syncing: Use different watermarks across charts to stay aligned across timeframes or instruments.
📘 How to Use
1. Add the Indicator: Apply “Watermark Clarity V33 – Banner” to your chart.
2. Configure Inputs: Adjust the banner texts, size, color scheme, and screen position to your liking.
4. Focus & Trade: Let the visual cue support your decision-making environment without interfering with price action.
❗ Important Notes
• This indicator does not analyze price data or generate signals. It is designed solely for visual clarity and trader discipline support.
• All display logic runs in real-time and responds to your settings only, no repainting or lookahead bias.

Hodie Smart Inside BarThe Hodie Smart Inside Bar indicator automatically detects and visually highlights inside bars — candles fully contained within the range of the previous (parent) candle.
How the indicator works:
Inside Bar Identification:
The indicator analyzes each candle and checks if its high is lower than the previous candle’s high, and its low is higher than the previous candle’s low. If this condition is met, the candle is considered an inside bar.
Size Filtering:
To filter out small and insignificant consolidations, the indicator compares the size of the parent candle’s range to the inside bar’s range. Only if the parent candle is significantly larger (2 times or more — adjustable parameter), the inside bar is considered significant.
Zone Drawing:
For each detected inside bar, the indicator draws a rectangular zone bounded by the parent candle’s high and low. This zone automatically extends to the right as new bars appear until the price moves outside the parent candle’s range.
Zone Completion:
Once the price closes above the parent candle’s high or below its low, the zone is considered complete and stops extending.
Visual Aids:
If enabled, the indicator can shade the background of the current inside bar for additional visual emphasis.
A label with the text "IB" appears above the inside bar candle on the chart for easier identification.
Alerts:
Supports alerts when a new inside bar forms.
Alerts help traders notice important signals promptly.
To activate, create an alert on the indicator with the condition “New Inside Bar”.
Benefits of the Indicator:
Inside bars often signal consolidation and potential liquidity accumulation, which may be followed by a strong impulsive breakout. This indicator helps traders quickly identify consolidation zones and prepare for possible price moves.

APLBGreen Line: Indicates the EMA is rising (bullish short-term momentum).
Red Line: Indicates the EMA is falling (bearish short-term momentum).

MT Daily ZonesMT Daily Zones
A precision market structure tool from Mindfluential Trading, combining daily CPR, PDH/PDL zones, EMAs/SMAs - all optimized for intraday traders.
🔹 Core Features
🔵 CPR (Central Pivot Range)
Plots Pivot, TC, and BC from the previous day
Helps define the market's fair value zone and compression/breakout areas
Royal blue color ensures clarity on both light and dark themes
🟠 PDH / PDL Zones
Accurately plots Previous Day’s High and Low
Useful for breakout scalps, reversal traps, and trend continuation setups
🟢 Smart Trend Filters
Toggle EMAs (8, 20, 50) and SMAs (50, 100, 200)
Smooth color-coded display for dynamic trend alignment
✅ Clean Visuals. Real Structure. No Clutter.
⚠️ Disclaimer
This indicator is for educational purposes only. Do your own research before making trading decisions.
May 27
Release Notes
MT Daily Zones
A precision market structure tool from Mindfluential Trading, combining daily CPR, PDH/PDL zones, EMAs/SMAs - all optimized for intraday traders.
🔹 Core Features
🔵 CPR (Central Pivot Range)
Plots Pivot, TC, and BC from the previous day
Helps define the market's fair value zone and compression/breakout areas
Royal blue color ensures clarity on both light and dark themes
🟠 PDH / PDL Zones
Accurately plots Previous Day’s High and Low
Useful for breakout scalps, reversal traps, and trend continuation setups
🟢 Smart Trend Filters
Toggle EMAs (8, 20, 50) and SMAs (50, 100, 200)
Smooth color-coded display for dynamic trend alignment
✅ Clean Visuals. Real Structure. No Clutter.
⚠️ Disclaimer
This indicator is for educational purposes only. Do your own research before making trading decisions.

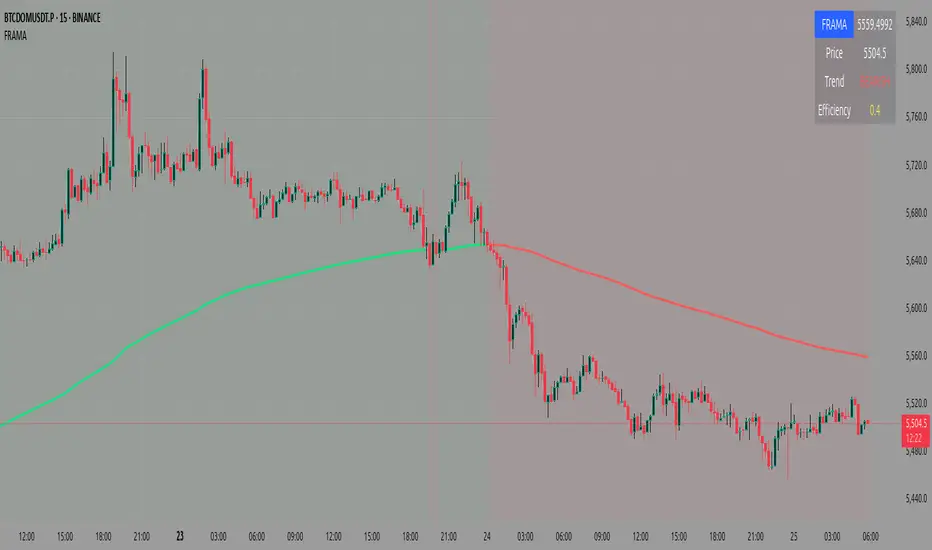
Fractal Adaptive Moving Average (FRAMA)Core Concept
Unlike traditional moving averages that use fixed smoothing factors, FRAMA adapts its responsiveness based on how "fractal" or chaotic the price movement is:
In trending markets (low fractal dimension), it becomes more responsive
In choppy/sideways markets (high fractal dimension), it becomes smoother
How It Works
1. Fractal Dimension Calculation:
Splits the lookback period into two halves
Calculates price ranges for each half and the total period
Uses logarithmic ratios to determine the fractal dimension (bounded between 1.0 and 2.0)
2. Dynamic Alpha Calculation:
Converts fractal dimension to a smoothing factor (alpha)
Higher fractal dimension = lower alpha = smoother average
Lower fractal dimension = higher alpha = more responsive average
3. Adaptive Smoothing:
Applies the calculated alpha to create the moving average
FRAMA = alpha × current_price + (1 - alpha) × previous_FRAMA
Key Parameters
Length (16): Lookback period for calculations
Fast Constant (4.0): Maximum responsiveness limit
Slow Constant (300.0): Minimum responsiveness limit
Visual Features
Line Color: Green when rising, red when falling
Background: Light green above FRAMA (bullish), light red below (bearish)
Information Table: Shows current FRAMA value, price, trend direction, and efficiency ratio
Close Price: Plotted as a semi-transparent white line for comparison
Trading Applications
FRAMA is particularly useful for:
Trend Following: More responsive in strong trends, less noisy in consolidations
Support/Resistance: Acts as dynamic support in uptrends, resistance in downtrends
Market Regime Detection: The efficiency ratio helps identify trending vs. ranging markets
Entry/Exit Signals: Crossovers and price position relative to FRAMA
The indicator automatically balances between being fast enough to catch trends early while being smooth enough to avoid false signals in choppy markets.
In this FRAMA script, fractal refers to measuring the complexity or "roughness" of price movements over time, not the self-similar geometric patterns we typically think of.
What the Script Measures
The script calculates a fractal dimension that quantifies how chaotic or smooth the price action is:
Low fractal dimension (closer to 1.0): Price moves in a relatively straight, trending manner
High fractal dimension (closer to 2.0): Price moves in a jagged, choppy, sideways manner.
The Logic
If the market is trending smoothly:
The sum of the two half-period ranges will be close to the total range
This gives a fractal dimension closer to 1.0
The indicator becomes more responsive (faster)
If the market is choppy/sideways:
The sum of the two half-period ranges will be much larger than the total range
This gives a fractal dimension closer to 2.0
The indicator becomes less responsive (smoother)
Practical Example
Imagine a 16-period lookback:
Trending market: Price goes from 100 → 116 steadily
Choppy market: Price bounces 100→108→102→114→106→116
The choppy market has a higher fractal dimension because there's more "path length" relative to the actual distance traveled.
Why This Matters
The fractal dimension becomes the adaptive mechanism that automatically adjusts the moving average's sensitivity based on current market conditions - making it faster in trends and smoother in consolidations.
what is efficiency that is shown in tables
The efficiency shown in the table measures how "efficient" or smooth the FRAMA line is compared to the actual price movement.
What It Means
Efficiency = FRAMA Movement ÷ Price Movement
Values close to 0: FRAMA is very smooth/stable while price is moving significantly
Values close to 1: FRAMA is moving almost as much as the price
Values > 1: FRAMA is moving more than the raw price (rare, usually in very short periods)
Practical Interpretation
Low Efficiency (0.1 - 0.3):
FRAMA is doing a good job of smoothing out noise
Market is likely choppy/sideways
The adaptive mechanism is working - keeping the average stable during consolidation
High Efficiency (0.7 - 1.0):
FRAMA is closely following price movements
Market is likely trending strongly
The adaptive mechanism is making the average more responsive
Medium Efficiency (0.3 - 0.7):
Balanced market conditions
FRAMA is providing moderate smoothing
Trading Context
This efficiency ratio helps you understand:
Market regime: Is this a trending or ranging market?
Signal quality: Low efficiency periods might produce fewer but higher-quality signals
Adaptive performance: How well the FRAMA is adapting to current conditions
For example, if you see efficiency at 0.15, it means the FRAMA moved only 15% as much as the price did in the last bar, indicating it's successfully filtering out noise in a choppy market. If efficiency is 0.85, the FRAMA is closely tracking price, suggesting a trending environment where you want the average to be responsive.
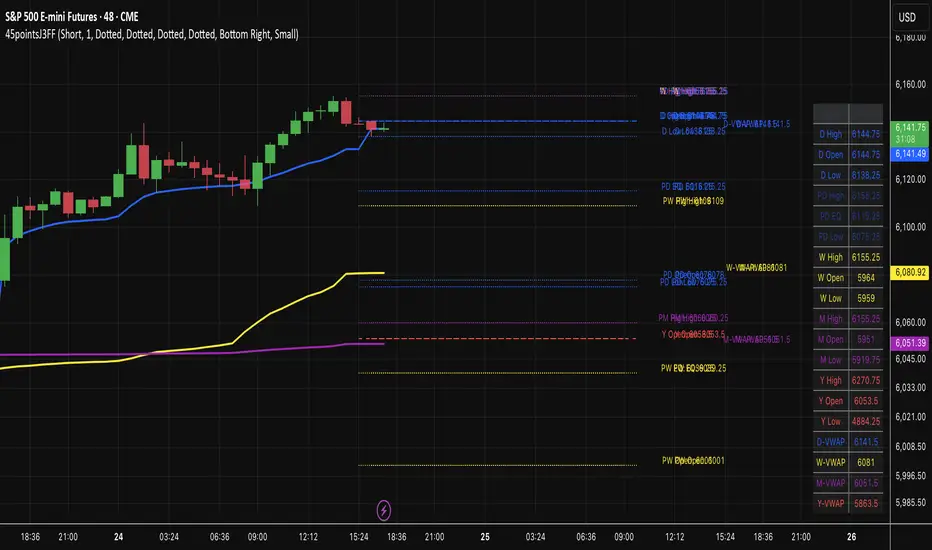
45pointsJ3FF Enhanced# 45pointsJ3FF Enhanced Pine Script Indicator
This is a comprehensive multi-timeframe support and resistance indicator for TradingView that displays key price levels and VWAP (Volume Weighted Average Price) across different time periods.
## 🎯 **Core Functionality**
The indicator plots critical price levels from multiple timeframes simultaneously on your chart, helping traders identify key support/resistance zones and volume-based price levels.
## 📊 **Key Levels Displayed**
### **Multi-Timeframe Levels:**
- **Daily**: Open, High, Low + Previous Day levels
- **Weekly**: Open, High, Low + Previous Week levels
- **Monthly**: Open, High, Low + Previous Month levels
- **Yearly**: Open, High, Low + Previous Year levels
### **Equilibrium Levels:**
- **50% Retracement** levels for previous periods (midpoint between high and low)
- Helps identify potential reversal zones
### **VWAP Levels:**
- **Daily VWAP**: Volume-weighted average for current day
- **Weekly VWAP**: Custom calculation for current week
- **Monthly VWAP**: Custom calculation for current month
- **Yearly VWAP**: Custom calculation for current year
## ⚙️ **Customization Options**
### **Display Controls:**
- **Individual toggles** for each timeframe (Daily/Weekly/Monthly/Yearly)
- **Previous period toggles** to show/hide historical levels
- **Line extension options**: Short, Right, Both
- **Adjustable line width** (1-3 pixels)
### **Visual Customization:**
- **Custom colors** for each timeframe
- **Individual line styles** (Solid, Dashed, Dotted) for each timeframe
- **Price labels** can be toggled on/off for lines and VWAPs
### **Price Table Features:**
- **Comprehensive side table** showing all active level prices
- **4 position options**: Top/Bottom + Left/Right corners
- **3 size options**: Small, Normal, Large
- **Color-coded entries** matching chart lines
- **Auto-filtering**: Only shows enabled levels
## 🔧 **Technical Implementation**
### **VWAP Calculations:**
- **Daily**: Uses built-in `ta.vwap()` function
- **Weekly/Monthly/Yearly**: Custom accumulative calculations using volume-weighted price averaging
- **Timeframe Detection**: Higher timeframe VWAPs only show on intraday charts
### **Higher Timeframe Data:**
- Uses `request.security()` to fetch OHLC data from higher timeframes
- **Lookahead enabled** for real-time updates
- **Previous period data** accessed using ` ` historical referencing
### **Drawing System:**
- **Dynamic line drawing** with customizable extension
- **Smart labeling system** with price formatting
- **Tick-rounded prices** for clean display
- **Performance optimized** with conditional drawing
## 📈 **Trading Applications**
### **Support & Resistance:**
- **Previous day/week/month highs and lows** act as key S/R levels
- **Opening levels** often serve as pivot points
- **Equilibrium levels** (50% retracements) are common reversal zones
### **VWAP Trading:**
- **Daily VWAP**: Intraday trend direction and mean reversion
- **Higher timeframe VWAPs**: Longer-term trend bias
- **Multiple VWAP confluence** creates stronger levels
### **Multi-Timeframe Analysis:**
- **Level confluence**: Multiple timeframes aligning creates stronger zones
- **Trend context**: Higher timeframe levels provide broader market context
- **Entry/Exit planning**: Previous period levels help plan trades
## 🎨 **Visual Organization**
### **Color Coding:**
- **Blue**: Daily levels (default)
- **Yellow**: Weekly levels (default)
- **Purple**: Monthly levels (default)
- **Red**: Yearly levels (default)
- **Transparency**: Previous period levels shown in lighter shades
### **Line Styles:**
- **Solid lines**: Current period highs/lows
- **Dashed lines**: Opening levels
- **Dotted lines**: Previous period levels
- **Thick lines**: VWAP plots (2px width)
## 🔍 **Unique Features**
1. **Custom VWAP calculations** for weekly/monthly/yearly periods
2. **Intelligent table display** that only shows active levels
3. **Comprehensive customization** without overwhelming interface
4. **Performance optimized** with conditional rendering
5. **Professional presentation** with watermark and clean styling
This indicator is particularly valuable for traders who use multiple timeframe analysis and want a clean, organized way to visualize key price levels and volume-based averages all in one tool.
Market Session Lines + Labels (No Duplicates, Working)Shows Asian Open, Midnight, London Open, NY Open lines on your chart.

S&P 2009: M7 vs. Rest of S&P500Thanks Omnibus for open sourcing your code, in your indicator S&P 2024: Magnificent 7 vs. the rest of S&P (User can look at his indicator name to see Omnibus' description). I just updated the code here to include start date 2009/01/01 at the start of the Global Financial Crisis.

Multiple Custom Sessions - Highs/LowsMultiple Custom Sessions - Highs/Lows
This indicator allows you to track and visualize the high and low price ranges for up to 4 customizable sessions on your chart.
🔹 Set your own session times and UTC offsets
🔹 Customize colors for high/low lines and the session’s background box
🔹 Toggle each session’s visibility independently
🔹 Automatically updates highs and lows as the session progresses
🔹 Alerts for when each session starts and ends
Ideal for opening range breakout strategies, session-based scalping, or tracking key market windows like London, New York, Asia sessions.
💡 Fully adjustable for any asset or timeframe.
Credit to the original work by Zeiierman — upgraded to handle multiple concurrent sessions in one clean script.
Enjoy and trade smart!

TuxAlgo - Trending CandlesTuxAlgo – Trending Candles is a minimalistic yet powerful tool that visually highlights trend direction directly on the chart. It dynamically colors candles based on live trend calculations and gives traders the ability to fine-tune sensitivity, timeframe, and visual signals — making it ideal for scalping, intraday, and swing trading.
Green candles show bullish trend
Red candles show bearish trend
Bullish / Bearish Signal Labels
Precision Setting
Choose between Low, Medium, or High precision
Higher precision gives faster signal changes, while lower provides smoother trends
Use Candles or switch to Oscillator-based trend detection

Session SizeAnalyze previous Sessions Size (Asia, London, New York) and give back the average range size in points.
Great tool if you want to take seriously the time and price

TuxAlgo - Gold ProTuxAlgo - Gold Pro is a specialized scalping indicator designed exclusively for Gold (XAU/USD). This tool is tailored for intraday and scalping traders who need fast, reliable signals with clearly defined exits and built-in trade performance tracking.
How It Works:
Buy/Sell Signals:
The indicator provides accurate Buy and Sell signals based on internal momentum logic optimized for Gold (XAU/USD).
Target-Based Exits:
You can set a custom target point. The system calculates and suggests the exit point once that target is reached.
Profit Signal:
A Profit label appears only when the trade successfully hits the set target, confirming the completion of a profitable move.
Exit Signal:
If the price moves against the trade, the indicator suggests a exit point to help minimize loss.

Initial balance - weeklyWeekly Initial Balance (IB) — Indicator Description
The Weekly Initial Balance (IB) is the price range (High–Low) established during the week’s first trading session (most commonly Monday). You can measure it over the entire day or just the first X hours (e.g. 60 or 120 minutes). Once that session ends, the IB High and IB Low define the key levels where the initial weekly range formed.
Why Measure the Weekly IB?
Week-Opening Sentiment:
Monday’s range often sets the tone for the rest of the week. Trading above the IB High signals bullish control; trading below the IB Low signals bearish control.
Key Liquidity Zones:
Large institutions tend to place orders around these extremes, so you’ll frequently see tests, breakouts, or rejections at these levels.
Support & Resistance:
The IB High and IB Low become natural barriers. Price will often return to them, bounce off them, or break through them—ideal spots for entries and exits.
Volatility Forecast:
The width of the IB (High minus Low) indicates whether to expect a volatile week (wide IB) or a quieter one (narrow IB).
Significance of IB Levels
Breakout:
A clear break above the IB High (for longs) or below the IB Low (for shorts) can ignite a strong trending move.
Fade:
A rejection off the IB High/Low during low momentum (e.g. low volume or pin-bar formations) offers a high-probability reversal trade.
Mid-Point:
The 50% level of the IB range often “magnetizes” price back to it, providing entry points for continuation or reversal strategies.
Three Core Monday IB Strategies
A. Breakout (Open-Range Breakout)
Entry: Wait for 1–2 candles (e.g. 5-minute) to close above IB High (long) or below IB Low (short).
Stop-Loss: A few pips below IB High (long) or above IB Low (short).
Profit-Target: 2–3× your risk (Reward:Risk ≥ 2:1).
Best When: You spot a clear impulse—such as a strong pre-open volume spike or news-driven move.
B. Fade (Reversal at Extremes)
Entry: When price tests IB High but shows weakening momentum (shrinking volume, upper-wick candles), enter short; vice versa for IB Low and longs.
Stop-Loss: Just beyond the IB extreme you’re fading.
Profit-Target: Back toward the IB mid-point (50% level) or all the way to the opposite IB extreme.
Best When: Monday’s action is range-bound and lacks a clear directional trend.
C. Mid-Point Trading
Entry: When price returns to the 50% level of the IB range.
In an up-trend: buy if it bounces off mid-point back toward IB High.
In a down-trend: sell if it reverses off mid-point back toward IB Low.
Stop-Loss: Just below the nearest swing-low (for longs) or above the nearest swing-high (for shorts).
Profit-Target: To the corresponding IB extreme (High or Low).
Best When: You see a strong initial move away from the IB, followed by a pullback to the mid-point.
Usage Steps
Configure your session: Measure IB over your chosen Monday timeframe (whole day or first X hours).
Choose your strategy: Align Breakout, Fade, or Mid-Point entries with the current market context (trend vs. range).
Manage risk: Keep risk per trade ≤ 1% of account and maintain at least a 2:1 Reward:Risk ratio.
Backtest & forward-test: Verify performance over multiple Mondays and in a paper-trading environment before going live.

Trading Checklist Overlay (Top-Right, Dark Blue Text, Lowered)This is to remind your Check list before your Execution to stay focused and calm . On Trading Journey coded by chatgpt for my private preferance.

PMI Crude Oil Special (Intraday) 5 MinsThis is a Special Strategy for Crude Oil Intraday to be used on 5 Minutes Chart.
We are not a SEBI-registered investment or financial advisor. Strategies should not be followed solely based on past performance. Profit and loss are part of the trading business and Back testing is a feature of Trading View and we show it only for informational and educational purposes.
Conducting paper trading for at least one month is highly recommended to understand strategy behavior.
Please note that trading strategies are not a shortcut to becoming wealthy, and a disciplined approach is essential for long-term results.

PMI Banknifty Blaster (Intraday) 5 MinsThis is a Special Strategy for Bank Nifty Intraday to be used on 5 Minutes Chart.
We are not a SEBI-registered investment or financial advisor. Strategies should not be followed solely based on past performance. Profit and loss are part of the trading business and Back testing is a feature of Trading View and we show it only for informational and educational purposes.
Conducting paper trading for at least one month is highly recommended to understand strategy behavior.
Please note that trading strategies are not a shortcut to becoming wealthy, and a disciplined approach is essential for long-term results.
