Double Purge Theory (DPT)The purpose of this script is to identify the Double Purge Theory-MMXM i.e. the run on liquidity on both the sell-side and the buy-side liquidity.
The simple use case behind this script is to provide additional entry confluence for your trade setups and more efficient stop loss placement on any given timeframe.
DPT in itself is a price signature that generally occurs before price makes impulsive move in the direction of the higher time frame narrative. It is not to be used as a standalone indicator for building narrative/framing bias.
How to use this script ?
1) Wait for the indicator to display the BLUE CANDLE highlight (DPT candle) that indicates the double purge has occurred.
2) The DPT should occur at/after price has tapped into a key level and is within the ICT killzones.
3) Position to frame your trade setup once you get a candle with a body close below / above the DPT candle , depending on your bias and stop loss placement at DPT candle high/low or after the body closure as mentioned in step 2.
For example :
Educational

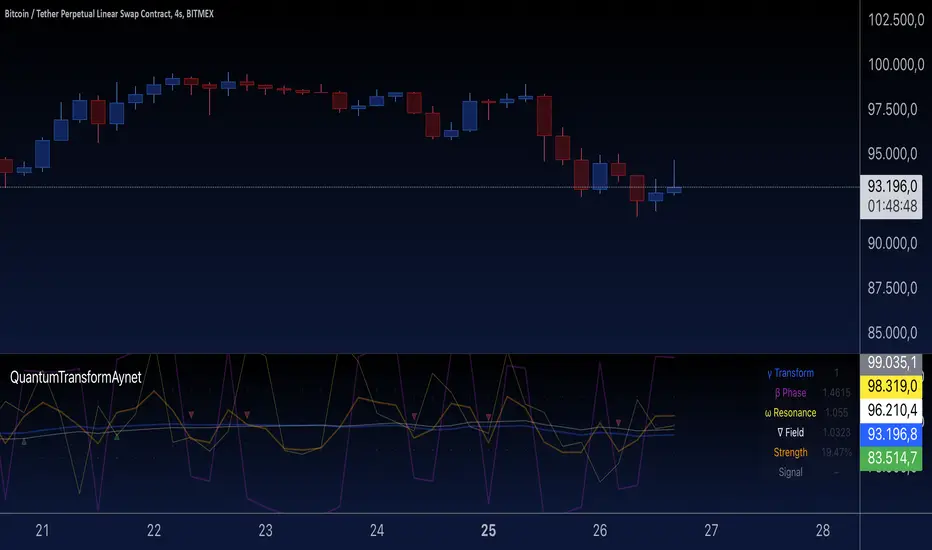
Quantum Transform - AynetQuantum Transform Trading Indicator: Explanation
This script is called a "Quantum Transform Trading Indicator" and aims to enhance market analysis by applying complex mathematical models. Written in Pine Script, the indicator includes the following elements:
1. General Structure
Quantum Parameters: Inspired by physical and mathematical concepts (Planck constant ℏ, wave function Ψ, time τ, etc.), it uses specific parameters.
Transformation Functions: Applies various mathematical operations to transform price data in different ways.
Signal Generation: Produces signals for long and short positions.
Visualization: Displays different price transformations and signals on the chart.
2. Core Parameters
The parameters allow users to control various transformations:
Planck Constant (ℏ): A scaling factor for wave modulation.
Wave (Ψ): Controls oscillation in price data.
Time (τ): The length of the lookback period for calculations.
Relativity (γ): Power factor in the Lorentz transformation.
Phase Shift (β): Manages phase shift in transformations.
Frequency (ω): Represents the frequency of price movements.
Dimensions (∇): Enables multi-dimensional field analysis.
3. Functions
a) Relativistic Transform
Inspired by the theory of relativity.
Calculates the Lorentz factor using the rate of price change.
Transforms price data to amplify the relativity effect.
b) Phase Transform
Calculates the phase of price data and applies wave modulation.
Creates phase and amplitude modulation based on the bar index.
c) Resonance Transform
Calculates resonance effects using natural frequency and oscillations.
Highlights periodic behaviors of price movements.
d) Field Transform
Applies multi-dimensional field calculations.
Combines strength, wave, and coherence aspects of price data.
e) Chaos Transform
Implements a chaos effect based on sensitivity analysis.
Simulates chaotic behaviors of price movements.
4. Main Calculations
Quantum Price: The average of all transformation functions.
Bands:
Upper Band: The highest level of quantum price.
Lower Band: The lowest level of quantum price.
Mid Band: The average of upper and lower bands.
Momentum: Calculates the rate of change in quantum price.
5. Signal Generation
Long Signal:
Triggered when the phase price crosses above the field price.
Momentum must be positive, and the price above the mid-band.
Short Signal:
Triggered when the phase price crosses below the field price.
Momentum must be negative, and the price below the mid-band.
Signal strength is calculated relative to the momentum moving average.
6. Visualization
Each transformation is displayed in a unique color.
Bands and Momentum: Visualize price behavior.
Signal Icons: Show buy/sell signals using up/down arrows on the chart.
7. Information Panel
A table in the top-right corner of the chart displays:
The current values of each transformation.
Signal strength (as a percentage).
The type of signal (⬆: Long, ⬇: Short).
Applications
Trend Following: Analyze trends with complex transformations.
Resonance and Chaos Analysis: Understand dynamic behaviors of price.
Signal Strategies: Create strong and reliable buy/sell signals.
If you have any additional questions or customization requests regarding this indicator, feel free to ask!
Azlan MA Silang PLUS++Overview
Azlan MA Silang PLUS++ is an advanced moving average crossover trading indicator designed for traders who want to jump back into the market when they missed their first opportunity to take a trade. It implements a sophisticated dual moving average system with customizable settings and re-entry signals, making it suitable for both trend following and swing trading strategies.
Key Features
• Dual Moving Average System with multiple MA types (EMA, SMA, WMA, LWMA)
• Customizable price sources for each moving average
• Smart re-entry system with configurable maximum re-entries
• Visual signals with background coloring and shape markers
• Comprehensive alert system for both initial and re-entry signals
• Flexible parameter customization through input options
Input Parameters
Moving Average Configuration
• MA1 Type: Choice between SMA, EMA, WMA, LWMA (default: EMA)
• MA2 Type: Choice between SMA, EMA, WMA, LWMA (default: EMA)
• MA1 Length: Minimum value 1 (default: 8)
• MA2 Length: Minimum value 1 (default: 15)
• MA1 & MA2 Shift: Offset values for moving averages
• Price Sources: Configurable for each MA (Open, High, Low, Close, HL/2, HLC/3, HLCC/4)
Re-entry System
• Enable/Disable re-entry signals
• Maximum re-entries allowed (default: 3)
Technical Implementation
Price Source Calculation
The script implements a flexible price source system through the price_source() function:
• Supports standard OHLC values
• Includes compound calculations (HL/2, HLC/3, HLCC/4)
• Defaults to close price if invalid source specified
Moving Average Types
Implements four MA calculations:
1. SMA (Simple Moving Average)
2. EMA (Exponential Moving Average)
3. WMA (Weighted Moving Average)
4. LWMA (Linear Weighted Moving Average)
Signal Generation Logic
Initial Signals
• Buy Signal: MA1 crosses above MA2 with price above both MAs
• Sell Signal: MA1 crosses below MA2 with price below both MAs
Re-entry Signals
Re-entry system activates when:
1. Price crosses under MA1 in buy mode (or over in sell mode)
2. Price returns to cross back over MA1 (or under for sells)
3. Position relative to MA2 confirms trend direction
4. Number of re-entries hasn't exceeded maximum allowed
Visual Components
• MA1: Blue line (width: 2)
• MA2: Red line (width: 2)
• Background Colors:
o Green (60% opacity): Bullish conditions
o Red (60% opacity): Bearish conditions
• Signal Markers:
o Initial Buy/Sell: Up/Down arrows with "BUY"/"SELL" labels
o Re-entry Buy/Sell: Up/Down arrows with "RE-BUY"/"RE-SELL" labels
Alert System
Generates alerts for:
• Initial buy/sell signals
• Re-entry opportunities
• Alerts include ticker and timeframe information
• Configured for once-per-bar-close frequency
Usage Tips
1. Moving Average Selection
o Shorter periods (MA1) capture faster moves
o Longer periods (MA2) identify overall trend
o EMA responds faster to price changes than SMA
2. Re-entry System
o Best used in strong trending markets
o Limit maximum re-entries based on market volatility
o Monitor price action around MA1 for potential re-entry points
3. Risk Management
o Use additional confirmation indicators
o Set appropriate stop-loss levels
o Consider market conditions when using re-entry signals
Code Structure
The script follows a modular design with distinct sections:
1. Input parameter definitions
2. Helper functions for price and MA calculations
3. Main signal generation logic
4. Visual elements and plotting
5. Alert system implementation
This organization makes the code maintainable and easy to modify for custom needs.

Relative Momentum StrengthThe Relative Momentum Strength (RMS) indicator is designed to help traders and investors identify tokens with the strongest momentum over two customizable timeframes. It calculates and plots the percentage price change over 30-day and 90-day periods (or user-defined periods) to evaluate a token's relative performance.
30-Day Momentum (Green Line): Short-term price momentum, highlighting recent trends and movements.
90-Day Momentum (Blue Line): Medium-term price momentum, providing insights into broader trends.
This tool is ideal for comparing multiple tokens or assets to identify those showing consistent strength or weakness. Use it to spot outperformers and potential reversals in a competitive universe of assets.
How to Use:
Apply this indicator to your TradingView chart for any token or asset.
Look for tokens with consistently high positive momentum for potential strength.
Use the plotted values to compare relative performance across your watchlist.
Customization:
Adjust the momentum periods to suit your trading strategy.
Overlay it with other indicators like RSI or volume for deeper analysis.

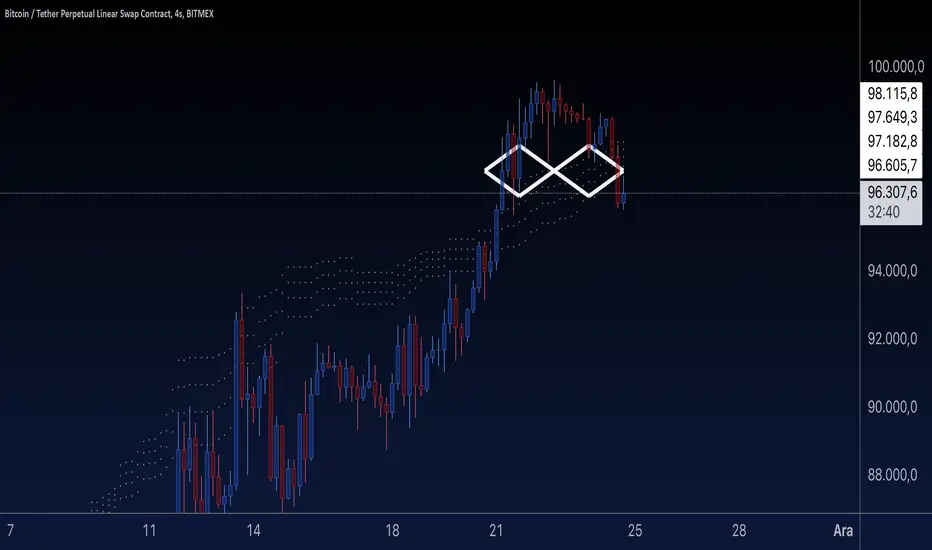
3 Drive Harmonic Pattern [TradingFinder] Three Drive Reversal🔵 Introduction
The Three Drive harmonic pattern closely resembles other price structures such as Wedge Pattern and Three Push Pattern, yet it stands out due to its precise use of Fibonacci ratios and symmetrical price movements.
This pattern comprises three consecutive and symmetrical price drives, each validated by key Fibonacci ratios (1.27 and 1.618), which help identify critical Potential Reversal Zones (PRZ).
Unlike the Wedge, which relies on converging trend lines and can indicate either continuation or reversal, and the Three Push, which lacks defined Fibonacci ratios and symmetry, the Three Drive pattern defines PRZ with greater accuracy, providing traders with high-probability trading opportunities.
This pattern appears in both bullish and bearish trends. After the completion of the third drive (Drive 3), it signals the market's readiness to reverse direction. The PRZ in this pattern serves as a crucial zone where price is highly likely to reverse, offering a strategic point for entering or exiting trades. Professional traders utilize the Three Drive pattern and PRZ as essential tools for analyzing and capitalizing on potential market reversals.
Bullish Pattern :
Bearish Pattern :
🔵 How to Use
The Three Drive harmonic pattern is an effective tool for identifying potential reversal points in the market. By utilizing Fibonacci extension levels (1.27 and 1.618) and focusing on the pattern’s symmetry, traders can pinpoint Potential Reversal Zones (PRZ) where the price is likely to change direction. This pattern works in both bearish and bullish scenarios, each with distinct characteristics and trading opportunities.
🟣 Bullish Three Drive Pattern
The bullish Three Drive pattern develops during a downtrend, indicating a potential reversal to the upside. Similar to its bearish counterpart, this pattern features three consecutive downward price movements (drives) with retracements in between. The third drive concludes within the PRZ, which serves as a strong support zone where the price is expected to reverse upwards.
The first drive begins with a downward movement, followed by a retracement to the 0.618 Fibonacci level. The second drive continues downward to reach a 1.27 or 1.618 Fibonacci extension of the retracement. Finally, the third drive aligns with the PRZ, where a confluence of Fibonacci levels creates a high-probability support zone.
In the PRZ, traders look for bullish confirmation signals such as bullish candlestick patterns (e.g., bullish engulfing or pin bars) or increasing trading volume. Once confirmation is observed, the PRZ becomes an ideal entry point for a buy position. Stop-loss orders are placed slightly below the PRZ to minimize risk, while take-profit targets are set at key resistance levels or Fibonacci retracement levels.
🟣 Bearish Three Drive Pattern
The bearish Three Drive pattern forms during an uptrend, signaling a potential reversal to the downside. This pattern consists of three consecutive upward price movements (drives) and intermediate retracements. Each drive aligns with Fibonacci extension levels, and the third drive ends within the PRZ, indicating a high probability of a bearish reversal.
In the first drive, the price moves upward and then retraces to approximately the 0.618 Fibonacci retracement level, forming the base for the second drive. The second drive then extends upward to the 1.27 or 1.618 Fibonacci extension of the preceding retracement. This process repeats for the third drive, which reaches the PRZ, typically defined by the convergence of Fibonacci levels from previous drives.
Once the PRZ is identified, traders look for confirmation signals such as bearish candlestick patterns (e.g., bearish engulfing or pin bars) or declining trading volume. If confirmation is present, the PRZ becomes an optimal zone for entering a sell position. Stop-loss levels are typically placed slightly above the PRZ to protect against pattern failure, and take-profit targets are set at key support levels or Fibonacci retracement levels of the overall structure.
🟣 Three Drive Vs Wedge Pattern Vs 3 Push pattern
The Three Drive, Wedge, and Three Push patterns are all used to identify potential price reversal points, but they differ significantly in structure and application. The Three Drive pattern is based on three consecutive and symmetrical price movements, validated by precise Fibonacci ratios (1.27 and 1.618), to define Potential Reversal Zones (PRZ).
In contrast, the Wedge pattern relies on converging trend lines and does not require Fibonacci ratios; it can act as either a reversal or continuation pattern. Meanwhile, the Three Push pattern shares similarities with Three Drive but lacks precise symmetry and Fibonacci-based validation.
Instead of a PRZ, Three Push focuses on identifying areas of support and resistance, often signaling weakening momentum in the current trend. Among these, the Three Drive pattern is more reliable for pinpointing high-probability reversal zones due to its strict Fibonacci-based and symmetrical structure.
🔵 Setting
🟣 Logical Setting
ZigZag Pivot Period : You can adjust the period so that the harmonic patterns are adjusted according to the pivot period you want. This factor is the most important parameter in pattern recognition.
Show Valid Format : If this parameter is on "On" mode, only patterns will be displayed that they have exact format and no noise can be seen in them. If "Off" is, the patterns displayed that maybe are noisy and do not exactly correspond to the original pattern.
Show Formation Last Pivot Confirm : if Turned on, you can see this ability of patterns when their last pivot is formed. If this feature is off, it will see the patterns as soon as they are formed. The advantage of this option being clear is less formation of fielded patterns, and it is accompanied by the latest pattern seeing and a sharp reduction in reward to risk.
Period of Formation Last Pivot : Using this parameter you can determine that the last pivot is based on Pivot period.
🟣 Genaral Setting
Show : Enter "On" to display the template and "Off" to not display the template.
Color : Enter the desired color to draw the pattern in this parameter.
LineWidth : You can enter the number 1 or numbers higher than one to adjust the thickness of the drawing lines. This number must be an integer and increases with increasing thickness.
LabelSize : You can adjust the size of the labels by using the "size.auto", "size.tiny", "size.smal", "size.normal", "size.large" or "size.huge" entries.
🟣 Alert Setting
Alert : On / Off
Message Frequency : This string parameter defines the announcement frequency. Choices include: "All" (activates the alert every time the function is called), "Once Per Bar" (activates the alert only on the first call within the bar), and "Once Per Bar Close" (the alert is activated only by a call at the last script execution of the real-time bar upon closing). The default setting is "Once per Bar".
Show Alert Time by Time Zone : The date, hour, and minute you receive in alert messages can be based on any time zone you choose. For example, if you want New York time, you should enter "UTC-4". This input is set to the time zone "UTC" by default.
🔵 Conclusion
The Three Drive pattern is a highly effective harmonic tool for identifying potential reversal points in the market. By leveraging its symmetrical structure and precise Fibonacci ratios (1.27 and 1.618), this pattern provides traders with clear entry and exit signals, enhancing the accuracy of their trades.
Whether in bullish or bearish scenarios, the identification of the Potential Reversal Zone (PRZ) serves as a critical aspect of this pattern, enabling traders to anticipate price movements with greater confidence.
Compared to similar patterns like Wedge and Three Push, the Three Drive pattern stands out for its stringent reliance on Fibonacci levels and symmetrical price movements, making it a more robust choice for forecasting reversals. However, as with any technical analysis tool, its effectiveness increases when combined with confirmation signals, such as candlestick patterns, volume analysis, and broader market context.
Mastering the Three Drive pattern requires practice and attention to detail, especially in accurately defining the PRZ and ensuring the pattern adheres to its criteria. Traders who consistently apply this pattern as part of a comprehensive trading strategy can capitalize on high-probability opportunities and improve their overall performance in the market.

Crypto Index Creator (MEMES & AI Supercycle Dominance, etc)This indicator aims to help to create any INDEX desired including but not limited to its Market Cap and Dominance on the crypto market.
This script was inspired originally by Murad's "Memecoins Dominance" but then I extended it to AI and can be extended to anything in fact, so you can create any index!
I made each token entry editable so that the script can survive the evolution of time as likely projects and INDEXES are going to change a lot, so that you can add/modify your own indices of preference if not listed by default and in order to make it future proof.
You can play with the settings, can compare to BTC, ETC, SOL, etc. for helping in your studies
You also have the option to check the info of each symbol on a table available on the settings, in order to help you figure out if there are any errors and also help you to easily check how the symbols are performing individually
Notes:
- Many projects are not like MEMECOINS that have fixed supply, normally VC projects have a very variable circulating supply, so you might want to update the info of the circulating supply for your projects to make it more accurate if you desire.
- For this script there is a limit of 32 Symbols, due to tradingview own limits, yet you can always "add" multiple projects per line as long as their circulating supply is the same.
- You might want to edit/sort the tickers of the top3, top5 and top10 if they follow bellow those top ranks, but this is not necessary if you don't care about Top 3-10 specific calculations.
- My default "indices" were made of token selections of mine as of November 2024, those defaults indices/tickers I might or might not update them eventually but you are free to adapt/modify the tickers in the settings as history evolves, and you can leave your own indexes on the comment section of this post for others to use
- As you might not be able to create/store multiple different indexes at the same time, you might want to add this indicator multiple times on your screen and then modify the tickers of each instance of this indicator, by that you can have multiple indexes.

Daily PlayDaily Play Indicator
The Daily Play Indicator is a clean and versatile tool designed to help traders organize and execute their daily trading plan directly on their charts. This indicator simplifies your workflow by visually displaying key inputs like market trend, directional bias, and key levels, making it easier to focus on your trading strategy.
Features
Dropdown Selection for Trend and Bias:
• Set the overall market trend (Bullish, Bearish, or Neutral) and your directional bias (Long, Short, or Neutral) using intuitive dropdown menus. No more manual typing or guesswork!
Key Levels:
Quickly input and display the Previous Day High and Previous Day Low. These levels are essential for many trading strategies, such as breakouts.
Real-Time News Notes:
Add a quick note about impactful news or market events (e.g., “Fed meeting today” or “Earnings season”) to keep contextual awareness while trading.
Simple On-Chart Display:
The indicator creates a “table-like” structure on the chart, aligning your inputs in an easy-to-read format. The data is positioned dynamically so it doesn’t obstruct the price action.
Customisable Visual Style:
Simple labels with clear text to ensure that your chart remains neat and tidy.
----
Use Case
The Daily Play Indicator is ideal for:
• Day traders and scalpers who rely on precise planning and real-time execution.
• Swing traders looking to mark critical levels and develop a trade plan before the session begins.
• Anyone who needs a structured way to stay focused and disciplined during volatile market conditions.
By integrating this tool into your workflow, you can easily align your daily preparation with live market action.
----
How to Use
Open the indicator settings to configure your inputs:
• Trend: Use the dropdown to choose between Bullish, Bearish, or Neutral.
• Bias: Select Long, Short, or Neutral to align your personal bias with the market.
• Previous Day Levels: Enter the High and Low of the previous trading session for key reference points.
• News: Add a short description of any relevant market-moving events.

TCSE24TCSE24 or Trendband Cycle Special Edition is designed to help create a simple trading plan by identifying potential Entry, Exit, Target Price, and Stop Loss. I use TCSE24 as a guide for short-term swing trading!
Please note, TCSE24 is not a directional indicator but fits better in Trend Following Strategy.
Only work with chart that have volume by default
Signals for Bullish Trade
1. Trendband Below Candlestick
Filled Red with a Purple Line.
2. Cycle Begin
Bar Color: Vivid Green.
Green Circle Above Candlestick: Target Price.
Green Circle Below Candlestick: Pullback Entry.
Red Circle Below Candlestick: Stop Loss.
3. Breakout
Bar Color: Lemon Green.
Green Circle Below Candlestick: Pullback Entry.
Red Circle Below Candlestick: Stop Loss.
4. Broken Minor Support
Bar Color: Yellow.
Price closes below the lowest low of the last 4 candles.
5. Volume Test
Green Triangle-Up below Candlestick.
Current bar shows 3 consecutive falling volumes.
6. Inside Bar
Orange Triangle-Up below Candlestick.
High and low are within the high and low of the previous candlestick.
7. Box Trading
Purple Diamond
8. Cycle End
Bar Color: Red.
Red Triangle-Up below Candlestick.
9. Info Panel
Background Green, turning Yellow after 20 bars from Cycle Begin.
Background Red when Cycle Ends.
Displays info such as Current Price, Target Price, Pullback Price, Stop Loss.
________________________________________
Signals for Bearish Trade
1. Trendband Above Candlestick
Filled with Blue.
2.Short Selling Begin
Bar Color: Blue.
Blue Circle Above Candlestick: Stop Loss.
Blue Circle Below Candlestick: Target Price.
3. Breakdown
Blue Circle Above Candlestick: Stop Loss.
4. Short Selling End
Bar Color: White.
Blue Triangle-Down above Candlestick.
5. Info Panel
Background Blue throughout the trade.
________________________________________
Bullish Trade Entry Suggestions
1. Ensure Cycle Begin is confirmed:
Buy near the closing price.
Use a Buy Stop 2 ticks higher than Cycle Begin's highest price.
Use a Buy Limit at the pullback price.
Wait for a signal candlestick, then Buy the next day if the price rises above the signal candlestick’s high.
2. Ensure Breakout is confirmed:
Buy near the closing price.
Use a Buy Stop 2 ticks higher than Breakout’s highest price.
Use a Buy Limit at the pullback price.
3. Box Trading:
Buy on the third day (T3).
Buy above the Box Trading line.
4. Candlestick Signal:
Ensure the signal candlestick is confirmed:
Look for Doji, Spinning Top, or Hammer patterns.
Buy the next day if the price rises above the signal candle's high.
________________________________________
Bullish Trade Exit Suggestions
1. Target Sell
Sell when the Target Price (TP) is reached or hold as long as Stop Loss isn’t hit.
Sell if the price doesn’t move, doesn’t reach the target, or doesn’t hit the Stop Loss after 20 candles from Cycle Begin.
Sell if the price closes below the Stop Loss.
2. Candlestick Signal
Look for Doji, Spinning Top, or Hammer patterns.
Sell the next day if the price drops below the signal candle's low.
________________________________________
Bearish Trade Suggestions
Ensure Short Selling Signal or Breakdown is confirmed:
Sell near the closing price.
Close the position at Target 1, Target 2, Target 3.
Close the position if Stop Loss is hit or when Short Selling End appears.
________________________________________
Any alert() function call freq
Once_per_bar_close
Cycle Begin, Inside Bar, Doji, Hammer, Spinning Top, Box Trading, Volume Test, Short Selling
Once_per_bar
Breakout, Cycle End
For educational purposes only and should not be taken as advice on how to invest your capital. Always speak with a professional financial planner or advisor before making any investment decisions.

superiority-DivergenceThis indicator is designed to analyze the price behavior of a cryptocurrency simultaneously in two markets: USDT and BTC pairs.
Key Features:
Chart Comparison: Displays the price charts of the cryptocurrency for both the USDT and BTC pairs simultaneously.
Divergence Detection: Automatically identifies and highlights divergences between the two charts.
Useful for Technical Analysis: Helps you evaluate the relative price movements across the two markets and identify potential trading opportunities.
Advantages:
Ideal for professional traders looking to analyze correlations and divergences between different markets.
Helps reduce decision-making risk by providing a detailed view of price behavior in both pairs.
How to Use:
Add this indicator to the chart of the cryptocurrency you want to analyze.
The second chart (BTC pair) will be displayed below. Any detected divergence will be visually highlighted.
Use the identified divergences to confirm or refine your trading strategies.

Mean Price
^^ Plotting switched to Line.
This method of financial time series (aka bars) downsampling is literally, naturally, and thankfully the best you can do in terms of maximizing info gain. You can finally chill and feed it to your studies & eyes, and probably use nothing else anymore.
(HL2 and occ3 also have use cases, but other aggregation methods? Not really, even if they do, the use cases are ‘very’ specific). Tho in order to understand why, you gotta read the following wall, or just believe me telling you, ‘I put it on my momma’.
The true story about trading volumes and why this is all a big misdirection
Actually, you don’t need to be a quant to get there. All you gotta do is stop blindly following other people’s contextual (at best) solutions, eg OC2 aggregation xD, and start using your own brain to figure things out.
Every individual trade (basically an imprint on 1D price space that emerges when market orders hit the order book) has several features like: price, time, volume, AND direction (Up if a market buy order hits the asks, Down if a market sell order hits the bids). Now, the last two features—volume and direction—can be effectively combined into one (by multiplying volume by 1 or -1), and this is probably how every order matching engine should output data. If we’re not considering size/direction, we’re leaving data behind. Moreover, trades aren’t just one-price dots all the time. One trade can consume liquidity on several levels of the order book, so a single trade can be several ticks big on the price axis.
You may think now that there are no zero-volume ticks. Well, yes and no. It depends on how you design an exchange and whether you allow intra-spread trades/mid-spread trades (now try to Google it). Intra-spread trades could happen if implemented when a matching engine receives both buy and sell orders at the same microsecond period. This way, you can match the orders with each other at a better price for both parties without even hitting the book and consuming liquidity. Also, if orders have different sizes, the remaining part of the bigger order can be sent to the order book. Basically, this type of trade can be treated as an OTC trade, having zero volume because we never actually hit the book—there’s no imprint. Another reason why it makes sense is when we think about volume as an impact or imbalance act, and how the medium (order book in our case) responds to it, providing information. OTC and mid-spread trades are not aggressive sells or buys; they’re neutral ticks, so to say. However huge they are, sometimes many blocks on NYSE, they don’t move the price because there’s no impact on the medium (again, which is the order book)—they’re not providing information.
... Now, we need to aggregate these trades into, let’s say, 1-hour bars (remember that a trade can have either positive or negative volume). We either don’t want to do it, or we don’t have this kind of information. What we can do is take already aggregated OHLC bars and extract all the info from them. Given the market is fractal, bars & trades gotta have the same set of features:
- Highest & lowest ticks (high & low) <- by price;
- First & last ticks (open & close) <- by time;
- Biggest and smallest ticks <- by volume.*
*e.g., in the array ,
2323: biggest trade,
-1212: smallest trade.
Now, in our world, somehow nobody started to care about the biggest and smallest trades and their inclusion in OHLC data, while this is actually natural. It’s the same way as it’s done with high & low and open & close: we choose the minimum and maximum value of a given feature/axis within the aggregation period.
So, we don’t have these 2 values: biggest and smallest ticks. The best we can do is infer them, and given the fact the biggest and smallest ticks can be located with the same probability everywhere, all we can do is predict them in the middle of the bar, both in time and price axes. That’s why you can see two HL2’s in each of the 3 formulas in the code.
So, summed up absolute volumes that you see in almost every trading platform are actually just a derivative metric, something that I call Type 2 time series in my own (proprietary ‘for now’) methods. It doesn’t have much to do with market orders hitting the non-uniform medium (aka order book); it’s more like a statistic. Still wanna use VWAP? Ok, but you gotta understand you’re weighting Type 1 (natural) time series by Type 2 (synthetic) ones.
How to combine all the data in the right way (khmm khhm ‘order’)
Now, since we have 6 values for each bar, let’s see what information we have about them, what we don’t have, and what we can do about it:
- Open and close: we got both when and where (time (order) and price);
- High and low: we got where, but we don’t know when;
- Biggest & smallest trades: we know shit, we infer it the way it was described before.'
By using the location of the close & open prices relative to the high & low prices, we can make educated guesses about whether high or low was made first in a given bar. It’s not perfect, but it’s ultimately all we can do—this is the very last bit of info we can extract from the data we have.
There are 2 methods for inferring volume delta (which I call simply volume) that are presented everywhere, even here on TradingView. Funny thing is, this is actually 2 parts of the 1 method. I wonder how many folks see through it xD. The same method can be used for both inferring volume delta AND making educated guesses whether high or low was made first.
Imagine and/or find the cases on your charts to understand faster:
* Close > open means we have an up bar and probably the volume is positive, and probably high was made later than low.
* Close < open means we have a down bar and probably the volume is negative, and probably low was made later than high.
Now that’s the point when you see that these 2 mentioned methods are actually parts of the 1 method:
If close = open, we still have another clue: distance from open/close pair to high (HC), and distance from open/close pair to low (LC):
* HC < LC, probably high was made later.
* HC > LC, probably low was made later.
And only if close = open and HC = LC, only in this case we have no clue whether high or low was made earlier within a bar. We simply don’t have any more information to even guess. This bar is called a neutral bar.
At this point, we have both time (order) and price info for each of our 6 values. Now, we have to solve another weighted average problem, and that’s it. We’ll weight prices according to the order we’ve guessed. In the neutral bar case, open has a weight of 1, close has a weight of 3, and both high and low have weights of 2 since we can’t infer which one was made first. In all cases, biggest and smallest ticks are modeled with HL2 and weighted like they’re located in the middle of the bar in a time sense.
P.S.: I’ve also included a "robust" method where all the bars are treated like neutral ones. I’ve used it before; obviously, it has lesser info gain -> works a bit worse.
Diamonds Infiniti - Aynet FiboThe "Diamonds Infiniti - Aynet Fibo" Pine Script combines the geometric visualization of diamond patterns with Fibonacci retracement levels to create an innovative technical indicator for analyzing market trends and potential reversal points. Below is a detailed explanation of the code and its functionality:
Key Features
Dynamic Fibonacci Levels
High and Low Points: The script calculates the highest high and lowest low over a user-defined lookback period (lookback) to establish a price range.
Fibonacci Price Levels: Using the defined price range, the script calculates the Fibonacci retracement levels (0%, 23.6%, 38.2%, 50%, 61.8%, 100%) relative to the low point.
Trend Change Detection
Crossovers and Crossunders: The script monitors whether the closing price crosses over or under the calculated Fibonacci levels. This detection is encapsulated in the isTrendChange function.
Trend Signal: If a trend change occurs at any of the Fibonacci levels (23.6%, 38.2%, 50%, 61.8%), the script flags it as a trend change and stores the bar index of the last signal.
Diamond Pattern Visualization
Diamond Construction: The drawDiamond function draws a diamond shape at a given bar index using a central price, a top price, and a bottom price.
Trigger for Drawing Diamonds: When a trend change is detected, the script draws two diamonds—one on the left and one on the right—connected by a central line. The diamonds are based on the calculated price range (price_range) and a user-defined pattern height (patternHeight).
Fibonacci Level Visualization
Overlay of Fibonacci Levels: The script plots the calculated Fibonacci levels (23.6%, 38.2%, 50%, 61.8%) on the chart as dotted lines for easier visualization.
Scientific and Trading Use Cases
Trend Visualization:
The diamond pattern visually highlights trend changes around key Fibonacci retracement levels, providing traders with clear indicators of potential reversal zones.
Support and Resistance Zones:
Fibonacci retracement levels are widely recognized as key support and resistance zones. Overlaying these levels helps traders anticipate price behavior in these areas.
Adaptive Trading:
By dynamically recalculating Fibonacci levels and diamond patterns based on the most recent price range, the script adapts to changing market conditions.
Possible Enhancements
Multi-Timeframe Support:
Extend the script to calculate Fibonacci levels and diamond patterns across multiple timeframes for broader market analysis.
Alerts:
Add alerts for when the price crosses specific Fibonacci levels or when a new diamond pattern is drawn.
Additional Patterns:
Include other geometric patterns like triangles or rectangles for further trend analysis.
This script is a powerful visualization tool that combines Fibonacci retracement with unique diamond patterns. It simplifies complex price movements into easily interpretable signals, making it highly effective for both novice and experienced traders.
Fibonacci Renko Trend - AynetThe "Fibonacci Renko Trend - Aynet" Pine Script combines the Renko charting technique with Fibonacci retracement levels to create a highly customizable and adaptive trend-following tool. Below is a detailed explanation of the script and its components:
Scientific and Trading Applications
Noise Reduction:
By using Renko charts, the script filters out time-based noise and focuses solely on price movement, making it ideal for trend-following strategies.
Adaptability:
The ATR-based box size ensures that the Renko blocks automatically adjust to market volatility, making the tool versatile for different market conditions and asset classes.
Fibonacci-Based Decision Making:
The integration of Fibonacci retracement levels provides a structured framework for identifying key support and resistance levels. Traders can use these levels to anticipate price reversals or continuations.
Visualization:
The color-coded Renko blocks allow traders to quickly identify trends and potential reversals without additional indicators, improving decision-making efficiency.
Possible Improvements
Signal Generation:
Add entry and exit signals when price crosses significant Fibonacci levels or when a trend reversal is detected.
Multi-Timeframe Support:
Extend the script to compute Renko levels and Fibonacci ratios for multiple timeframes simultaneously.
Alerts:
Implement alert notifications for key events, such as trend changes or Fibonacci level breaches.
This script is a robust tool for traders looking to combine the simplicity of Renko charts with the analytical power of Fibonacci retracement levels. It offers a clear visualization of price trends and potential reversal points, making it suitable for both novice and experienced traders.

BTC Seasonality Strategy (Weekly)This strategy identifies potential weekend opportunities in Bitcoin (BTC) markets by leveraging the concept of seasonality, entering a position at a predefined time and day, and exiting at a specified time and day.
Key Features
Customizable Time and Day Selection:
Users can select the entry and exit days and corresponding times (in EST).
Directional Flexibility:
The strategy allows traders to choose between long or short positions.
TradingView Compliance:
The script adheres to TradingView's house rules, avoids overly complex conditions, and provides clear user-configurable inputs.
How It Works
The script determines the current weekday and hour in EST, converting TradingView's UTC time for accurate comparisons.
If the current day and hour match the selected entry conditions, a trade (long or short) is opened.
The position is closed when the current day and hour match the specified exit conditions.
Theoretical Basis
Market Seasonality:
The concept of seasonality in financial markets refers to predictable patterns based on time, such as weekends or specific days of the week. Studies have shown that cryptocurrency markets exhibit unique trading behaviors during weekends due to reduced institutional activity and higher retail participation behavioral Biases**:
Retail traders often dominate weekend markets, potentially causing predictable inefficiencies .
Reverences**
Baur, D. G., Hong, K., & Lee, A. D. (2018). Bitcoin: Medium of exchange or speculative assets? Journal of International Financial Markets, Institutions and Money, 54, 177–189.
Urquhart, A. (2016). The inefficiency of Bitcoin. Economics Letters, 148, 80–82.

Alans Date Range CalculatorOverview
Setting a date range for backtesting enables you to evaluate your trading strategy under various market conditions. Traders can test a strategy’s performance during specific periods, such as economic downturns, bull markets, or periods of high volatility. This helps assess the trading strategy’s robustness and adaptability across different scenarios.
Specifying years of data instead of just inputting specific start and end dates offers several advantages:
1. **Consistency**: Using a fixed number of years ensures that the testing period is consistent across different strategies or iterations. This makes it easier to compare performance metrics and draw meaningful conclusions.
2. **Flexibility**: Specifying years allows for automatic adjustment of the start date based on the current date or selected end date. This is particularly useful when new data becomes available or when testing on different assets with varying historical data lengths.
3. **Efficiency**: It simplifies updating and retesting strategies. Instead of recalculating specific start dates each time, traders can quickly adjust the number of years to process, making it easier to test strategies over different timeframes.
4. **Comprehensive Analysis**: Broader timeframes defined by years help you evaluate how your strategy performs over multiple market cycles, providing insights into long-term viability and potential weaknesses.
Defining a date range by specifying years allows for more thorough and systematic backtesting, helping traders develop more reliable and effective trading systems.
Alan's Date Range Calculator: A TradingView Pine Script Indicator
Purpose
This Pine Script indicator calculates and displays a date range for backtesting trading strategies. It allows users to specify the number of years to analyze and an end date, then calculates the corresponding start date. Most importantly, users can copy the inputs and function into their own strategies to quickly add a time span feature for backtesting.
Key Features
User-defined input for the number of years to analyze
Customizable end date with a calendar input
Automatic calculation of the start date
Visual display of both start and end dates on the chart
How It Works
User Inputs
Years of Data to Process: An integer input allowing users to specify the number of years for analysis (default: 20, range: 1-100)
End Date: A calendar input for selecting the end date of the analysis period (default: December 31, 2024)
Date Calculation
The script uses a custom function calcStartDate() to determine the start date. It subtracts the specified number of years from the end date's year and sets the start date to January 1st of that year.
Visual Output
The indicator displays two labels on the chart:
Start Date Label: Shows the calculated start date
End Date Label: Displays the user-specified end date
Both labels are positioned horizontally at the bottom of the chart, with the end date label to the right of the start date label.
Applications
This indicator is particularly useful for traders who want to:
Define specific date ranges for backtesting strategies
Quickly visualize the time span of their analysis
Ensure consistent testing periods across different strategies or assets
Customization
Users can easily adjust the analysis period by changing the number of years or selecting a different end date. This flexibility allows for testing strategies across various market conditions and time frames.

Custom Date Range - Return CalculatorCustom Date Range Return Indicator
Overview
This indicator is designed to help traders quickly calculate the percentage return of a particular stock, sector, currency, or cryptocurrency over a custom date range. It simplifies the process of analyzing performance by allowing traders to navigate through multiple charts efficiently and compare returns over different periods.
Key Features
Custom Date Ranges: Traders can input two different date ranges to compare returns. For example, they can view the Year-to-Date (YTD) return versus the return from a recent swing high.
Visual Levels and Labels:
Start-1 Label: Marks the start date of the first input range with a green horizontal line.
Start-2 Label: Marks the start date of the second input range with an orange horizontal line.
End Label: Marks the end date with a red horizontal line. Table positioning can be adjusted from the input.
Performance Comparison: Enables traders to gauge how a stock is performing relative to its benchmark index by comparing returns over two different periods. % Return is Green if positive else Red is Negative.
Usage
Analysis Only: This indicator is intended for analysis purposes and does not provide buy or sell recommendations.
Complementary Tool : Traders should use this indicator in conjunction with other technical indicators and solid fundamental analysis to make informed decisions.
Benefits
Efficiency : Eliminates the need to manually draw price ranges on each chart, allowing traders to quickly assess performance across multiple charts.
Informed Decisions: By comparing returns over different periods, traders can make better-educated decisions about the behavior of an asset in relation to its benchmark.
Important Note
Traders must use their own discretion when analyzing stocks and should consider other technical indicators and fundamental factors before making any trading decisions.

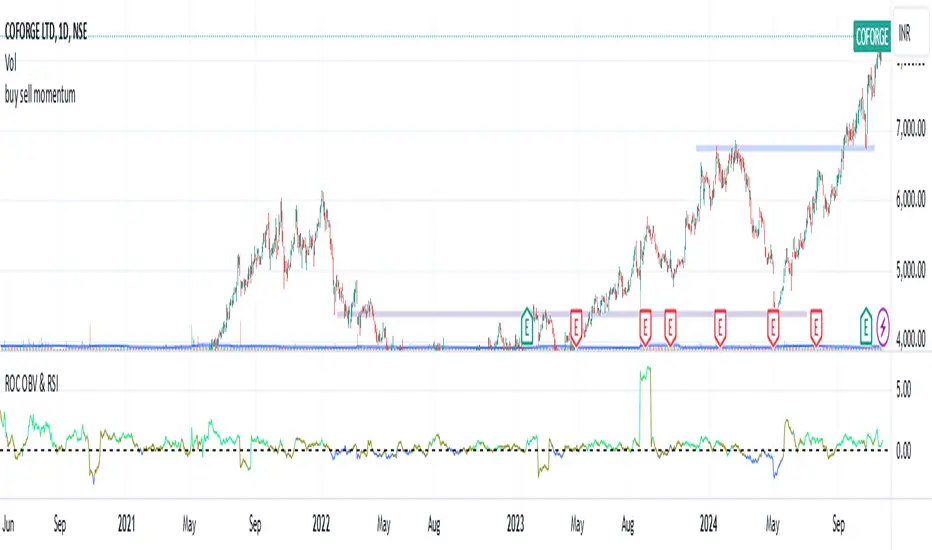
Rate of Change of OBV with RSI ColorThis indicator combines three popular tools in technical analysis : On-Balance Volume (OBV), Rate of Change (ROC), and Relative Strength Index (RSI). It aims to monitor momentum and potential trend reversals based on volume and price changes.
Calculation:
ROC(OBV) = ((OBV(today) - OBV(today - period)) / OBV(today - period)) * 100
This calculates the percentage change in OBV over a specific period. A positive ROC indicates an upward trend in volume, while a negative ROC suggests a downward trend.
What it Monitors:
OBV: Tracks the volume flow associated with price movements. Rising OBV suggests buying pressure, while falling OBV suggests selling pressure.
ROC of OBV:
Measures the rate of change in the OBV, indicating if the volume flow is accelerating or decelerating.
RSI: Measures the strength of recent price movements, indicating potential overbought or oversold conditions.
How it can be Used:
Identifying Trend Continuation: Rising ROC OBV with a rising RSI might suggest a continuation of an uptrend, especially if the color is lime (RSI above 60).
Identifying Trend Reversal: Falling ROC OBV with a declining RSI might suggest a potential trend reversal, especially if the color approaches blue (RSI below 40).
Confirmation with Threshold: The horizontal line (threshold) can be used as a support or resistance level. Bouncing ROC OBV off the threshold with a color change could suggest a pause in the trend but not necessarily a reversal.
When this Indicator is Useful:
This indicator can be useful for assets with strong volume activity, where tracking volume changes provides additional insights.
It might be helpful during periods of consolidation or trend continuation to identify potential breakouts or confirmations.
ICT Macro Sessions by @zeusbottradingICT Macro Sessions Indicator
The ICT Macro Sessions Indicator is a powerful tool designed for traders who follow the ICT (Inner Circle Trader) methodology and want to optimize their trading during specific high-probability time intervals. This indicator highlights all the key macro sessions throughout the trading day in the GMT+8 (Hong Kong) time zone.
What Does the Indicator Do?
This indicator visually marks ICT Macro Sessions on your trading chart using background colors and optional labels. Each session corresponds to specific time intervals when institutional activity is most likely to drive price action. By focusing on these periods, traders can align their strategies with market volatility and liquidity, increasing their chances of success.
Highlighted Sessions
The indicator covers all major ICT Macro Sessions, each with a unique color for easy identification:
London Macro 1 (15:33–16:00 GMT+8):
- Marks the early London session, often characterized by strong directional moves.
London Macro 2 (17:03–17:30 GMT+8):
- Captures the mid-London session, where price frequently reacts to liquidity levels.
New York AM Macro 1 (22:50–23:10 GMT+8):
- Highlights the start of the New York session, a prime time for price reversals or continuations.
New York AM Macro 2 (23:50–00:10 GMT+8):
- Focuses on late-morning New York activity, often aligning with key news releases.
New York Lunch Macro (00:50–01:10 GMT+8):
- Covers the lunch period in New York, where price may consolidate or set up for afternoon moves.
New York PM Macro 1 (02:10–02:40 GMT+8):
- Tracks post-lunch activity in New York, often featuring renewed volatility.
New York PM Macro 2 (04:15–04:45 GMT+8):
- Captures late-session moves as institutional traders finalize their positions.
Features of the Indicator
Fixed Time: The indicator is pre-configured for GMT+8 but it will adapt automatically to your timezone. No need to change anything in the code.
Background Highlighting: Each session is visually marked with a unique background color for quick recognition.
Optional Labels: Traders can enable or disable labels for each session, providing flexibility in how information is displayed.
Session Toggles: You can choose which sessions to display based on your trading preferences and strategy.
Intraday Timeframes: The indicator is optimized for intraday charts with timeframes of 45 minutes or less. You can change it to anything you like.
Why Use This Indicator?
The ICT Macro Sessions Indicator helps traders focus on the most critical times of the trading day when institutional activity is at its peak. These periods often coincide with significant price movements, making them ideal for scalping, day trading, or even swing trading setups. By visually highlighting these sessions, the indicator eliminates guesswork and allows traders to plan their trades with precision.

Optimized Grid with KNN_2.0Strategy Overview
This strategy, named "Optimized Grid with KNN_2.0," is designed to optimize trading decisions using a combination of grid trading, K-Nearest Neighbors (KNN) algorithm, and a greedy algorithm. The strategy aims to maximize profits by dynamically adjusting entry and exit thresholds based on market conditions and historical data.
Key Components
Grid Trading:
The strategy uses a grid-based approach to place buy and sell orders at predefined price levels. This helps in capturing profits from market fluctuations.
K-Nearest Neighbors (KNN) Algorithm:
The KNN algorithm is used to optimize entry and exit points based on historical price data. It identifies the nearest neighbors (similar price movements) and adjusts the thresholds accordingly.
Greedy Algorithm:
The greedy algorithm is employed to dynamically adjust the stop-loss and take-profit levels. It ensures that the strategy captures maximum profits by adjusting thresholds based on recent price changes.
Detailed Explanation
Grid Trading:
The strategy defines a grid of price levels where buy and sell orders are placed. The openTh and closeTh parameters determine the thresholds for opening and closing positions.
The t3_fast and t3_slow indicators are used to generate trading signals based on the crossover and crossunder of these indicators.
KNN Algorithm:
The KNN algorithm is used to find the nearest neighbors (similar price movements) in the historical data. It calculates the distance between the current price and historical prices to identify the most similar price movements.
The algorithm then adjusts the entry and exit thresholds based on the average change in price of the nearest neighbors.
Greedy Algorithm:
The greedy algorithm dynamically adjusts the stop-loss and take-profit levels based on recent price changes. It ensures that the strategy captures maximum profits by adjusting thresholds in real-time.
The algorithm uses the average_change variable to calculate the average price change of the nearest neighbors and adjusts the thresholds accordingly.

Non-Psychological Levels🟩 Non-Psychological Levels is a structural analysis tool that segments price action into objective ranges, identifying Broken and Unbroken levels without relying on psychological or time-based assumptions. By emphasizing mechanically derived price behavior, it provides traders with a clear framework for analyzing support and resistance in a consistent and unbiased manner across various market conditions.
This indicator introduces a new approach to understanding market structure by focusing on price movement within defined segments, free from behavioral patterns, round numbers, or specific time intervals. While the indicator is time-agnostic in design, it works within the natural time progression of the chart, ensuring that segmentation aligns with the inherent structure of price movement. Broken levels, where price has breached a structural boundary, and Unbroken levels, which remain intact, are visualized with horizontal lines. These structural zones are complemented by dynamically boxed segments that contextualize both historical and ongoing price behavior.
By offering an objective perspective, the Non-Psychological Levels indicator complements psychology-based tools, helping traders explore market dynamics from multiple angles. When structural levels align with psychological zones, they reinforce critical price areas; when they differ, they provide opportunities to analyze price behavior from an alternative lens. This indicator is designed as both an educational framework and a practical tool, encouraging a deeper understanding of structural price behavior in technical analysis.
⭕ THEORY AND CONCEPT ⭕
The Non-Psychological Levels indicator is grounded in the principle of analyzing price behavior without reliance on psychological assumptions or time-based factors. Its primary purpose is to provide a structural framework for identifying support and resistance levels by focusing solely on price movement within mechanically defined segments. By removing external influences such as sentiment, time intervals, or market sessions, the indicator offers an unbiased lens through which traders can observe price dynamics.
Non-psychology, as defined here, refers to an approach that excludes behavioral and emotional patterns—like fear, greed, or herd mentality—from price analysis. Traditional tools often depend on these patterns to identify zones such as pivots or Fibonacci retracements, but these methods can be inconsistent in volatile markets. In contrast, the Non-Psychological Levels indicator focuses entirely on what price is doing, free from assumptions about trader behavior or external time constraints.
The indicator’s time-agnostic and mechanically driven design segments price action into consistent ranges, highlighting "Broken" levels (where price breaches structural boundaries) and "Unbroken" levels (where price holds). These structural zones remain unaffected by subjective or external influences, ensuring clarity and consistency across different markets and timeframes. By doing so, the indicator reveals a pure view of price structure, independent of psychological biases.
Importantly, the Non-Psychological Levels indicator is not intended to replace psychology-based tools but to complement them. When its structural levels align with psychological zones like round numbers or session highs/lows, the significance of these areas is reinforced. Conversely, when the levels differ, the contrast provides traders with alternative insights into market dynamics. This dual perspective—blending mechanical objectivity with behavioral analysis—enhances the depth and flexibility of market evaluation.
The following principles outline the theoretical foundation of the indicator and its unique contribution to structural price analysis:
Time-Agnostic Design : The indicator avoids reliance on time-based factors like daily opens, session intervals, or specific events. Instead, it segments price action using bar indexes, ensuring that structural levels are identified independently of external time variables. While the x-axis of a chart inherently represents time, this indicator abstracts away its influence, allowing traders to focus purely on price movement without the bias of temporal context.
Mechanical and Neutral Framework : Every calculation within the indicator is predetermined by a set of mechanical rules, ensuring no subjective input or interpretation affects the results. This objectivity guarantees that levels are derived solely from observed price behavior, providing a reliable framework that traders can trust to remain consistent across different assets, timeframes, and market conditions.
Broken and Unbroken Levels : Broken levels represent zones where price has breached a structural boundary, while Unbroken levels highlight areas where price has consistently respected its range. This distinction provides a clear and systematic method for identifying key support and resistance levels, offering insights into where future price interactions are most likely to occur.
Neutral Price Behavior : By dividing price action into equal segments, the indicator removes the influence of external factors like trader sentiment or psychological expectations. Each segment independently determines significant levels based purely on price action, enabling a structural view of the market that abstracts away behavioral or emotional biases.
Complement to Psychological Tools : While the indicator itself avoids behavioral assumptions, its levels can align with psychological zones like round numbers, pivots, or Fibonacci levels. When these structural and psychological levels overlap, it reinforces the importance of key areas, while divergences offer opportunities to examine price behavior from a new perspective.
Educational Value : The indicator encourages traders to explore the contrast between structural and psychological analysis. By introducing a framework that isolates price behavior from external influences, it challenges traditional methods of technical analysis, fostering deeper insights into market structure and behavior.
🔍 UNDERSTANDING STRUCTURAL LEVELS 🔍
The Non-Psychological Levels indicator offers a straightforward yet powerful way to understand market structure by segmenting price action into mechanically defined ranges. This segmentation highlights two key elements: "Broken" levels, where price has breached structural boundaries, and "Unbroken" levels, which remain intact and respected by price action. Together, these components create a framework for identifying potential areas of support and resistance.
Broken Levels : These are structural boundaries that price has surpassed, indicating areas where previous support or resistance failed. Broken levels often signal transitions in price behavior, such as shifts in momentum or the start of trending movements. They provide insight into zones where price has already tested and moved beyond.
Unbroken Levels : These levels remain intact within a given price segment, marking areas where price has consistently respected boundaries. Unbroken levels are particularly useful for identifying potential reversal points or zones of continued support or resistance. Their persistence across price action often makes them reliable indicators of market structure.
The visual segmentation of price action into distinct ranges allows traders to observe how price transitions between structural zones. For example:
- Clusters of Unbroken levels near the current price may suggest strong support or resistance, offering areas of interest for reversals or breakouts.
- Gaps between Unbroken levels highlight areas of price inefficiency or low interaction, which may become significant if revisited.
By focusing solely on structural price behavior, the Non-Psychological Levels indicator enables traders to analyze price independently of time or psychological factors. This makes it a valuable tool for understanding price dynamics objectively, whether used on its own or alongside other indicators.
🛠️ SETTINGS 🛠️
The Non-Psychological Levels indicator offers various customizable settings to help users tailor its visualization to their specific trading style and market conditions. These settings allow adjustments to sensitivity, level projection, and the source of price calculations (e.g., wicks or closing prices). Below, we outline each setting and its impact on the chart, along with examples to illustrate their functionality.
Custom Settings
Sensitivity : This setting adjusts the balance between detailed and broader structural levels by controlling the number of segments. Higher values result in more segments, revealing finer price levels, while lower values consolidate segments to highlight major price movements.
Source : Allows the user to choose between 'Wick' or 'Close' for detecting levels. Selecting 'Wick' emphasizes the absolute highs and lows of price action, while 'Close' focuses on closing prices within each segment.
Level Labels : Configures the visual representation of price levels, allowing users to toggle between price values, symbols (▲ ▼), or disabling labels altogether. This setting ensures clarity in how Broken and Unbroken levels are displayed on the chart.
Unbroken Levels : - - - Users can customize the colors and label styles for Unbroken levels, which highlight areas where price has respected structural boundaries.
Broken Levels : -|- Similar to Unbroken levels, users can specify the visual appearance of Broken levels, including color customization for Broken highs and lows. These settings help distinguish areas where price has breached a structural boundary.
Projection Options : This setting allows users to control how broken and unbroken levels are visually extended on the chart. The Future option projects lines forward to the right of the current price, showing potential future relevance of levels. The All option extends lines both forward and backward, providing a comprehensive view of how levels align with historical and potential future price action. The None option disables projections, keeping the chart focused solely on current segment levels without any extensions.
Segments : Includes options for customizing the segment visualization:
- Live Segment : Toggles the display of a highlighted box representing the current developing segment, helping users focus on ongoing price action.
- Boxes : Allows users to display filled boxes around each segment for additional visual emphasis.
- Segment Colors : Users can define separate colors for support (lower) and resistance (upper) segments, making it easier to interpret directional trends.
- Boundaries : Enables or disables vertical lines to mark segment boundaries, providing a clearer view of structural divisions.
Repaint : This setting allows users to enable or disable triangle labels within the live segment. When enabled, the triangles dynamically update to reflect real-time price behavior during the live bar but will repaint until the bar is fully confirmed. Disabling this option prevents the triangles from appearing during the live bar, reducing potential confusion as they may otherwise flash on and off during price updates. This setting ensures users can choose their preferred visualization while maintaining clarity in real-time analysis.
Color Settings : Offers extensive customization for all visual elements, including Broken and Unbroken levels, segment boundaries, and live segments. These settings ensure the indicator can adapt to individual preferences for chart readability.
🖼️ CHART EXAMPLES 🖼️
The following chart examples illustrate different configurations and features of the Non-Psychological Levels indicator. These examples highlight how the indicator’s settings influence the visualization of structural price behavior, helping traders understand its functionality in various scenarios.
Broken and Unbroken Levels : Orange prices are Broken HIghs. Blue prices are Broken Lows. Green and Red are Unbroken.
Boundaries : Enable Boundaries to visualize segments.
High Sensitivity Setting : A high sensitivity setting produces fewer segments and levels, emphasizing broader price ranges and major structural zones. This configuration is better suited for higher timeframes or identifying overarching trends.
Low Sensitivity Setting : A low sensitivity setting results in a greater number of segments and levels, offering a granular view of price structure. This configuration is ideal for analyzing detailed price movements on lower timeframes.
Live Segment with Triangles Enabled : This example shows the live segment box with triangle labels enabled. These triangles update dynamically during the live bar but may repaint until the bar is confirmed, helping traders observe real-time price behavior.
Broken and Unbroken Levels : This example highlights Broken levels (where price has breached structural boundaries and are drawn through subsequent price action) and Unbroken levels (where price has respected structural boundaries). These distinctions visually identify areas of potential support and resistance.
Broken and Unbroken Levels with Projection: All : This example demonstrates the "Project All" feature, where broken and unbroken levels are extended both forward and backward on the chart. This visualization highlights historical and potential future support and resistance zones, helping traders better understand how price interacts with these structural levels over time.
Segment Boxes with Boundaries : Filled boxes around individual segments visually distinguish each price interval, offering clarity in observing structural price transitions.
📊 SUMMARY 📊
The Non-Psychological Levels indicator provides a unique framework for analyzing structural price behavior through the identification of Broken and Unbroken levels. These levels act as a mechanical representation of support and resistance, independent of psychological biases or time-based factors. By focusing purely on price movement within defined segments, the indicator offers a neutral and consistent approach to understanding market dynamics.
This method complements traditional tools by providing an unbiased perspective. When structural levels align with psychological zones—such as round numbers or session-based highs and lows—they reinforce the significance of these areas as key price zones. When they diverge, the indicator introduces an alternative view, prompting further exploration of price behavior. This dual perspective enhances the depth of analysis by combining the mechanical and behavioral aspects of price action.
The Non-Psychological Levels indicator is not designed to generate trading signals or predict future price movements but serves as a visual and educational tool. Its adaptability across all markets and timeframes allows traders to integrate it into their broader strategies. By highlighting structural price dynamics, the indicator offers a fresh perspective on market analysis while remaining compatible with other technical tools.
⚙️ COMPATIBILITY AND LIMITATIONS ⚙️
Asset Compatibility :
The Non-Psychological Levels indicator is compatible with all asset classes, including cryptocurrencies, forex, stocks, and commodities. It can be applied to any chart or timeframe, making it a flexible tool for structural price analysis. Users should adjust the Sensitivity setting to ensure the segmentation aligns with the price behavior of the specific asset being analyzed. For instance, higher sensitivity values are more suitable for assets with large price ranges, while lower values work well for assets with tighter ranges.
Visual Range Dependency :
The indicator is optimized to perform calculations only within the visible range of the chart. This is a significant advantage, as it prevents unnecessary calculations and maintains efficient performance. However, because of this dependency, levels may appear to "recalculate" when the chart is zoomed in or out quickly or shifted abruptly. While this does not affect the integrity of the levels, it may cause a temporary lag as the indicator adjusts to the new visual range.
Persistence of Levels Beyond Visibility :
Even if levels are not visible on the chart due to zoom or scroll settings, they still exist in the background and are recalculated when revisited. This ensures that the structural price analysis remains consistent, regardless of the chart view.
Box Limitations in Pine Script :
The indicator is subject to Pine Script's inherent limitation of 500 boxes. This means that no more than 500 segments or level boxes can be drawn on the chart simultaneously. For most configurations, this limitation is mitigated by focusing on the visual range, but users employing very low sensitivity settings may exceed the limit. In such cases, only the most recent 500 boxes will be displayed, potentially omitting earlier segments.
Lag with Low Sensitivity Settings :
When sensitivity is set to a low value, the indicator creates many more segments, resulting in finer granularity and a higher number of boxes. While this provides detailed structural levels, it may increase the likelihood of exceeding Pine Script’s 500-box limit or cause a temporary lag when rendering a dense set of boxes over a wide visual range. Users should adjust sensitivity to balance detail with performance, especially on assets with high volatility or broad price ranges.
Live Segment Caution :
The live segment box updates in real time to reflect price movements as the segment is still developing. Since the segment high and segment low are not yet finalized, users should interpret this feature as a dynamic visualization of current price behavior rather than a definitive structural analysis. This ensures clarity during ongoing price action while maintaining the integrity of the indicator's framework.
Cross-Market Versatility :
The indicator’s time-agnostic and mechanical design ensures that it functions identically across all markets and timeframes. However, users should consider the unique characteristics of different markets when interpreting the results, as certain assets (e.g., highly volatile cryptocurrencies) may require sensitivity adjustments for optimal segmentation.
Visual Range Dependency: Levels recalculate efficiently within the chart's visible range but may lag temporarily when zooming or scrolling quickly.
These considerations ensure that the Non-Psychological Levels indicator remains robust and versatile while highlighting some inherent limitations of Pine Script and real-time recalculations. Users can mitigate these constraints by carefully adjusting sensitivity and understanding how the visual range dependency affects performance.
⚠️ DISCLAIMER ⚠️
The Non-Psychological Levels indicator is a visual analysis tool and is not designed as a predictive or trading signal indicator. Its primary purpose is to highlight structural price levels, providing an objective framework for understanding support and resistance within mechanically segmented price action.
The indicator operates within the visible range of the chart to ensure efficiency and adaptiveness, but this recalculation should not be interpreted as a forecast of future price behavior. While the structural levels may align with significant price zones in hindsight, they are purely a reflection of observed price dynamics and should not be used as standalone trading signals.
This indicator is intended as an educational and visual aid to complement other analysis methods. Users are encouraged to integrate it into a broader trading strategy and make adjustments to the settings based on their individual needs and market conditions.
🧠 BEYOND THE CODE 🧠
The Non-Psychological Levels indicator, like other xxattaxx indicators , is designed with education and community collaboration in mind. Its open-source nature encourages exploration, experimentation, and the development of new approaches to price analysis. By focusing on structural price behavior rather than psychological or time-based factors, this indicator introduces a fresh perspective for users to study.
Beyond its visual utility, the indicator serves as an educational framework for understanding the concept of non-psychological analysis. It offers traders an opportunity to explore price dynamics in a purely mechanical way, challenging conventional methods and fostering deeper insights into structural behavior. This approach is especially valuable for those interested in exploring new concepts or seeking alternative perspectives on market analysis.
Your comments, suggestions, and discussions are invaluable in shaping the future of this project. We actively encourage your feedback and contributions, which will directly help us refine and improve the Non-Psychological Levels indicator. We look forward to seeing the creative ways in which you use and enhance this tool. MVS

Session RangeThis Pine Script™ code is subject to the terms of the Mozilla Public License 2.0 at mozilla.org
This script plots the high and low price ranges for up to four customizable trading sessions directly on your chart. It is designed to help traders visualize price activity during specific trading hours.
Features
Customizable Sessions: Define up to four distinct trading sessions using the input.session parameter.
Visual Highlights: Each session range is highlighted with customizable colors for top and bottom lines as well as a fill between them.
Historical Ranges: Option to show historical session ranges with adjustable opacity.
Toggle Sessions: Enable or disable the display of specific trading sessions to tailor your analysis.
Overlay on Chart: The script works as an overlay, ensuring your analysis stays on the main chart.
How It Works:
Session Setup: Input the start and end times for each session in the Session 1, Session 2, Session 3, and Session 4 fields.
Dynamic Range Calculation: The script automatically calculates the high and low during active sessions, updating the range as new data comes in.
Customizable Colors: Adjust the colors for lines, fills, and historical ranges to match your charting style.
Clean Presentation: The script is designed to avoid clutter by limiting overlays to active and relevant sessions only.
Identify price action trends during key trading hours.
Compare ranges between multiple sessions for market behavior analysis.
Highlight significant session overlaps or range extensions.
Disclaimer :
This script is intended for educational purposes and should not be considered financial advice. Trading involves risks, and past performance does not guarantee future results.

Max Pain StrategyThe Max Pain Strategy uses a combination of volume and price movement thresholds to identify potential "pain zones" in the market. A "pain zone" is considered when the volume exceeds a certain multiple of its average over a defined lookback period, and the price movement exceeds a predefined percentage relative to the price at the beginning of the lookback period.
Here’s how the strategy functions step-by-step:
Inputs:
length: Defines the lookback period used to calculate the moving average of volume and the price change over that period.
volMultiplier: Sets a threshold multiplier for the volume; if the volume exceeds the average volume multiplied by this factor, it triggers the condition for a potential "pain zone."
priceMultiplier: Sets a threshold for the minimum percentage price change that is required for a "pain zone" condition.
Calculations:
averageVolume: The simple moving average (SMA) of volume over the specified lookback period.
priceChange: The absolute difference in price between the current bar's close and the close from the lookback period (length).
Pain Zone Condition:
The condition for entering a position is triggered if both the volume is higher than the average volume by the volMultiplier and the price change exceeds the price at the length-period ago by the priceMultiplier. This is an indication of significant market activity that could result in a price move.
Position Entry:
A long position is entered when the "pain zone" condition is met.
Exit Strategy:
The position is closed after the specified holdPeriods, which defines how many periods the position will be held after being entered.
Visualization:
A small triangle is plotted on the chart where the "pain zone" condition is met.
The background color changes to a semi-transparent red when the "pain zone" is active.
Scientific Explanation of the Components
Volume Analysis and Price Movement: These are two critical factors in trading strategies. Volume often serves as an indicator of market strength (or weakness), and price movement is a direct reflection of market sentiment. Higher volume with significant price movement may suggest that the market is entering a phase of increased volatility or trend formation, which the strategy aims to exploit.
Volume analysis: The study of volume as an indicator of market participation, with increased volume often signaling stronger trends (Murphy, J. J., Technical Analysis of the Financial Markets).
Price movement thresholds: A large price change over a short period may be interpreted as a breakout or a potential reversal point, aligning with volatility and liquidity analysis (Schwager, J. D., Market Wizards).
Repainting Check: This strategy does not involve any repainting because it is based on current and past data, and there is no reference to future values in the decision-making process. However, any strategy that uses lagging indicators or conditions based on historical bars, like close , is inherently a lagging strategy and might not predict real-time price action accurately until after the fact.
Risk Management: The position hold duration is predefined, which adds an element of time-based risk control. This duration ensures that the strategy does not hold a position indefinitely, which could expose it to unnecessary risk.
Potential Issues and Considerations
Repainting:
The strategy does not utilize future data or conditions that depend on future bars, so it does not inherently suffer from repainting issues.
However, since the strategy relies on volume and price change over a set lookback period, the decision to enter or exit a trade is only made after the data for the current bar is complete, meaning the trade decisions are somewhat delayed, which could be seen as a lagging feature rather than a repainting one.
Lagging Nature:
As with many technical analysis-based strategies, this one is based on past data (moving averages, price changes), meaning it reacts to market movements after they have already occurred, rather than predicting future price actions.
Overfitting Risk:
With parameters like the lookback period and multipliers being user-adjustable, there is a risk of overfitting to historical data. Adjusting parameters too much based on past performance can lead to poor out-of-sample results (Gauthier, P., Practical Quantitative Finance).
Conclusion
The Max Pain Strategy is a simple approach to identifying potential market entries based on volume spikes and significant price changes. It avoids repainting by relying solely on historical and current bar data, but it is inherently a lagging strategy that reacts to price and volume patterns after they have occurred. Therefore, the strategy can be effective in trending markets but may struggle in highly volatile, sideways markets.

Non-repainting ticker
The objective here is to provide a "non-repainting" source to indicators, meaning being sure that data is stable and will not affect the results, w/o having to make any change into the indicators
To use it :
1- include this "NRT" indicators onto your page : nothing will be displayed, just keep it.
2- as an exemple, when running any other indicator onto this page, and willing to select "close" as a source, just select instead " NRT: close" into source input; your indicator will then run "non-repainting"
Available sources : open, high, low , close, hl2, hlc3, ohlc4, hlcc4
MegaGas Bollinger Bands with Divergence and Circle SignalsIndicator: MegaGas Bollinger Bands with Divergence and Circle Signals
This script provides a powerful combination of Bollinger Bands, RSI Divergence detection, and signal visualization tools. Designed with flexibility and precision in mind, it aims to assist traders in identifying trend reversals, volatility zones, and divergence-based trading opportunities. The script is well-suited for swing trading, momentum trading, and even scalping when adapted to lower timeframes.
How It Works:
Bollinger Bands:
Bollinger Bands are used to detect price volatility and overbought/oversold conditions. The script calculates:
Basis Line: A 34-period Simple Moving Average (SMA) as the core trend line.
Upper Bands: Bands positioned 1x and 2x the standard deviation above the SMA.
Lower Bands: Bands positioned 1x and 2x the standard deviation below the SMA. These levels provide dynamic support and resistance zones, highlighting breakout and reversion opportunities.
RSI Divergence Detection:
The indicator detects bullish divergence (when RSI forms a higher low while price forms a lower low) and bearish divergence (when RSI forms a lower high while price forms a higher high). These divergences often precede significant reversals or momentum shifts.
Bullish divergence is displayed with blue triangles (up).
Bearish divergence is displayed with orange triangles (down).
Buy and Sell Signals:
Circle Signals are generated when price crosses key Bollinger Bands levels:
A green circle appears when the price crosses above the lower band (potential buy signal).
A red circle appears when the price crosses below the upper band (potential sell signal).
These signals help identify potential entry and exit points for trades, particularly in trend-following or mean-reversion strategies.
Trend Reference (Moving Average):
A 50-period Simple Moving Average (SMA) is included as a trend reference, helping traders gauge the overall market direction. Use this to confirm divergence signals and avoid trades against the prevailing trend.
Why This Indicator Is Unique:
This script integrates multiple tools in a meaningful way, emphasizing contextual trading signals. Unlike standalone Bollinger Bands or RSI indicators, it introduces:
Advanced Divergence Analysis: Enhancing traditional RSI with divergence-based alerts.
Dynamic Signal Filtering: Preventing repetitive signals by introducing state-based logic for circles and divergence signals.
Trend Alignment: Combining Bollinger Bands with an SMA to filter trades based on the prevailing trend.
How to Use:
Setup:
Apply the indicator to any chart and timeframe. For swing trading, higher timeframes like 4H or 1D are recommended.
Adjust the RSI, Bollinger Bands, and Moving Average lengths to match your strategy and asset.
Signals:
Look for divergence signals (triangles) as early warnings of trend reversals. Confirm these with price action or other tools.
Use circle signals (green/red) to time potential entries/exits around Bollinger Band extremes.
Confirmation:
Combine divergence and circle signals with the SMA line to avoid counter-trend trades. For example, take bullish signals when the price is above the SMA and bearish signals when it is below.
Chart Clarity:
The script is published with a clean chart for clarity. It visualizes all signals with distinct shapes (triangles and circles) and colors, ensuring they are easily recognizable. Bollinger Bands and the SMA are plotted with transparency to avoid clutter.
Originality:
This script is a thoughtful blend of Bollinger Bands and RSI divergence detection, carefully designed to provide traders with actionable insights. It introduces state-based logic to manage repetitive signals and seamlessly integrates trend filtering, making it a valuable tool for both novice and experienced traders.
