linreg-gridbotLinreg-GridBot
>release note version 1<
Introduction
This script is a powerful trading strategy tool designed to help users identify market reversal points and make smarter trading decisions using grid thinking.
Background
Traditional grid/martingale strategies have several drawbacks: inefficient use of capital, premature grid boundaries, and trading at fixed intervals, all of which significantly reduce profitability. Since, there is not a gridbot can trail-stop at each level, stay close with the trend, and do better capital usage, tradalive has created this advanced gridbot to address these issues, and enhance the profitability.
How does it work?
Imagine plotting closes on a graph, where the x-axis represents the time-intervals and the y-axis represents the price. Linear regression would fit a straight line through these points that best represents the trend of the data.
In this script utilize the built-in to find consecutive slopes at each moment, and combine them to a smooth trend line. When turning point censored, an entry is placed right after the next bar. Then the gridbot starts working, the upper limit and lower limit is calculated by built-in , for example 3 ATRs above and under the entry price.
There is a 0.2 trailing stop for each step level. Also, when built-in VWMA is rising, this script uses built-in ROC to find the average change of lookback length, then move the grid upwards accordingly.
Size trading is crucial, in gridbot all-in when beginning the trade is risky, because turning point does not guarantee a reversal market upcoming. As a grid trader, we believe the price is relatively cheap near the lower limit, and the price is relatively expensive near the upper limit. Properly sized orders help prevent overexposure and reduce the potential for significant losses.
Features
Trend Detection: Utilizes linear regression to differentiate between upward and downward trends, displaying them as (orange) trend lines on the chart.
Signal Generation: Provides buy or sell signals at reversal points, helping users trade at optimal times.
Adjustable Parameters: Allows users to customize different indicator parameters to fit various trading strategies.
Backtested Device Parameters (see appendix)
Grid Parameters
🔃: Cyclic Trading
💰: Capital Turnover Ratio (Grid capital difference per level: 0.5 to 2)
⬆️ / ⬇️ Expected Number of Upward and Downward Grids.
The minimum number of grids is three: one level above and below the current price.
The maximum number of grids is seven: three levels above and below the current price.
🧭: Trade Signal: Controls the trading direction, long or short;
📏: Linear regression length value.
⏳⌛Backtest Period: Set the time range for users to analyze the performance of the strategy over different periods.
Analytic Toolbox (upper right corner) :
Usage Instructions
Add this script to your TradingView account.
Apply the script to your chart.
Adjust the parameters to fit your trading needs.
Make trading decisions based on the buy and sell signals.
Manually place orders on your trading platform using the parameters provided.
Enter grid parameters according to the highest and lowest prices.
Fill in the number of grid levels (the number of grids equals the number of upward grids plus the number of downward grids plus one).
Set stop-loss and take-profit values.
Alternatively, use a webhook to connect to your trading platform for automated trading.
Important Notes
This script currently only supports 4-hour and daily charts!
This script relies on historical data for calculations and may not be suitable for all market conditions.
Trading carries risks, so please use this script cautiously for trading decisions.
User has to update the backtest period, or else the strategy might not be seen.
Demostration
Phase one, the orange line is about to turn up.
Phase two, the reversal point is located, and right after the next bar start an entry of gridbot.
Phase Three, the gridbot operates, once level touches, then a 0.2ATR trailing stop is applied on each step.
Phase four, when vwma rises, the grid window follows it by the rate of change of lookback price. If vwma does not move up, then the grid boundaries remain.
Phase five, either side when the current price breaks through the white limits, the gridbot stops. And the trading strategy is done for this round.
Educational

3 Timeframe MACD3 Timeframe MACD Indicator
This indicator provides a multi-timeframe visualization of the MACD (Moving Average Convergence Divergence), enabling traders to analyze momentum and trend signals effectively across different timeframes.
Key Features:
Multi-Timeframe Capability:
Timeframe 1: Automatically uses the chart's current timeframe and displays the MACD Histogram along with the MACD line and Signal line.
Timeframe 2: A user-defined timeframe (default: 4 hours) displays both the MACD line and Signal line for trend and crossover analysis.
Timeframe 3: Another user-defined timeframe (default: 1 day) also displays the MACD line and Signal line, with increased line thickness for emphasis.
Dynamic Histogram Plot:
Timeframe 1's histogram is color-coded:
Green shades for positive values (brighter for increasing momentum).
Red shades for negative values (darker for increasing negative momentum).
Customizable MACD Parameters:
Adjustable Fast Length, Slow Length, and Signal Length to tailor the MACD calculation to specific trading styles or assets.
Clear and Distinct Visualizations:
Timeframe 1 includes the MACD Histogram with MACD and Signal lines for a detailed momentum view.
Timeframes 2 and 3 highlight the MACD and Signal lines in distinct colors for easy differentiation.
Use Case:
Ideal for traders seeking to monitor momentum changes (via Histogram) and trend/crossover signals (via MACD and Signal lines) across the current and two higher/lower timeframes.
Enhances decision-making by providing multi-timeframe confluence for trend-following or countertrend strategies.
This indicator is particularly useful for traders looking for a streamlined way to incorporate multi-timeframe analysis into their trading workflow.

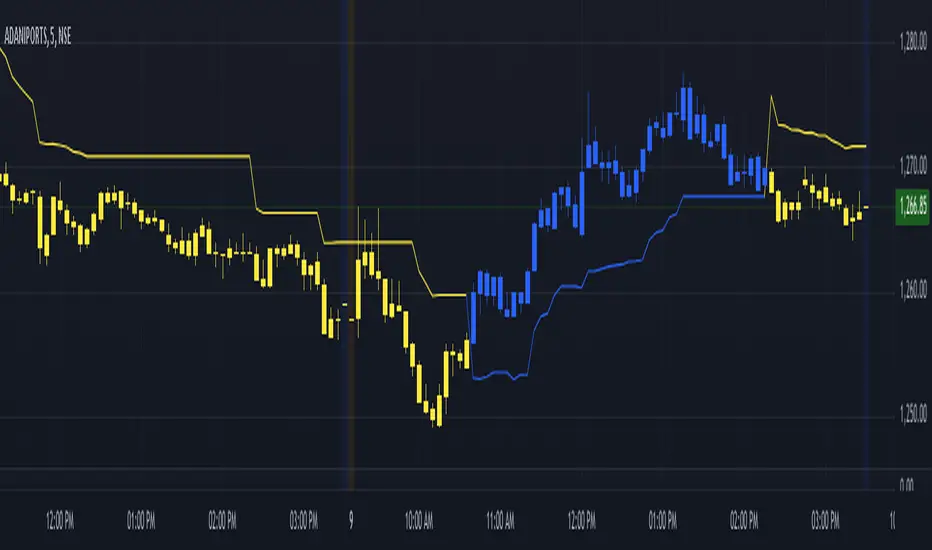
Intraday Trend CandlesThe Intraday Trend Candles (ITC) indicator is a Pine Script-based tool designed for traders seeking to visualize market trends effectively. Using a combination of the Look Back Period, a multiplier for true range, and linearly weighted moving averages (LWMA), this indicator calculates dynamic trend limits that adapt to price movements. It identifies key trend shifts by comparing the current price to these dynamic thresholds, resulting in a visually intuitive display of market bias directly on the chart. The indicator is particularly well-suited for intraday trading, as it provides responsive insights tailored to short-term price action.
The ITC plots color-coded candles, highlighting bullish trends in blue and bearish trends in yellow, with gray indicating indecision or trend continuation. This color-coded approach makes it easy to identify reversals and trend dynamics at a glance. Additionally, a trend line is plotted to enhance clarity, signaling whether the price is favoring the upper or lower threshold of the calculated range. With built-in alerts for trend reversals, traders can stay informed about critical market shifts without constantly monitoring the chart. This combination of visual cues and alerts makes the ITC a versatile and powerful tool for traders focusing on momentum and trend-following strategies.
Bar Replay Fix - Smooth Candle Transition for TradingViewThe Bar Replay Fix indicator addresses a known issue in TradingView’s Bar Replay mode, where the last completed candle is incorrectly drawn when switching from a lower timeframe to a higher one. This issue can create confusion during analysis, especially when replaying historical price action.
Key Features:
Accurate Candle Rendering: Ensures that candles are displayed correctly in Bar Replay mode by referencing and plotting the previous candle data.
Customizable Appearance: Configure the candle body, wick, and border colors for bullish, bearish, and doji candles to match your chart theme.
Seamless Integration: Works invisibly in the background to provide a smoother and more reliable replay experience.
Use Cases:
Enhance your backtesting accuracy by eliminating incorrect candle rendering during Bar Replay.
Maintain consistency in candle visualization when transitioning between timeframes in Replay mode.
Disclaimer: This indicator is specifically designed to resolve a visual issue in Bar Replay mode and does not provide any trading signals or analysis recommendations.
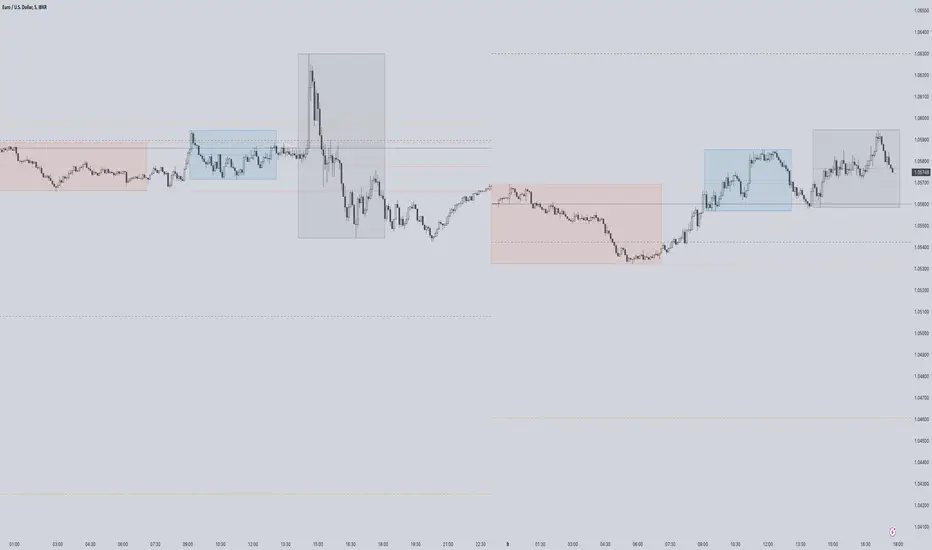
Hidden SMT Divergence ICT 01 [TradingFinder] HSMT SMC Technique🔵 Introduction
Hidden SMT Divergence, an advanced concept within the Smart Money Technique (SMT), identifies discrepancies between correlated assets by focusing on their closing prices.
Unlike the standard SMT Divergence, which uses high and low prices for analysis, Hidden SMT Divergence uncovers subtle signals by examining divergences based on the assets' closing values.
These divergences often highlight potential reversals or trend continuations, making this technique a valuable tool for traders aiming to anticipate market movements.
This approach applies across various markets and asset classes, including :
Commodities : CAPITALCOM:GOLD vs. CAPITALCOM:SILVER or BLACKBULL:BRENT vs. BLACKBULL:WTI .
Indices : NASDAQ:NDX vs. TVC:SPX vs. FX:US30 .
FOREX : FX:EURUSD vs. OANDA:GBPUSD vs. TVC:DXY (US Dollar Index).
Cryptocurrencies : BITSTAMP:BTCUSD vs. COINBASE:ETHUSD vs. KUCOIN:SOLUSDT vs. CRYPTOCAP:TOTAL3 .
Volatility Measures : FOREXCOM:XAUUSD vs. TVC:VIX (Volatility Index).
By identifying divergences within these asset groups, traders can gain actionable insights into potential market reversals or shifts in trend direction. Hidden SMT Divergence is particularly effective for pinpointing subtle market signals that traditional methods may overlook.
Bullish Hidden SMT Divergence : This divergence emerges when one asset forms a higher low, while the correlated asset creates a lower low in terms of their closing prices. It often signals weakening downward momentum and a potential reversal to the upside.
Bearish Hidden SMT Divergence : This occurs when one asset establishes a higher high, while the correlated asset forms a lower high based on their closing prices. It typically reflects declining upward momentum and a probable shift to the downside.
🔵 How to Use
The Hidden SMT Divergence indicator provides traders with a systematic approach to identify market reversals or trend continuations through divergences in closing prices between two correlated assets.
🟣 Bullish Hidden SMT Divergence
Bullish Hidden SMT Divergence occurs when the closing price of the primary asset forms a higher low, while the correlated asset creates a lower low. This pattern indicates weakening downward momentum and signals a potential reversal to the upside.
After identifying the divergence, confirm it using additional tools like support levels, volume trends, or indicators such as RSI and MACD. Enter a buy position as the price shows signs of reversal near support zones, ensuring proper risk management by placing a stop-loss below the support level.
Bearish Hidden SMT Divergence
Bearish Hidden SMT Divergence is identified when the closing price of the primary asset forms a higher high, while the correlated asset creates a lower high. This divergence suggests a weakening uptrend and a likely reversal to the downside.
Validate the signal by examining resistance levels, declining volume, or complementary indicators. Consider entering a sell position as the price starts declining from resistance levels, and set a stop-loss above the resistance zone to limit potential losses.
🔵 Setting
Second Symbol : Select the secondary asset to compare with the primary asset. By default, "XAUUSD" (Gold) is used, but it can be customized to any stock, cryptocurrency, or currency pair.
Divergence Fractal Periods : Defines the number of past candles considered for identifying divergences. The default value is 2, but traders can adjust it for greater precision.
Bullish Divergence Line : Displays a dashed line connecting the points of bullish divergence.
Bearish Divergence Line : Shows a similar line for bearish divergence points.
Bullish Divergence Label : Marks areas of bullish divergence with a "+SMT" label.
Bearish Divergence Label : Highlights bearish divergences with a "-SMT" label.
Chart Type : Choose between Line or Candle charts for enhanced visualization.
🔵 Conclusion
Hidden SMT Divergence offers traders a refined method for identifying market reversals by analyzing closing price discrepancies between correlated assets. Its ability to uncover subtle divergences makes it an essential tool for traders who aim to stay ahead of market trends.
By integrating this technique with other technical analysis tools and sound risk management, traders can enhance their decision-making process and capitalize on market opportunities with greater confidence.
Hidden SMT Divergence’s focus on closing prices ensures more precise signals, helping traders refine their strategies across various markets, including Forex, commodities, indices, and cryptocurrencies.
Its open-source nature allows for customization and verification, providing transparency and flexibility to suit diverse trading needs. Hidden SMT Divergence stands as a powerful addition to the arsenal of any trader seeking to unlock hidden opportunities in dynamic financial markets.

Advanced MA and MACD PercentageIntroduction
The "Advanced MA and MACD Percentage" indicator is a powerful and innovative tool designed to help traders analyze financial markets with ease and precision. This indicator combines Moving Averages (MA) with the MACD indicator to assess the market’s overall trend and calculate the percentage of buy and sell signals based on current data.
Features
Multi-Timeframe Analysis:
Allows selecting your preferred timeframe for trend analysis, such as minute, hourly, daily, or weekly charts.
Support for Multiple Moving Average Types:
Offers the option to use either Simple Moving Average (SMA) or Exponential Moving Average (EMA), based on user preference.
Comprehensive MACD Analysis:
Analyzes the relationship between multiple moving averages (e.g., 20/50, 50/100) using MACD to provide deeper insights into market dynamics.
Calculation of Buy and Sell Percentages:
Computes the percentage of indicators signaling buy or sell conditions, providing a clear summary to assist trading decisions.
Intuitive Visual Interface:
Displays buy and sell percentages as two visible lines (green and red) on the chart.
Includes reference lines to clarify the range of percentages (100% to 0%).
How It Works
Moving Averages Calculation:
Calculates moving averages (20, 50, 100, 150, and 200) for the selected timeframe.
MACD Pair Analysis:
Computes the MACD to compare the performance between various moving average pairs, such as (20/50) and (50/100).
Identifying Buy and Sell Signals:
Counts the number of indicators signaling buy (price above MAs or positive MACD histogram).
Converts the count into percentages for both buy and sell signals.
Visual Representation:
Plots buy and sell percentages as clear lines (green for buy, red for sell).
Adds reference lines (100% and 0%) for easier interpretation.
How to Use the Indicator?
Settings:
Choose the type of moving average (SMA or EMA).
Select the timeframe that suits your strategy (e.g., 15 minutes, 1 hour, or daily).
Reading the Results:
If the buy percentage (green line) is above 50%, the overall trend is bullish (buy).
If the sell percentage (red line) is above 50%, the overall trend is bearish (sell).
Integrating Into Your Strategy:
Combine it with other indicators to confirm entry and exit signals.
Use it to quickly understand the market’s overall trend without needing complex manual analysis.
Benefits of the Indicator
Simplified Analysis: Provides a straightforward summary of the market's overall trend.
Adaptable to All Timeframes: Works perfectly on all timeframes.
Customizable: Allows users to adjust settings according to their needs.
Important Notes
This indicator does not provide direct buy or sell signals. Instead, it offers a summary of the market’s condition based on a combination of indicators.
It is recommended to use it alongside other technical analysis tools for precise trading signals.
Conclusion
The "Advanced MA and MACD Percentage" indicator is an ideal tool for traders who want to analyze the market using a combination of Moving Averages and MACD. It gives you a comprehensive overview of the overall trend, helping you make informed and quick trading decisions. Try it now and see the difference!

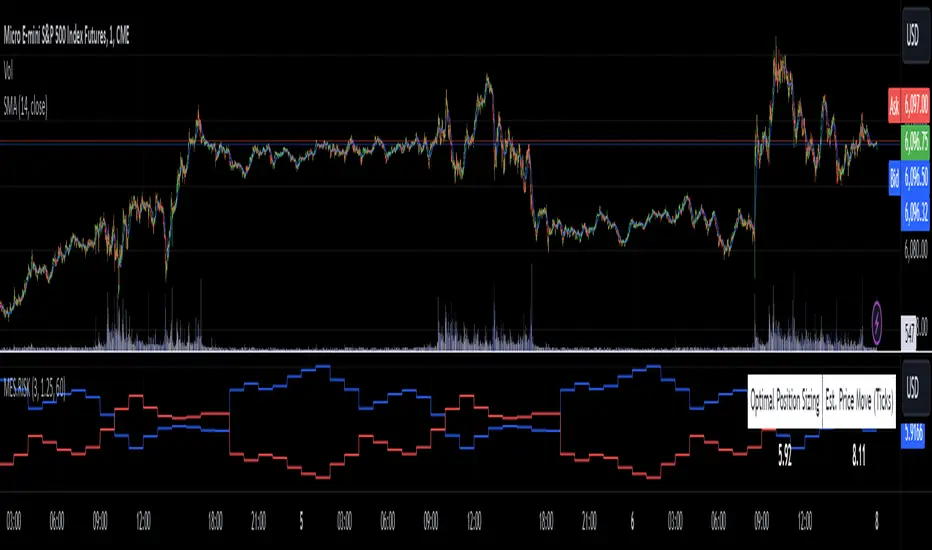
MES Position Sizing EstimatorDescription and Use:
Here is an indicator which aims to help all Micro-ES futures traders who struggle with risk management! I created this indicator designed as a general guideline to help short term traders (designed for 1 minute candles) determine how many contracts to trade on the MES for their desired profit target.
To use the indicator, simply go to MES on the 1 minute timeframe, apply the indicator, and enter your Holding Period (how long you want to have your position open for), Value Per Tick
(usually 1.25 for MES since one point is $5) and your target PnL for the trade in the inputs tab.
It will then show in a table the recommended position sizing, as well as the estimated price change for your holding period. Additionally, there are two plotted lines also showing the position sizing and estimated price change historically.
How the indicator works
On the technical level, I made calculations for this indicator using Python. I downloaded 82 days of 1 minute OHLC data from TradingView, and then ran regression (log-transformed linear regression specifically) to calculate how the average price change in MES futures scales with the amount of time a position is held for, and then ran these regressions for every hour of the day. I then copied the equations from those regressions into Pinescript, and used the assumption that:
position size = target PnL / (estimated price change for time * tick value)
Therefore, Choosing the number of contracts to trade position sizing for Micro E-mini S&P 500 Futures (MES) based on time of day, holding period, and tick value. This tool leverages historical volatility patterns and log-transformed linear regression models to provide precise recommendations tailored to your trading strategy.
If you want to check out how the regression code worked in python, it is all open source and available on my Github repository for it .
Notes:
The script assumes a log-normal distribution of price movements and is intended as an educational tool to aid in risk management.
It is not a standalone trading system and should be used in conjunction with other trading strategies and risk assessments.
Past performance is not indicative of future results, and traders should exercise caution and adjust their strategies based on personal risk tolerance.
This script is open-source and available for use and modification by the TradingView community. It aims to provide a valuable resource for traders seeking to enhance their risk management practices through data-driven insights.
LETF Leveraged Edge Strategy v1.5Overview
The strategy is based on Stochastics to detect trends and then makes Buys and Sell based on custom entry and exit criteria as described below in the Execution Logic Rules section. It will NOT work with standard Stochastics.
This is not a standard Stochastics implementation. It has been customized and modified, and does not match any widely known Stochastics variations (like Fast, Slow, or Full Stochastics) in its smoothing and iterative calculation process with:
• A unique smoothing mechanism.
• Iterative calculations.
• Additional conditional logic for strategy execution.
This strategy is designed to focus on volatile, liquid leveraged ETFs to capture gains equal to or better than Buy and Hold, and mitigate the risk of trading with a goal of reducing drawdown to a lot less than Buy and Hold. It has had successful backtest performance to varying degrees with TQQQ, SOXL, FNGU, TECL, FAS, UPRO, NAIL and SPXL. Results have not been good on other LETFs that have been backtested.
Performance
In this backtest the Net Profit shows to be $4,561 or 45.61%. Considering the initial order size was $1,000 I have to wonder if the Strategy Tester is calculating this correctly. The Strategy Tester Performance Summary shows the Buy and Hold Return at $61,165 or 611.7%. Based on calculating the price of the last shares sold, less the price paid, times the number of initial shares purchased, my math shows the Buy and Hold Gain at $4,572 or about equal with the strategy performance in this case. The Performance Summary also states the strategy had a Max DD of 3.46% which I believe is incorrect. Based on other backtests I’ve done, I believe the strategy drawdown here was closer to 28.4% and the Buy and Hold Drawdown at 82.7%. I manually calculated the Buy and Hold drawdown.
How it Works
The author provides training and support resource materials for this at his website. The strategy execution logic is driven by these rules:
Execution Logic Rules
Buy the LETF When:
BR #1a) The Daily Fast Line (FL) crosses above the Daily Slow Line (SL) and the FL is between the Low (L*) and High (H*) Range set (often referred to as Oversold and Overbought Lines). This can execute (Buy) any trading day of the week.
BR #1b) Re-Buy the next day after any Stop or Take Profit Sell if the Buy Rule condition is true (FL is above SL), if not, remain in cash and wait for the next Buy Signal.
Sell the LETF When:
SR #1a) The Daily Fast Line (FL) crosses below Daily Slow Line (SL) within the Low (L*) and High (H*) Range (often referred to as Oversold and Overbought Lines). “Crossunder Range Exit” This can execute (Sell) any trading day of the week.
SR #1b) If the (FL) crosses Below the SL above the Exit Level*, wait. Only Sell if the FL drops down below the Exit Level* “Crossunder Level Exit” This can execute (Sell) any trading day of the week.
SR #2a) Sell at the open any day the gap-down price is at or below the 1-Day Stop%*, based on previous day’s closing price (Execute on the day it happens.)
SR #2b) Sell intraday any day the price is at or below the 1-Day Stop %*, based on previous day’s closing price (Execute on the day it happens.)
SR #3a) Sell at the open any day the price is at or below the Trailing Stop %*, based on highest intraday price since Buy date (Execute on the day it happens.)
SR #3b) Sell intraday any day the price is at or below the Trailing Stop%*, based on highest intraday price since Buy date (Execute on the day it happens.)
SR #4) Sell any day when the opening price exceeds, or intraday price meets the Profit Target % price* (Execute on the day it happens.)
SR #5) After each Sell go to Rule BR #1b to determine if a Re-Buy should occur the next day, or stay in cash until next Buy Signal
Settings:
Properties Tab – Initial Capital has been set to $10,000 and order size 10% of Equity, 0.1% commission and 3 Ticks for slippage. Net order size is $1,000
Input Tab:
Stochastic
Timeframe is selected to Daily or Weekly based on preference. Daily has more trades, but on average higher profitability.
Type: Proprietary (best selection for most LETFs, but a few will work better with the Full selection
%k Length 20, %K Smoothing 14, %D Smoothing (many LETFs work better with a specific Stoch setting, often each different) A List of these is provided for your starting point.
Trade Settings
Direction: Longs (This strategy only works on the Long side)
Stop Type: Trailing is recommended, but Fixed is an option.
Stop % (based on user risk tolerance)
PD Stop % (Suggest start at 5%. Based on volatility of LETF and is a stop percentage from prior day’s close. Designed to protect against sudden market volatility. Will need to balance between strategy performance and user risk tolerance)
Profit Target: User preference. (I can help with suggestions based on historical performance)
Entry/Exit Conditions
Enter on Tie: Default Checked – if a Fast line crosses a Slow line for a Buy signal, but doesn’t do so in the range set, this will trigger if it crosses at a tie.
Renter – Default Checked – If stopped out of a position, this tells the strategy to re-buy the position the next day if the conditions are still positive.
Exit Level: This is a exit level for a Fast cross below a Slow line that takes place above the Sell Range, but only happens if the Fast continues down to the level set. These usually don’t happen often, but can have a significant impact on performance. Unfortunately, it’s a trial and error process starting with 90 and working down to see if there’s any positive impact.
Trade Range
Buy Range: Start at typical 20 to 80. Expand the low end down first to check on performance impact. Normally a wide buying range is better for performance.
Sell Range: Start at 20 to 80 and tighten gradually to see performance impact. In some cases a very tight sell range does better. I have worked on our primary LETFs for many months to determine ranges for each that typically produce better results.
External Indicator: Some additional indicators have a positive impact on the strategy performance by increasing P/l, reducing drawdown and reducing the number of trades. This is not always the case and each LETF and time period for the LETF will have a bearing on whether the secondary indicator will help or not. Two that have helped are the MACD Histogram, and the Sloe-Velocity Indicator by Kamleshkumar43. Sometimes a couple of different indicators will have a positive impact, then it’s a personal preference which you pick to use with the strategy.
Since this strategy is focused on a very narrow selection of liquid LETFs, I have a lot of experience experimenting with the settings for the primary ones and can suggest things that will help. Additional training on the rules, working with the settings, and mitigating some of the negative trades during choppy markets is available at the website.
Chart
The strategy can be selected to use either a Daily or Weekly version of stochastic. This is important because the characteristics are different while still generating very good gains and minimal drawdowns. Generally, the daily stochastic will have a greater number of, and certainly more frequent, trades than the weekly stochastic. However, on average the daily version of the stochastic will generates greater profitability.
The Settings tabs have tooltip icons that will assist in inputting values that correspond to the written rules for the strategy, and some include specific rule detail.
Buying
The strategy generates Buy signals with the Fast line crossing over the Slow line within a “Buy Range” which is adjusted based on volatility of the leveraged ETF. This is unique in that a default is set for these entries to occur if the values are tied and doesn’t need to be within the high and low range if that occurs. The trader can select in the strategy for this to occur the same day, if he’s selected a Daily Stochastic timeframe, or at the end of the trading week if he’s selected a Weekly stochastic timeframe. The volatility of a leveraged ETF will sometimes cause a shake-out exit, a trailing stop can be hit, or there can be an exit based on taking a profit. A big part of the timing challenge was how to handle these. The strategy normally (set as a default) will immediately re-buy the next day only if the original buy conditions are still true. This helps capture gains when conditions are still favorable but keeps the trader out when they’re not.
Selling
Exits are handled in several ways. The strategy will exit if there is a fast line cross below a slow line within the “range”. The range is adjusted based on volatility of the leveraged ETF. The exit occurs at the close of the day if the trader has selected to use a Daily stochastic setting. The exit will occur at the end of the trading week if the trader has chosen a weekly stochastic strategy. The trader will set a level based on the instrument and volatility for another exit type. The level will sometimes coincide with the range exit high level but does not need to. If a fast line crosses down through a slow line above the level set, and then comes down to that level, the strategy will exit the position.
Another unique aspect of the strategy is the PD Stop setting. This is short for “Prior Day”, Rather than a normal stop based on the price paid for a position, the PD Stop is based on a percentage drop from the previous day’s closing price. This helps account for the volatility of the leveraged ETF and will cause an exit quickly if there’s a market, or index moving event. This helps capture gains and reduce risk should there be continued pullback.
Exits will also occur based on setting a trailing stop level and profit taking level. These are adjusted based on the leveraged ETFs volatility and historical performance.
Limitations
Choppy, or sideways markets are the most prone to poor performance and potential for being stopped out multiple times. If stopped out two consecutive times, make sure you’re monitoring market health and there are clear signs of a new uptrend such as a 10D and 21D MA in proper alignment and moving up. If you get a Buy signal from the strategy and you’re not confident yet about market and price direction then it’s fine to wait a day, or several days, to enter after the Buy signal when you have greater confidence about market direction. The author can help with a short list of tactical rules developed for these sideways or choppy markets.
This strategy has proven successful backtest results with a very limited set of LETFs as discussed earlier. The author does not know if it will prove successful with any others, or other types of ETFs such as 2X or plain ETFs. A lot more testing needs to be done.
The strategy buys and sells , excluding stops or take profit, at the market close. It can be very challenging to enter an order at market close.
Disclaimer
Please remember that past performance may not be indicative of future results.
Due to various factors, including changing market conditions, the strategy may no longer perform as well as in historical backtesting. This post and the script do not provide any financial advice and are for educational and entertainment purposes only.

Historical High/Lows Statistical Analysis(More Timeframe interval options coming in the future)
Indicator Description
The Hourly and Weekly High/Low (H/L) Analysis indicator provides a powerful tool for tracking the most frequent high and low points during different periods, specifically on an hourly basis and a weekly basis, broken down by the days of the week (DOTW). This indicator is particularly useful for traders seeking to understand historical behavior and patterns of high/low occurrences across both hourly intervals and weekly days, helping them make more informed decisions based on historical data.
With its customizable options, this indicator is versatile and applicable to a variety of trading strategies, ranging from intraday to swing trading. It is designed to meet the needs of both novice and experienced traders.
Key Features
Hourly High/Low Analysis:
Tracks and displays the frequency of hourly high and low occurrences across a user-defined date range.
Enables traders to identify which hours of the day are historically more likely to set highs or lows, offering valuable insights into intraday price action.
Customizable options for:
Hourly session start and end times.
22-hour session support for futures traders.
Hourly label formatting (e.g., 12-hour or 24-hour format).
Table position, size, and design flexibility.
Weekly High/Low Analysis by Day of the Week (DOTW):
Captures weekly high and low occurrences for each day of the week.
Allows traders to evaluate which days are most likely to produce highs or lows during the week, providing insights into weekly price movement tendencies.
Displays the aggregated counts of highs and lows for each day in a clean, customizable table format.
Options for hiding specific days (e.g., weekends) and customizing table appearance.
User-Friendly Table Display:
Both hourly and weekly data are displayed in separate tables, ensuring clarity and non-interference.
Tables can be positioned on the chart according to user preferences and are designed to be visually appealing yet highly informative.
Customizable Date Range:
Users can specify a start and end date for the analysis, allowing them to focus on specific periods of interest.
Possible Uses
Intraday Traders (Hourly Analysis):
Analyze hourly price action to determine which hours are more likely to produce highs or lows.
Identify intraday trading opportunities during statistically significant time intervals.
Use hourly insights to time entries and exits more effectively.
Swing Traders (Weekly DOTW Analysis):
Evaluate weekly price patterns by identifying which days of the week are more likely to set highs or lows.
Plan trades around days that historically exhibit strong movements or price reversals.
Futures and Forex Traders:
Use the 22-hour session feature to exclude the CME break or other session-specific gaps from analysis.
Combine hourly and DOTW insights to optimize strategies for continuous markets.
Data-Driven Trading Strategies:
Use historical high/low data to test and refine trading strategies.
Quantify market tendencies and evaluate whether observed patterns align with your strategy's assumptions.
How the Indicator Works
Hourly H/L Analysis:
The indicator calculates the highest and lowest prices for each hour in the specified date range.
Each hourly high and low occurrence is recorded and aggregated into a table, with counts displayed for all 24 hours.
Users can toggle the visibility of empty cells (hours with no high/low occurrences) and adjust the table's design to suit their preferences.
Supports both 12-hour (AM/PM) and 24-hour formats.
Weekly H/L DOTW Analysis:
The indicator tracks the highest and lowest prices for each day of the week during the user-specified date range.
Highs and lows are identified for the entire week, and the specific days when they occur are recorded.
Counts for each day are aggregated and displayed in a table, with a "Totals" column summarizing the overall occurrences.
The analysis resets weekly, ensuring accurate tracking of high/low days.
Code Breakdown:
Data Aggregation:
The script uses arrays to store counts of high/low occurrences for both hourly and weekly intervals.
Daily data is fetched using the request.security() function, ensuring consistent results regardless of the chart's timeframe.
Weekly Reset Mechanism:
Weekly high/low values are reset at the start of a new week (Monday) to ensure accurate weekly tracking.
A processing flag ensures that weekly data is counted only once at the end of the week (Sunday).
Table Visualization:
Tables are created using the table.new() function, with customizable styles and positions.
Header rows, data rows, and totals are dynamically populated based on the aggregated data.
User Inputs:
Customization options include text colors, background colors, table positioning, label formatting, and date ranges.
Code Explanation
The script is structured into two main sections:
Hourly H/L Analysis:
This section captures and aggregates high/low occurrences for each hour of the day.
The logic is session-aware, allowing users to define custom session times (e.g., 22-hour futures sessions).
Data is displayed in a clean table format with hourly labels.
Weekly H/L DOTW Analysis:
This section tracks weekly highs and lows by day of the week.
Highs and lows are identified for each week, and counts are updated only once per week to prevent duplication.
A user-friendly table displays the counts for each day of the week, along with totals.
Both sections are completely independent of each other to avoid interference. This ensures that enabling or disabling one section does not impact the functionality of the other.
Customization Options
For Hourly Analysis:
Toggle hourly table visibility.
Choose session start and end times.
Select hourly label format (12-hour or 24-hour).
Customize table appearance (colors, position, text size).
For Weekly DOTW Analysis:
Toggle DOTW table visibility.
Choose which days to include (e.g., hide weekends).
Customize table appearance (colors, position, text size).
Select values format (percentages or occurrences).
Conclusion
The Hourly and Weekly H/L Analysis indicator is a versatile tool designed to empower traders with data-driven insights into intraday and weekly market tendencies. Its highly customizable design ensures compatibility with various trading styles and instruments, making it an essential addition to any trader's toolkit.
With its focus on accuracy, clarity, and customization, this indicator adheres to TradingView's guidelines, ensuring a robust and valuable user experience.

TLA20 - Multi-Session Box and Level ToolTLA20 is a highly customizable indicator designed to enhance intraday analysis by marking predefined trading sessions, key levels, and midpoints directly on your charts. With its versatile features, TLA20 is ideal for traders looking to visualize multiple time zones, daily price ranges, and historical reference levels efficiently.
Key Features:
Session Visualization: Mark up to three custom trading sessions with distinct start and end times, adjustable for different time zones and weekend inclusions.
Dynamic Highlights: Automatically draw session highs, lows, midlines, and open prices with options to extend beyond session bounds.
Custom Styling: Configure border colors, styles, and fill options for each session box to match your chart preferences.
Historical Levels: Highlight previous daily highs/lows, weekly highs/lows, and monthly highs/lows for improved context in your trading.
Intuitive Adjustments: Enable or disable each feature and customize settings for precise alignment with your trading strategy.
Use Cases:
Track trading sessions across different markets and time zones.
Identify key price levels like session midpoints and opens for entry/exit strategies.
Overlay historical levels to recognize potential support and resistance areas.
This indicator does not provide direct trading signals but serves as a robust tool for enhancing technical analysis.
Disclaimer: The script is provided “as is” without warranties of any kind. Always test on a demo account before applying in live markets.

Average Price Range Screener [KFB Quant]Average Price Range Screener
Overview:
The Average Price Range Screener is a technical analysis tool designed to provide insights into the average price volatility across multiple symbols over user-defined time periods. The indicator compares price ranges from different assets and displays them in a visual table and chart for easy reference. This can be especially helpful for traders looking to identify symbols with high or low volatility across various time frames.
Key Features:
Multiple Symbols Supported:
The script allows for analysis of up to 10 symbols, such as major cryptocurrencies and market indices. Symbols can be selected by the user and configured for tracking price volatility.
Dynamic Range Calculation:
The script calculates the average price range of each symbol over three distinct time periods (default are 30, 60, and 90 bars). The price range for each symbol is calculated as a percentage of the bar's high-to-low difference relative to its low value.
Range Visualization:
The results are visually represented using:
- A color-coded table showing the calculated average ranges of each symbol and the current chart symbol.
- A line plot that visually tracks the volatility for each symbol on the chart, with color gradients representing the range intensity from low (red/orange) to high (blue/green).
Customizable Inputs:
- Length Inputs: Users can define the time lengths (default are 30, 60, and 90 bars) for calculating average price ranges for each symbol.
- Symbol Inputs: 10 symbols can be tracked at once, with default values set to popular crypto pairs and indices.
- Color Inputs: Users can customize the color scheme for the range values displayed in the table and chart.
Real-Time Ranking:
The indicator ranks symbols by their average price range, providing a clear view of which assets are exhibiting higher volatility at any given time.
Each symbol's range value is color-coded based on its relative volatility within the selected symbols (using a gradient from low to high range).
Data Table:
The table shows the average range values for each symbol in real-time, allowing users to compare volatility across multiple assets at a glance. The table is dynamically updated as new data comes in.
Interactive Labels:
The indicator adds labels to the chart, showing the average range for each symbol. These labels adjust in real-time as the price range values change, giving users an immediate view of volatility rankings.
How to Use:
Set Time Periods: Adjust the time periods (lengths) to match your trading strategy's timeframe and volatility preference.
Symbol Selection: Add and track the price range for your preferred symbols (cryptocurrencies, stocks, indices).
Monitor Volatility: Use the visual table and plot to identify symbols with higher or lower volatility, and adjust your trading strategy accordingly.
Interpret the Table and Chart: Ranges that are color-coded from red/orange (lower volatility) to blue/green (higher volatility) allow you to quickly gauge which symbols are most volatile.
Disclaimer: This tool is provided for informational and educational purposes only and should not be considered as financial advice. Always conduct your own research and consult with a licensed financial advisor before making any investment decisions.

IBD Market School [tradeviZion]IBD Market School Indicator: User Guide and Settings Reference
A comprehensive guide to configuring and using the IBD Market School indicator for TradingView
Introduction
The IBD Market School indicator is an advanced market analysis tool that implements Investor's Business Daily's methodology for identifying optimal trading opportunities. By tracking key market indexes and analyzing price and volume patterns, it provides actionable buy and sell signals based on the CANSLIM investment system.
The indicator offers a comprehensive set of features:
Complete Signal System
10 primary buy signals (B1-B10)
Additional buy-side indicators (HH - Higher High, ED - Expired Days)
14 sell signals (S1-S14)
Index Rise 6% signal for Distribution/Stalling Day expiration
Market Health Tracking
Distribution Day detection and counting
Stalling Day identification and validation
Automatic 25-day signal expiration
6% price rise monitoring for signal clearing
Market Condition Analysis
Rally Day detection (major and minor)
Follow-Through Day confirmation
Dynamic market exposure management (0-100%)
Power Trend analysis with multiple states
Risk Management Features
Circuit Breaker system for major declines
Buy Switch system for exposure control
Customizable volume analysis (Nasdaq/S&P 500)
Distribution day clustering detection
Visual Analysis Tools
IBD-style candle display option
Power Trend state visualization
Signal line drawing system
Customizable tooltips and alerts
Proper configuration of the indicator's settings is essential as it affects:
Signal detection sensitivity and accuracy
Market exposure calculations and adjustments
Volume confirmation requirements
Visual display of market conditions and signals
Alert system behavior and notifications
This guide provides detailed explanations of each component and setting to help you optimize the indicator for your trading strategy while maintaining adherence to IBD's proven methodology.
📊 General Settings
This section controls the indicator's tooltip display, alert behavior, and candle visualization preferences.
The General Settings panel allows you to configure tooltip modes, alert types, and candle appearance.
Tooltip Display Mode
Select how detailed the tooltips should be when hovering over signals and indicators:
The three tooltip display modes: Simple (left), Detailed (center), and Market Analysis (right).
Simple Mode
Displays concise signal definitions
Shows basic entry and exit conditions
Focuses on essential trigger points
Perfect for experienced traders
Detailed Mode
Provides in-depth explanations of each buy/sell signal
Shows complete validation criteria and conditions
Includes volume requirements and percentage thresholds
Explains the context and significance of each signal
Market Analysis Mode
Focuses on broad market health metrics
Shows market exposure percentage and trend
Displays buy switch and power trend status
Tracks distribution days and signal buffers
Note: Choose the tooltip mode based on your needs:
- Simple: Provides quick, essential information on signals for fast decision-making
- Detailed: Breaks down conditions for each buy/sell signal, ideal for users wanting in-depth explanations
- Market Analysis: Focuses on broad market health, including exposure, buy switch, distribution days, and trends
Market Exposure Alert System
The indicator alerts you when market exposure levels change, helping you adjust your positions accordingly.
Alert Types
On Close (Recommended)
Triggers only after bar closes
More reliable signals as price action is confirmed
Real-Time
Triggers immediately when conditions are met
Note: Signals may change by bar close
Setting Up Alerts
Click the "..." (More) button on the indicator label "$tradeviZion - IBD Market School"
Select "Add alert on $tradeviZion - IBD Market School..."
In the Create Alert dialog:
Settings tab:
Verify the symbol and timeframe (e.g., NASDAQ:IXIC , 1D)
Condition: Select "$tradeviZion - IBD Market School"
Alert function: Choose "Any alert() function call"
Expiration: Set to "Open-ended alert"
Alert name will auto-populate
Switch to Notifications tab:
Enable "Notify in app" for push notifications in the mobile app
Enable "Show toast notification" for on-screen alerts
Enable "Play sound" and customize duration (e.g., Thin, 10 seconds)
Optional settings:
Send email (requires profile settings configuration)
Webhook URL for POST requests
Send plain text for alternative email format
Click Create to activate the alert
Alert Messages
Message format: "Market exposure change for : Market exposure from % to %"
Example: "Market exposure change for NASDAQ:IXIC : 📈 Market exposure reduced from 100% to 75%"
📈 Arrow indicates exposure increase
📉 Arrow indicates exposure decrease
Messages include previous and new exposure percentages
Note: These alerts specifically track changes in market exposure levels, helping you stay aligned with market conditions. They are essential for maintaining proper position sizing and risk management.
Chart Style Options
IBD-style Candles
Enable to match Investor's Business Daily chart style
For MarketSmith style setup, right-click on chart and go to Settings
Navigate to Symbol tab
Uncheck Body, Borders, and Wicks
Press Alt+R to restore chart view if zoom affects display
To revert to original style, right-click on chart and go to Settings
Navigate to Symbol tab
Check Body, Borders, and Wicks
Color Based on Previous Close
Colors bars based on close vs. previous close
When enabled, determines colors by comparing current close to previous close
Use blue color for closes above previous
Use pink color for closes below previous
📈 Market Exposure Table Settings
Configure how the market exposure information is displayed on your chart.
The Market Exposure Table Settings panel allows you to customize the appearance and layout of the market status display.
Layout Options
• Hide Table
Completely hides the market status display
• Basic (2 Columns)
Shows main indicators in two columns
Compact view without signal list
Ideal for minimalist chart view
• Detailed (2 Columns with Signals)
Displays main indicators plus signal panel
Shows Buy and Sell signals in separate columns
Provides comprehensive market overview
• Stacked (1 Column, Compact)
Vertical layout with single column
Most space-efficient option
Ideal for smaller chart windows
Color Settings
Background : Dark gray background for the table
Text : White text for general information
Buy Signal : Green highlighting for buy signals
Sell Signal : Red highlighting for sell signals
Additional Options
Show Trading Wisdom: Enable rotating trading messages
Displays empowering trading messages
Helps reinforce disciplined trading practices
Updates every 5 bars with new wisdom
Includes tooltips with comprehensive trading guidance
Customizable yellow text color for messages
💹 Buy Signals Settings
This section controls the visibility and behavior of buy signals and related indicators.
The Buy Signals Settings panel allows you to configure signal visibility, volatility calculations, and visual appearance of buy signals.
Signal Display Options
Buy Signals Display : Choose display mode
Show Selected Signals
Hide All
Compact Signals
Individual Signal Toggles
Primary Buy Signals (B1-B10)
Special Indicators (HH, ED)
Understanding Buy Signals
B1: Follow-Through Day (FTD)
Buy on the initial FTD with volume higher than the previous day. You may use an FTD from an index other than the NASDAQ:IXIC , but if you do, you must stay within that index for future Buy and Sell Signals.
B2: Additional Follow-Through
Buy on all additional follow-through days within 25 days from a rally day that closes above the low of the initial follow-through day.
B3: Low Above EMA21
Buy on an up or flat day when the intraday low is at or above the EMA21. Note: Once you have a B3 or B4, you can't have another until it is reset by an S5.
Special Buy Indicators
HH: Higher High (No FTD after Rally)
Triggers when current close exceeds highest point since last confirmed rally. Must not have a Follow-Through Day (FTD). Buy switch turns on when close exceeds last rally's high and turns off if close drops below that high.
ED: Expired Days
Tracks Distribution and Stalling days that have aged out. Days are tracked for a specific trading period and expired days are removed from the count.
Index Rise Settings
Index Rise 6% from DD & SD
Toggle to enable/disable monitoring of price rises above Distribution and Stalling Days. Default value of 6% (adjustable) for monitoring rises above these days.
Understanding Index Rise
This feature tracks significant market recoveries by monitoring when the index rises substantially above Distribution Days (DD) or Stalling Days (SD). When the index rises 6% or more above the closing price of any DD or SD, it indicates a strong market recovery. This is an important signal because it helps identify when the market has shown enough strength to potentially overcome previous distribution periods. When triggered, this signal reduces the distribution day count, effectively acknowledging that the previous distribution pattern may no longer be as relevant due to the market's strong recovery.
B1 Signal Configuration
Volatility Settings
B1 Auto Volatility: Calculates FTD price requirement based on 200-day volatility
B1 Manual Volatility: Fixed value (default 1.245) when auto is disabled
Visual Settings
Label Size: Small (options: Tiny, Small, Normal, Large)
Signal Color: Light green background for buy signals
Text Color: Customizable text color for signal labels
Important Notes
Signal visibility affects both chart display and calculations
Auto volatility is recommended for most users
Manual volatility should only be adjusted by experienced users
Visual settings apply to all enabled buy signals
Confirmation Rules
Price Requirements
Follow-Through Day (B1) thresholds based on 200-day volatility:
Below 0.4% volatility: 0.7% gain required
0.4% to 0.55% volatility: 0.85% gain required
0.55% to 1% volatility: 1% gain required
Above 1% volatility: 1.245% gain required
EMA Breaks (S5/S6): 0.2% threshold below 21 EMA
Downside Reversal (B9): 1.75% high-to-low spread required
Volume Requirements
Distribution Days: Volume > previous day, with -0.20% or more price decline
Stalling Days: Volume ≥ 95% of previous day
Follow-Through Days (B1/B2): Volume > previous day
Accumulation Days (B7): Volume > previous day, close in upper 25% range
Sell Signals Settings
This section controls the visibility and behavior of sell signals and market weakness indicators.
The Sell Signals Settings panel allows you to configure signal visibility and visual appearance of sell signals and market health indicators.
Signal Display Options
Sell Signals Display: Dropdown with options to control signal visibility:
Show Selected Signals
Hide All
Compact Signals
Individual Signal Toggles
Primary Sell Signals: S1-S14 and CB (Circuit Breaker)
Market Health Indicators:
Distribution Days (DD): Indicative of institutional selling. Occurs when:
Market closes down by at least 0.2%
Volume greater than or equal to prior day
Tracked for 25 trading days
Stalling Days (SD): Sign of heavy volume without upside progress. Occurs when:
Market at/near new highs
Closes with small gain (0% to 0.4%)
High volume in lower half of day's range
Understanding Sell Signals
S1: Follow-Through Day Undercut
Sell if the index closes below the low of the initial follow-through day.
S2: Failed Rally Attempt
Sell if the index undercuts the major low of the rally attempt. Market exposure is reduced to zero and the Buy Switch is turned off.
S2ml: Minor Low Undercut
Minor Low undercut of rally attempt. Market exposure is reduced by two. This does not turn off the Buy Switch.
S3: Full Distribution Minus One
Sell after the distribution count increases to one less than the full distribution count.
S4: Full Distribution
Sell after reaching the full distribution count.
S5: Break Below EMA21
Sell if the index closes 0.2% or more below the EMA21. Note: Once you have an S5, S6, or S7, you can't have another until it is reset by a B3.
S6: Overdue Break Below EMA21
Sell if the index closes down 0.2% or more below the EMA21 after 30 days have passed since the last B3 without triggering an S5.
S7: Trending Below EMA21
Sell after S5 on the 5th consecutive day that the high is below the EMA21 and a down day.
S8: Living Below EMA21
Sell after S5 on the 10th and every 5th consecutive day after that (15th, 20th, 25th, etc.) that the high is below the EMA21.
S9: Break Below 50-Day MA
Sell if the index closes below the 50-Day Moving Average. Triggers only if a B6 signal was previously printed.
S10: Bad Break
Sell if the close is down 2.25% or greater in the bottom 25% of the range. Close below the MA50 or intraday high below EMA21.
S11: Downside Reversal
Sell after a Downside Reversal Day, which occurs with:
New High within 13 weeks
Close in bottom quartile of range
Close Down for the day
Spread of 1.75% or greater
S12: Lower Low
Sell after closing below the last marked low as defined by MarketSmith.
S13: Distribution Cluster
Distribution and stalling days increase to four up to eight days within a rolling eight-day period.
S14: Break Below Higher High
Sell after closing below the last marked high that printed a B8 (Higher High).
CB: Circuit Breaker
Triggers when the index drops 10% from the highest high since the FTD (B1) and falls 5% or more below the 50-Day MA intraday.
Buy/Sell Undercut Lines
This section controls the visibility and appearance of important price level lines on your chart.
The Buy/Sell Undercut Lines panel allows you to configure which signal lines are displayed and their visual appearance.
Line Visibility
Buy Signal Lines :
B8 Line: First high above the last pivot high
HH Line: Close above the prior high since last confirmed rally without FTD
Sell Signal Lines :
S1 Line: Close below the initial follow-through day
S2 Line: Undercut of major low
S2ml Line: Minor low undercut
S12 Line: Close below last marked low
S14 Line: Close below last marked high
Line Appearance
Color Settings :
B8: Green (Buy signal)
HH: Green (Buy signal)
S1: Red (Sell signal)
S2: Red (Sell signal)
S2ml: Orange (Modified sell signal)
S12: Purple (Pivot low signal)
S14: Blue (Close below pivot)
Line Style : Dashed (options: solid, dotted, dashed)
Line Width : 1 (adjustable)
📈 Rally Signal Settings
The Rally Signal Settings panel allows you to configure Rally Day detection and visualization.
Rally Day:
Toggle to enable/disable Rally Day signals. These mark the beginning of potential market uptrends when the market closes higher than the previous day, following a significant decline.
Visual Settings:
Label Size: small (options: tiny, small, normal, large)
Background Color: Customizable background for Rally Day labels
Text Color: Customizable text color for Rally Day labels
Distribution Day Settings:
Use Manual FullDDcount: Option to manually set the minimum combined number of Distribution and Stalling Days
Count Value: Default is 6 days (adjustable when manual mode is enabled)
This setting determines how many Distribution/Stalling Days are required to trigger a new rally
Pivot Point Settings
The Pivot Point Settings panel allows you to configure the display of high/low points and percentage changes between pivots.
Display Options
Display H/L Points
Toggle to show or hide pivot levels (high and low points) on the chart
%Change
Toggle to display percentage changes between pivot points
Color Settings
Positive % Color : Blue (customizable) - Used for positive percentage changes
Negative % Color : Pink (customizable) - Used for negative percentage changes
Precision Settings
Decimal Places: Set the number of decimal places (default: 2) for:
Pivot point price levels
Percentage change calculations
⚡ Power Trend Settings
This section controls how Power Trend information is visualized on your chart.
The Power Trend Settings panel allows you to configure how trend states are displayed and customize their visual appearance.
Example of Power Trend visualization showing both boxes (green background) and trend lines. The boxes indicate trend state while lines show trend transitions.
Display Options
Show Power Trend Line : Display trend states as lines on the chart
Show Boxes : Display trend states as boxes
Show Background : Display trend states as background colors
Power Trend Color Settings
On : Light green - Full power trend active
Resume : Light green - Power trend resuming
Off : Gray - Power trend inactive
With Floor : Yellow - Under pressure with support
No Floor : Orange - Under pressure without support
Power Trend Line Settings
Line Width : Set line thickness (default: 1)
Line Offset : Adjust line position (default: 5)
Power Trend Box Settings
Text Align : Set text alignment (left, center, right)
Text Position : Set vertical position (top, middle, bottom)
Size : Set box size (tiny, small, normal, large)
Color : Customize box background color
Power Trend States
Full Power (On)
Represents strongest market condition with maximum exposure of +7
Base maximum exposure of 5 plus 2 buffer signals
Buffer allows maintaining high exposure during normal pullbacks
2 sell signals reduce count from 7 to 5 without affecting base
Indicates very healthy market that can absorb normal profit-taking
Resume State
Shows successful market recovery after pressure period
Requires 10+ days without S2 minor, S9, or S13 signals
Must reestablish all initial strength conditions
Maintains same benefits as Full Power (+7 max, +2 floor)
Shows as light green in visualization
Under Pressure With Floor
First warning stage triggered by S2 minor or S13 signals
Reduces maximum exposure to +5
Maintains minimal protection with +1 floor
Suggests defensive positioning while keeping core positions
Shows as yellow in visualization
Under Pressure No Floor
Severe warning stage triggered by S9 signal
Maintains +5 maximum exposure but removes floor protection
Indicates higher risk of continued market decline
Requires careful position management
Shows as orange in visualization
Power Trend Off
Triggered by EMA/MA crossdowns with declining price
Can also be activated by S2 or Circuit Breaker signals
Maximum exposure limited to +5 with no buffer signals
Suggests focus on capital preservation
Shows as gray in visualization
Power Trend System Rules
Each state enforces strict exposure limits with automatic floor and ceiling adjustments
Power Trend can activate Buy Switch when entering Full Power state
Restraint Rule limits exposure to +2 until significant progress or B4 signal when starting from zero exposure
State transitions immediately update exposure limits and Buy Switch status
Distribution Cluster (S13) can move Power Trend to Under Pressure With Floor state
System maintains exposure floors to prevent panic selling while allowing flexibility below floor levels
Weekly SMAs Settings
The Weekly SMAs Settings panel allows you to configure the weekly moving averages display and calculations.
SMA 1: 10 periods (enabled), Red
Length: 10
Optional EMA toggle
Width: 1
SMA 2: 20 periods, Pink
Length: 20
Optional EMA toggle
Width: 1
SMA 3: 30 periods, Green
Length: 30
Optional EMA toggle
Width: 1
SMA 4: 40 periods (enabled), White
Length: 40
Optional EMA toggle
Width: 1
SMAs Settings
The SMAs Settings panel allows you to configure the daily moving averages display and calculations.
MA 1: 10 periods, Optional EMA, Pink
Length: 10
Optional EMA toggle
Width: 1
MA 2: 21 periods (enabled), EMA, Green
Length: 21
EMA enabled
Width: 1
MA 3: 50 periods (enabled), SMA, Red
Length: 50
EMA disabled
Width: 1
MA 4: 200 periods (enabled), SMA, White
Length: 200
EMA disabled
Width: 1
Volume Settings (NASDAQ & S&P 500)
This section controls volume data sources for market analysis. Proper volume settings are crucial for confirming market signals and analyzing institutional participation.
The Volume Settings panel allows you to configure volume data sources and custom ticker options for accurate market analysis.
Important Volume Source Information
TradingView's default volume data differs from IBD's Yahoo Finance data source
Current default settings (IXIC and TVOL) provide the most accurate results compared to IBD signals
Volume differences between TradingView and IBD are expected due to different data sources
Custom ticker options are provided for future compatibility with Yahoo Finance volume data
Volume Configuration
Nasdaq Volume Settings
Default Source: NASDAQ:IXIC (Nasdaq Composite Index)
Custom Ticker Option: USI:TVOL.NQ
Enable custom source by checking "Use Custom Nasdaq Ticker?"
Note: Custom ticker must be price-based for accurate volume analysis
S&P 500 Volume Settings
Default Source: TVOL (S&P 500 Total Volume)
Custom Ticker Option: USI:TVOL.NY
Enable custom source by checking "Use Custom S&P 500 Ticker?"
Note: Custom ticker must be price-based for accurate volume analysis
Volume Analysis Impact
Used for Distribution Day confirmation
Required for Follow-Through Day validation
Helps identify institutional buying/selling
Critical for Stalling Day detection
Recommendations
Keep default settings for most accurate current results
Only use custom tickers if you have confirmed price-based volume sources
Be aware that volume-based signals might slightly differ from IBD due to data source differences
Future updates may add Yahoo Finance volume compatibility
Market Status Table
The Market Status Table provides a real-time visual overview of current market conditions and signal status. Users can customize the table's appearance through the Market Exposure Table Settings.
The Market Status Table can be displayed in three different layouts: Basic (left), Detailed (center), and Stacked (right).
Layout Options
Hide Table
Completely hides the market status display
Basic (2 Columns)
Shows main indicators in two columns
Compact view without signal list
Ideal for minimalist chart view
Detailed (2 Columns with Signals)
Displays main indicators plus signal panel
Shows Buy and Sell signals in separate columns
Provides comprehensive market overview
Stacked (1 Column, Compact)
Vertical layout with single column
Most space-efficient option
Ideal for smaller chart windows
Main Indicators
• Market Exposure
Displayed as colored dots: 🟠 🟢 🟢 🟢 🟢
Shows current exposure level (0-100%)
(⚪ ⚪ ⚪ ⚪ ⚪): 0% exposure
(🟠 ⚪ ⚪ ⚪ ⚪): 30% exposure
(🟠 🟡 ⚪ ⚪ ⚪): 55% exposure
(🟠 🟡 🟢 ⚪ ⚪): 75% exposure
(🟠 🟡 🟢 🟢 ⚪): 90% exposure
(🟠 🟡 🟢 🟢 🟢): 100% exposure
• Key Status Indicators
Buy Switch: Shows ON (forced) or OFF status
Power Trend: Displays current state with floor and maximum values
Restraint Rule: Indicates ON or OFF status
Count / Signals Buffer: Shows current count and available buffer (e.g., "7 / (+0)")
Dist. Days / Cluster: Displays distribution day count and cluster status (e.g., "1 / 0")
• Signal Panel (Available in Detailed layout)
Lists all active Buy and Sell signals
Highlighted signals indicate currently active conditions
Green highlighting shows confirmed signals
Provides quick reference for all available signals
Status Indicator Colors
🟢 indicates "ON" or positive conditions (e.g., Buy Switch ON, Power Trend Full Power)
🟡 indicates "Under Pressure" or caution (e.g., Power Trend Under Pressure With Floor)
🟠 indicates "Under Pressure No Floor" or increased caution
🔴 indicates "OFF" or negative conditions (e.g., Buy Switch OFF, Power Trend OFF)
• Signal Colors
Green background for buy signals
Red background for sell signals
Black text on signal backgrounds for better visibility
• Number Formats
Count / Buffer signals shown as "7 / (+2)"
Distribution Days / Cluster count shown as "1 / 0"
Exposure percentage shown with dots (e.g., "90%")
Trading Wisdom - Market Risk Management
"The key to successful trading is not just knowing when to enter, but managing your exposure based on market health. Always check two critical indicators before any trade:
1. Market Exposure Levels
100% (5 dots): Full positions in strong market
90% (4 dots): Slightly reduced positions
75% (3 dots): Moderate positions, more cautious
55% (2 dots): Half positions only
30% (1 dot): Small positions only
0% (0 dots): Stay in cash
2. Distribution Days Risk Levels
1-2 Days: Normal market behavior
3 Days: Caution - reduce new positions
4+ Days: High risk - defensive positioning
5-6 Days: Consider moving to cash
Remember: It's better to miss an opportunity than to catch a falling market. Let the Market Exposure Table be your guide to smart position sizing."
Pro Tip: Make checking these two indicators part of your daily routine. They're your first line of defense against major drawdowns.
Conclusion
The IBD Market School indicator brings William O'Neil's proven methodology to TradingView, providing a comprehensive system for market analysis and risk management. This tool automates the complex task of tracking market signals while maintaining strict adherence to IBD's time-tested principles.
Key Features
Follows IBD's core methodology for identifying market direction
Automates tracking of Distribution Days, Follow-Through Days, and market signals
Provides clear market exposure guidance through the Power Trend system
Helps maintain discipline through systematic Buy Switch control
Offers multiple layers of risk management
Best Practices
Always check Market Exposure and Distribution Day count before making trades
Let the Buy Switch guide your market participation
Follow Power Trend states for proper position sizing
Use the default volume settings for most accurate signal generation
Monitor all confirmation rules for proper signal validation
Remember: This indicator is designed to replicate IBD's methodology as closely as possible within TradingView's environment. While it automates signal detection and exposure management, successful trading still requires discipline, patience, and strict adherence to risk management principles.
"The goal is not to be right about the market - it's to make money by following the market's signals and managing risk."

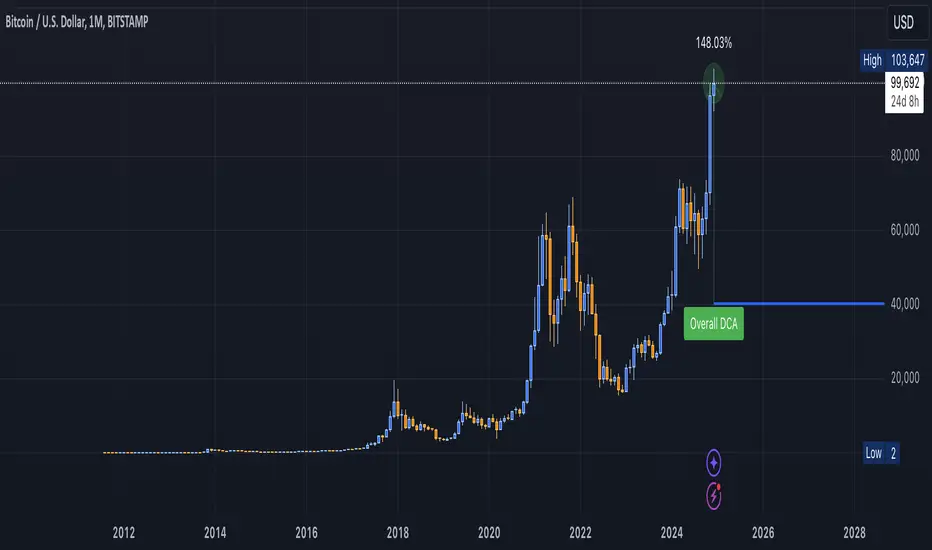
DCA Valuation & Unrealized GainsThis Pine Script for TradingView calculates and visualizes the relationship between a Dollar Cost Average (DCA) price and the All-Time High (ATH) price for over 50 different cryptocurrencies. Here's what it does:
1. Inputs for DCA Prices:
- Users can manually input DCA prices for specific cryptocurrencies (e.g., BTC, ETH, BNB).
2. Dynamic ATH Calculation:
- Dynamically calculates the ATH price for the current asset using the highest price in the chart's loaded data and persists this value across bars.
3. Percentage Change from DCA to ATH:
- Computes the percentage gain from the DCA price to the ATH price.
4. Visualizations:
- Draws a line at the DCA price and the ATH price, both extended to the right.
- Adds an arrow pointing from the DCA price to the ATH, offset by 10 bars into the future.
- Displays labels for:
- The percentage gain from DCA to ATH.
- "No DCA Configured" if no valid DCA price is set for the asset.
5. Color Coding:
- Labels and arrows are color-coded to indicate positive or negative percentage changes:
- Green for gains.
- Red for losses.
6. Adaptability:
- The script dynamically adjusts to the current asset based on its ticker and uses the corresponding DCA price.
This functionality provides traders with clear insights into their investment's performance relative to its ATH, aiding in decision-making.
-----
To add a new asset to the script:
1. Define the DCA Input: Add a new input for the asset's DCA price using the `input.float` function. For example:
dcaPriceNEW = input.float(title="NEW DCA Price", defval=0.1, tooltip="Set the DCA price for NEW")
2. Add the Asset Logic: Include a conditional check for the new asset in the ticker matching logic:
if str.contains(currentAsset, "NEW") and dcaPriceNEW != 0
dcaPrice := dcaPriceNEW
Where NEW is the ticker symbol of the asset you're adding.
NOTE: SOLO had to be put before SOL because otherwise the indicator was pulling the DCA price from SOL even on the SOLO chart. If you have a similar issue, try that fix.
Adding an asset requires only these two changes. Once done, the script dynamically incorporates the new asset into its calculations and visualizations.
IU VaR (Value at Risk) Historical MethodThis Pine Script indicator calculates the **Value at Risk (VaR)** using the **Historical Method** to help traders understand potential losses during a given period( Chart Timeframe) with a specific level of confidence.
What is Value at Risk (VaR) ?
Value at Risk (VaR) is a measure used in finance to estimate the potential loss in value of an asset, portfolio, or investment over a specific time period, given normal market conditions, and at a certain confidence level.
Example:
Suppose you invest ₹1,00,000 in stocks. A VaR of 5% at a 95% confidence level means:
- There is a **95% chance** that you won’t lose more than **₹5,000** in a day.
- Conversely, there is a **5% chance** that your loss could exceed ₹5,000 in a day.
VaR is a helpful tool for understanding risk and making informed investment decisions!
How It Works:
1. The indicator calculates the percentage difference between consecutive bars.
2. The differences are sorted, and the VaR is determined based on the assurance level you specify.
3. A label displays the VaR value on the chart, indicating the potential maximum loss with the selected assurance level within one period eg - ( 1h, 4h , 1D, 1W, 1M etc as per your chart timeframe )
Key Features:
- Customizable Assurance Level:
Set the confidence level (e.g., 95%) to determine the probability of loss.
-Historical Approach:
Uses the past percentage changes in price to calculate the risk.
-Clear Insights:
Displays the calculated VaR value on the chart with an informative tooltip explaining the risk.
Use this tool to better understand your market exposure and manage risk!

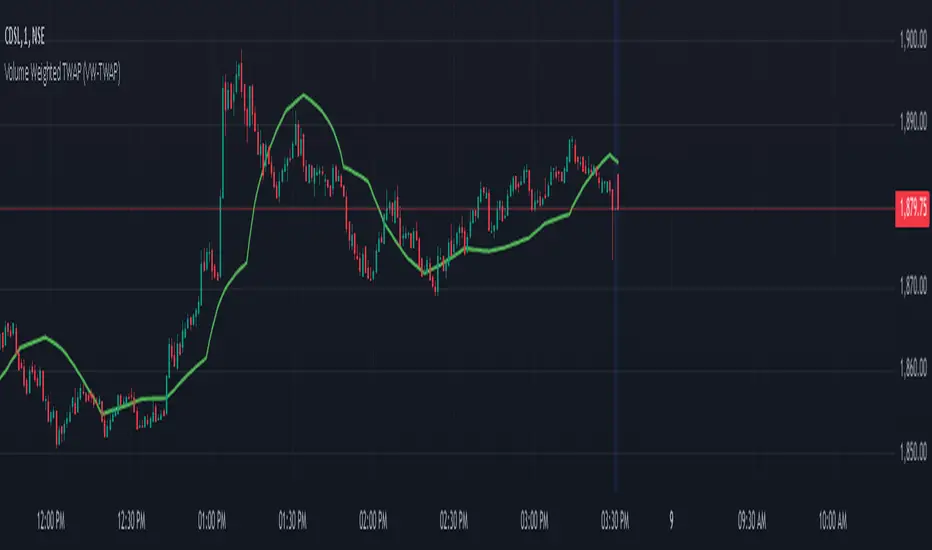
Volume Weighted TWAP (VW-TWAP)The Volume Weighted Time Weighted Average Price (VW-TWAP) is an indicator that combines the principles of price averaging with volume sensitivity. Unlike the traditional TWAP, which calculates a simple time-weighted average, VW-TWAP integrates volume into its computation, emphasizing price movements that occur during periods of higher trading activity. This makes it particularly effective for identifying realistic price levels influenced by significant market participation. It is computed by summing the volume-weighted prices over a specified period and dividing by the total volume, providing a more accurate reflection of the price participants value most.
The key benefits of VW-TWAP lie in its ability to guide both traders and investors with a data-driven perspective. By accounting for both time and volume, it highlights fair value zones where significant accumulation or distribution might occur. This can improve trade entries and exits by aligning decisions with zones of substantial market consensus. Furthermore, its adaptability to different timeframes enhances its utility in multi-timeframe analysis, making it suitable for intraday scalpers and long-term swing traders alike. The VW-TWAP's focus on volume sensitivity also minimizes noise from low-volume, erratic price movements, offering a clearer view of market dynamics.
Relative Price Strength (RPS)Relative Price Strength (RPS) is a technical analysis indicator that measures the performance of a specific symbol relative to a benchmark or "Base Symbol".
It's essentially a ratio that compares the price of the specific symbol to the price of the benchmark.
Rising RPS: Indicates that the symbol is outperforming the benchmark.
Falling RPS: Suggests that the symbol is underperforming the benchmark.
RSP is smoothed over a period for better visualization.

Leveraged Chart with Financing, Portfolio DCA & NormalizationLeveraged Investment Simulator with Portfolio DCA & Performance Metrics
Overview:
This indicator helps simulate leveraged investment strategies, incorporating financing costs, Dollar Cost Averaging (DCA), and performance metrics. Ideal for analyzing leveraged growth on price charts or managing portfolios with periodic contributions.
Key Features:
Dual Simulation Modes:
- Chart Mode: Simulate leveraged growth directly on the price chart.
- Portfolio Mode: Track portfolio performance with periodic DCA contributions.
Leverage & Financing Fees:
- Adjustable leverage multiplier.
- Annual financing fees to model borrowing costs.
Dollar Cost Averaging (DCA):
- Set an initial investment and recurring deposit amounts.
- Choose contribution frequency: Monthly, Quarterly, or Yearly.
Performance Metrics:
- Sharpe Ratio: Evaluate risk-adjusted returns.
- Sortino Ratio: Assess downside risk-adjusted performance.
- Maximum Drawdown: Measure the largest decline from a peak.
Customizable Labels:
- Enable or disable specific sections, such as portfolio details and risk metrics.
Inputs:
Symbol selection (default: AAPL).
Data timeframe (e.g., daily, weekly, monthly).
Leverage multiplier and annual financing fees.
Portfolio options: Initial investment, deposit amounts, and frequencies.
Performance analysis options, including a customizable risk-free rate for Sharpe/Sortino ratios.
Toggleable label sections for focused analysis.
How to Use:
Add the indicator to your chart.
Configure the inputs to match your strategy (e.g., leverage factor, financing rates, DCA settings).
Toggle on/off the label sections to display relevant metrics.
Analyze the results:
Chart Mode: Observe leveraged growth on the price chart.
Portfolio Mode: Track portfolio growth, contributions, and performance metrics.
Benefits:
Simulate realistic scenarios with leverage, financing costs, and periodic investments.
Assess performance with advanced metrics like Sharpe and Sortino Ratios.
Identify risk with Maximum Drawdown analysis.
Customize your view for clarity and focus.
This indicator is perfect for traders and investors looking to optimize leveraged strategies or manage portfolios with DCA contributions effectively.

ICTProTools | ICT Insight - Market Environment🚀 INTRODUCTION
The Market Environment Indicator provides traders with an essential contextual framework for analyzing price movements. Built on the principles of ICT (Inner Circle Trader) and Smart Money Concepts (SMC), this tool offers a structured view of how institutional players drive markets through liquidity manipulation and price level interactions. By defining the market environment, the indicator helps traders focus on the most relevant price zones, reducing distractions and enhancing decision-making.
At its core, the Interbank Dealing Range (IBDR) creates a clear structure of protected highs/lows and Premium/Discount zones , highlighting key areas for potential price reactions. This framework gives traders a lens to interpret market behavior and concentrate on meaningful liquidity zones and price action. The indicator helps traders navigate the market with precision, spotting significant opportunities while filtering out market noise. Indeed, the IBDR isn't always easily identifiable, and not every move will form a distinct dealing range.
This indicator goes beyond mere price levels… It reveals the larger market context in which prices evolve. By mastering this environment, traders can align their strategies with institutional logic and make well-informed decisions.
💎 FEATURES
The Interbank Dealing Range (IBDR) is a crucial concept within the ICT methodology that helps traders identify the market environment across multiple timeframes, specifically the premium and discount zones. The IBDR delineates areas where traders have the potential to buy low and sell high.
Its extremes are defined by the sweep of both buy-side and sell-side liquidity . These levels indicate the boundaries within which price is expected to evolve . Understanding these boundaries allows traders to determine where it is appropriate to enter or exit trades.
The primary goal of utilizing the IBDR is to capitalize on price movements by buying at discounted levels and selling at premium levels. This strategy aligns with the fundamental principle of trading: to buy at lower prices and sell at higher prices, maximizing profit potential.
By visualizing the IBDR on your charts, you can gain valuable insights into the prevailing market conditions and make informed trading decisions that align with the institutional approach to buying and selling.
This chart illustrates the Interbank Dealing Range (IBDR) applied to the US100 index, displaying two from different timeframes: a 1-hour (1h) IBDR on the left and a 30-minute (30m) IBDR on the right. This multi-timeframe view provides essential context for price action analysis.
The 1h IBDR could here function as the primary reference range, establishing key boundaries (High and Low) for price movement. Within this range, the Equilibrium (midpoint) separates the Premium zone (above) from the Discount zone (below). The 0.25 and 0.75 levels add further precision by subdividing these zones.
Price action then flows between these zones, creating and targeting liquidity at higher and lower levels through Relative Equal Highs and Lows. A strong upward movement into the deeper level of the Premium Zone captures high-side liquidity (with a notable reaction at the FVG on the left), forming a secondary 30m IBDR. After this liquidity sweep, the remaining liquidity is on the low side. Price then reverses downward toward it. Here, the 30m IBDR would suggest a confirmation for a potential sell entry by targeting the IBDR lows.
The relationship between the broader 1h IBDR, the more detailed 30m IBDR, and all related levels creates a powerful analytical framework. The larger timeframe provides context, while the smaller one reveals specific trading opportunities by providing entry confirmations.
✨ SETTINGS
IBDR Metrics: Adjust the timeframe and sensitivity for calculating the IBDR so traders can adapt the indicator to both short-term intraday movements and longer-term trends.
Premium/Discount Zones: Customize the levels such as 0, 0.5, 1, and other levels like 0.25 and 0.75 by default and their displayed colors and associated labels.
Alerts: Configure the alerts for Premium/Discount zones, High/Low breaks, and new IBDR, ensuring traders are kept up to date on key market events.
🎯 CONCLUSION
The Market Environment indicator serves as a powerful tool for analyzing and navigating market structure through liquidity zones. It helps identify optimal buy and sell areas while aligning with the institutional logic of major market players. While its features provide a valuable edge, it’s essential to remember that none should be used on its own, and many more factors go into being a profitable trader.

ICTProTools | ICT Insight - Momentum Structures🚀 INTRODUCTION
The Momentum Structures Indicator builds upon the principles of ICT (Inner Circle Trader) and Smart Money Concepts (SMC) to give traders a clearer view of market dynamics. These methods reveal how institutional trading activity shapes price movements, particularly through different types of market liquidity.
The indicator is designed to provide traders with advanced insights into market dynamics by focusing on key price imbalances and higher-timeframe structures . By combining these elements, the indicator allows users to analyze price behavior across multiple timeframes, helping them anticipate potential liquidity pools and price reversals. The emphasis on price imbalances and liquidity zones makes it a versatile tool for both intraday and longer-term strategies, providing critical insights for understanding market cycles and potential turning points.
💎 FEATURES
Imbalance Bar Colors / Zones
Imbalances are fundamental components of the ICT methodology, highlighting areas where price accelerates, creating gaps that may indicate a lack of liquidity . These voids often point to potential reversal or continuation zones in the price action.
An imbalance typically arises when supply and demand are out of balance, resulting in a gap between price levels. Traders keep a close eye on these gaps, as they could present opportunities to enter trades when the price revisits them , as they suggest a strong institutional interest.
We can notice two types of imbalances… A Fair Value Gap (FVG) usually forms from three consecutive candles, defining the space between the wicks of the first and last candle. Conversely, a Volume Imbalance (VI) occurs when a gap appears between the opening and closing prices of two consecutive candles. When these imbalances align with FVGs, they offer a well-rounded framework for assessing market strength.
By analyzing both FVGs and VIs together, traders can gain valuable insight into potential price movements and better evaluate the likelihood of continuation or reversal.
This chart illustrates the Fair Value Gaps (FVG) and Volume Imbalances (VI) within the GBPUSD price action. The FVG Bar Color and FVG Zone represent the same Fair Value Gaps, and similarly, the VI Bar Color and VI Zone display the same Volume Imbalances. They highlight areas where rapid price movements have created gaps in the market. These gaps indicate potential zones for trade entries or exits as the price may return to fill them. As we can see on the chart, the major part of imbalances created has already been filled. They constitute really interesting Point of Interest (POI).
The 50% FVG line marks the midpoint of the gap, which is often considered an important level for price action. A clear example appears in the Bearish FVG on the top left, where price first filled it below the midline, creating a small reaction. The price then liquidated this "fake mitigation" by moving just above the midline before beginning its significant downward movement. This demonstrates the crucial role of imbalances and how precisely price interacts with them.
Traders can use this information to identify potential buying or selling opportunities based on the interaction of price with these gaps and volume imbalances, aiding in the development of their trading strategies.
PO3 Candles (Power of Three)
The Power of Three is a critical concept in the ICT methodology that analyzes Higher Timeframe (HTF) candles focusing on the opening price, high wick, low wick, and closing price. This framework helps traders understand the current market cycle, in three phases , and its trading implications.
Accumulation Phase: In this initial phase, the price consolidates around the opening price as the market gathers liquidity. This often signals that larger players are positioning for the next move.
Manipulation Phase: Represented by the candle wicks, this phase indicates the extreme points where liquidity grabs often occur. Observing these wicks helps traders identify the end of the accumulation phase and potential turning points.
Distribution Phase: The candle body reflects a decisive price movement in one direction , following accumulation and manipulation. Traders align with the direction of this phase to capture the “real candle move”.
Our indicator provides you with the valuable capability to integrate the True Day Range, as defined by ICT. This concept, rooted in institutional logic, defines a trading day as starting at 00:00 New York time. You can customize it to match your trading style and analysis needs.
You can also overlay imbalances (FVG and VI) directly onto PO3 Candles, seamlessly combining imbalance detection with high-timeframe price action. This approach gives you a sharper market perspective, uncovering potential turning points with greater clarity.
In summary, PO3 Candles help traders assess the market structure and identify cycle positions on HTF candles, enabling them to make more strategic trading decisions, which allows for better entry and exit timing, avoiding traps, and seizing the best opportunities to capture significant market moves.
This chart illustrates the application of the Power of Three concept to EURUSD price action, highlighting key phases of market behavior.
In this example, we observe the Daily candles, where a significant Bullish imbalance appears from previous days, forming a Fair Value Gap (FVG). Additionally, there’s a small Volume Imbalance (VI) at the candle's opening, signaling liquidity that the price needs to fill.
Now, focusing on the Weekly candle, we can clearly identify its phases. First, there's an accumulation phase around the opening price, which, as shown by the Daily candles, took some time to develop. Then, the manipulation phase occurs, signaled by the upper wick of the Weekly candle, which liquidates the previously created accumulation. It’s time to look for a potential selling position... Finally, the price falls, beginning to form its bearish body and completing the real move of the week.
This framework allows traders to better understand the market structure and make informed decisions based on the current cycle.
Standard Deviation (STD)
The Standard Deviation (STD) is a concept within the ICT methodology that focuses on identifying periods of consolidation within the market. Specifically, it examines the Central Bank Dealers Range (CBDR) , which occurs between 13:00 and 23:00 New York time. During this period, the market often exhibits consolidation , creating an environment where price action stabilizes before making significant moves.
This consolidation forms the basis of the Standard Deviation (STD) concept. This is based on the idea that the volatility observed during this consolidation phase can be used to anticipate future market volatility. Once this consolidation is identified, the STD framework duplicates the established range both above and below the consolidation area.
As price approaches these duplicated levels, it offers traders critical information on where to anticipate potential reactions. If the price nears the upper boundary of the consolidation, it suggests a potential reversal point, indicating an opportunity to consider selling. Conversely, if the price approaches the lower boundary, it may signal an opportunity to look for buying positions . This duplication could enable traders to determine potential high and low points for the trading day or week for example.
Finally, the Standard Deviation (STD) concept provides a valuable framework for identifying potential key reaction points in the market by leveraging consolidation within the CBDR. By duplicating these ranges, traders can anticipate significant price movements and refine their strategies.
This chart illustrates the Standard Deviation (STD) concept applied to EURUSD price action. The highlighted areas in blue indicate high duplications and low duplications derived from the consolidation identified during the Central Bank Dealing Range (CBDR), marked by the dark gray rectangle.
The high duplications represent potential resistance levels, suggesting areas where the price may encounter selling pressure, while the low duplications signify potential support levels, indicating where buying interest could emerge.
The annotations emphasize how price reacts at these duplicated levels, showing the critical role of the STD in determining where price movements may stall or reverse. In this example, the price responded perfectly to both an upward and a downward duplication, confirming that these levels could represent the day's high and low, an observation validated here. This highlights the precision of price movements, with the price stopping exactly at the full duplication levels (but we can not that the price could also have paused at the midline levels, indicated by the dashed gray lines).
This visualization helps traders anticipate potential reactions and align their strategies with market dynamics, ensuring informed decision-making based on established price behavior.
✨ SETTINGS
Imbalance Bar Colors / Zones: Choose to display FVGs, VIs, or both, with customizable color settings. Choose to extend zones or set them to be removed when mitigated.
PO3 Candles: Customize the PO3 Candles for different timeframes (Daily, Weekly, Monthly), including the calculation Mode (Classic or True Day Range) and timezone associated, and set your body, border, and wick preferred colors. The Imbalance Bar Color and FVG Zones can also be displayed on these HTF candles, as they are configured in their settings.
STD: Select the timeframe on which to base it and configure the number of duplications and midline settings. You can also define the time range and timezone related to consolidation detection, giving you control over when and where the STD should apply.
🎯 CONCLUSION
The Momentum Structures Indicator combines the core principles of ICT and Smart Money Concepts to provide traders with advanced tools for understanding market dynamics. By focusing on key elements like imbalances and liquidity zones, it offers a comprehensive framework for analyzing price behavior. This indicator empowers traders to identify key market phases, anticipate potential reversals, and refine their entry and exit points with precision. While its features provide a valuable edge, it’s essential to remember that none should be used on its own and many more factors go into being a profitable trader.

ICTProTools | ICT Insight - Time & Price Zones🚀 INTRODUCTION
The Time and Price Zones indicator builds upon the foundational concepts of ICT (Inner Circle Trader) and Smart Money Concepts (SMC). These methodologies analyze the behavior of institutional traders (known as "smart money") by focusing on liquidity, key price levels, and market timing.
Liquidity refers to areas with high concentrations of pending orders (stops, take-profits, entries) in the market. Large institutions efficiently need to execute their massive orders without causing excessive slippage. To achieve this, they strategically create and exploit liquidity pools by driving the price toward areas where retail traders cluster their positions.
Then, through "liquidity grabs" or "stop hunts,” institutions accumulate or distribute positions at optimal prices . This strategy allows them to fill large orders with minimal market impact, typically clearing out retail traders' positions before the price reverses.
This indicator helps traders apply these principles by merging time-based and price-based analysis tools for better market understanding. By combining high-impact sessions like Kill Zones with pivotal price markers such as Previous Highs and Lows, traders can see where institutional activity intersects with liquidity pools, improving their decision-making.
This powerful combination allows users to monitor market dynamics in real time, helping them spot sentiment shifts and identify crucial turning points more effectively.
💎 FEATURES
Kill Zones
Kill Zones are critical periods of the trading day characterized by heightened institutional activity, resulting in increased liquidity and significant price movements. By recognizing these zones, you can strategically focus your efforts on the most advantageous moments for trading.
The Asian Session , which runs from 5 PM to 1 AM New York time, serves as an essential liquidity provider before the onset of more volatile trading periods. This session is intricately linked to the Smart Money Tool (SMT - See below), as the highs and lows established during this period provide foundational liquidity levels. You can set alerts when these levels are breached , allowing you to stay informed without constant chart monitoring and make timely trading decisions.
Transitioning into the London Kill Zone from 2 to 5 AM New York time marks the beginning of the European session, often associated with increased volatility. Following this, the New York Kill Zone , occurring from 7 to 10 AM , sees significant overlap between the London and New York sessions, where liquidity flows intensify and frequently correlate with notable price reversals. Finally, the London Close from 10 to 12 PM signifies the end of the European session, often ending the day with a retracement in the daily range.
Thanks to the timezone you can select relative to a region, Kill Zones will automatically adapt to time changes throughout the year and between different brokers , ensuring accurate Kill Zone timings without manual adjustments.
Incorporating our advanced Kill Zones indicator into your trading strategy gives you unparalleled insights and enhanced functionality. With integrated alerts for breaches of key levels, you can stay informed and ready to act without the need for constant chart monitoring, allowing you to focus on executing your trading strategies effectively.
We can see on this chart the identified Kill Zones during the trading day on EURUSD , including the Asian Session in gray, which tends to consolidate slightly (creating liquidity), the London Kill Zone in orange, which tends to move fast, often taking Asian quickly, the New York Kill Zone in green, with always a lot of movements, and the London Close in blue, seeming rather to retrace.
The midline indicates the 50% mark of the session, serving as a reference point for potential price reactions. Additionally, the highs and lows established during the Asian Session are linked to the Smart Money Tool (SMT) and can trigger alerts when breached. Here, you could have received an alert when Asian Low (marked AL) and Asian High (marked AH) were swept.
Previous & Open Levels
Previous and Open levels are key elements in ICT methodology, showing important price points from major timeframes (Daily, Weekly, Monthly). These levels (Previous High, Low, Open, and their separators) help traders understand price dynamics and anticipate market shifts.
The Previous levels connect directly to the Smart Money Tool (SMT - See below) as they provide foundational liquidity levels. In ICT methodology, previous are levels where many traders place their Stop Loss, thus creating liquidity. This helps you understand potential market reactions and whether prices will likely continue their trend or reverse.
You’ll be instantly notified whenever the price interacts with any of these Previous levels. This means you can stay informed about critical market movements without the need to monitor your charts constantly.
The indicator also displays Opening prices and includes separators for daily, weekly, and monthly levels, offering a clear market overview.
Open levels can act as simplified indicators of Premium and Discount Zones. To be above the opening price can be considered as the Premium Zone , where the market offers higher prices, typically suitable for selling opportunities. Conversely, to be below this price can be considered as the Discount Zone , where prices are relatively lower, offering potential buying opportunities.
These visual elements help you identify crucial market zones that reflect both past price action and current market dynamics.
Our indicator offers you the exclusive ability to integrate the True Day Range, as described by ICT. Based on institutional logic, this concept defines the trading day starting at 00:00 New York time. You can adapt this flexible feature to match your trading style and analysis needs.
By incorporating our advanced Previous levels indicator into your trading arsenal, you gain powerful insights and enhanced functionality.
The chart above displays key Previous and open levels on EURUSD , including the Month, Week, and Day lines, along with separators for enhanced clarity. All levels are based on the True Day Range Mode. The notes indicate significant price points, highlighting how the price interacts with these important levels, which helps us to understand it…
We can start with the biggest liquidity, the Previous Month. In this example, we can see the PMH, and the price seems to have used this level as a reversal point. The PM levels are indeed significant liquidity zones. We can observe the creation of wicks that interact with this level, signaling a liquidity grab.
Following this, the price drops quickly before rebounding, creating a liquidity range, that will probably be liquidated then… This is why it rises again to form what is now the PDH (Previous Day High), using it as liquidity (inducement) while using the PWH (Previous Week High) as a rebound level. The PWH is indeed a High Resistance (HR) area since there is only a few liquidity at this point thanks to the liquidity grab. The price has no reason to move higher.
Looking ahead, we can forecast that the price may continue its decline, potentially targeting lower liquidity levels. There is likely additional liquidity beneath the current range, particularly near the PDL (Previous Day Low) and PWL (Previous Week Low).
Additionally, we can note that at this point, the price was above the D.O.P (Daily Open) and W.O.P (Weekly Open), areas where selling would be more favorable. The price reacts significantly around these levels, creating large wicks, demonstrating their importance.
SMT Dashboard (Smart Money Tool)
The Smart Money Tool (SMT) is a powerful concept within the ICT methodology that enables you to compare various assets based on liquidity uptake from significant price levels.
By utilizing the SMT, you can analyze any asset , whether it’s a currency pair, stock, cryptocurrency, or other financial instruments. The dashboard helps you identify the strongest and weakest assets by analyzing their interactions with critical liquidity levels and identifying divergences , including those related to the Previous Month, Previous Week, Previous Day, and Asian Session Highs and Lows. By doing so, he identifies the most bullish symbol. It will therefore tend to rise more easily, or at least fall less, than the other one.
The SMT includes alert functionality that notifies you whenever a new SMT is created or has changed , allowing you to stay informed about which asset is currently the strongest. This means you can react promptly to market changes without constantly monitoring your charts.
Additionally, since the SMT relies on the Previous levels, it is influenced by the selected mode, whether based on traditional Previous levels or the True Day Range . This flexibility ensures that you are using the most relevant information available for your trading decisions. Asian High and Asian Low levels are also calculated according to the schedules configured in the Kill Zones section.
In summary, the Smart Money Tool displays the strongest and weakest assets based on liquidity uptake, providing you with clear information on which asset to prioritize, so you can maximize your potential profits. By incorporating this concept into your approach, you align your decisions with prevailing market dynamics, offering you unparalleled insights and features tailored to enhance your trading strategy.
This chart displays the Smart Money Tool (SMT) dashboard on the GBPUSD symbol, which compares the liquidity uptake for EURUSD and GBPUSD pairs. The indicator shows that both Previous Month's and Week's High and Low were taken for both pairs. However, the Asian High (AH) has been breached on GBPUSD but not on EURUSD, while the Asian Low (AL) has been taken by EURUSD. As a result, GBPUSD is identified as the stronger asset, indicating that traders should focus on buying opportunities with GBPUSD rather than EURUSD. This analysis helps traders prioritize the best symbol for their strategies based on the most relevant liquidity divergences.
✨ SETTINGS
Kill Zones: Customize the display options for the Asian (with lines), London, New York, and London Close Kill Zones. Configure timezone options, midlines, and color preferences.
Previous & Open Levels: Adjust how Previous High/Low levels, Open and separators are displayed. Select between Classic or True Day Range Mode based on your trading preferences.
SMT: Choose the correlated assets for the SMT comparison and select which liquidity (Monthly, Weekly, Daily, Asian) to use and display. Configure settings like liquidity sweeps and strongest pair emojis.
Alerts: Configure alerts for key events such as the Asian High/Low or Previous Levels liquidity sweep, and SMT divergences.
🎯 CONCLUSION
The Time and Price Zones indicator offers a practical and insightful approach to market analysis by combining major principles of ICT and Smart Money Concepts into a cohesive tool. It empowers traders to understand key price levels, liquidity dynamics, and institutional activity with ease. By helping traders avoid being the liquidity of the market and instead align with institutional flows, the indicator can significantly enhance performances. While its features provide a valuable edge, it’s essential to remember that none should be used on its own and many more factors go into being a profitable trader.

Bitcoin Events HistoryWith this tool, you can travel back to Bitcoin’s very first price quote and retrace its entire history directly on your chart. Major events are plotted as labels or markers, providing context for how significant moments shaped Bitcoin’s journey.
Key Features
Comprehensive Event Coverage: From Bitcoin’s inception to the most recent updates.
Custom View: Change label colors, styles, sizes, and fonts using the script’s settings.
Regular Updates: New events are added regularly to keep the history current.
Replay History
Use Bar Replay Mode to step through Bitcoin’s price history and see events unfold in sequence.
Follow the on-screen instructions for a more immersive experience.
Community Contributions
If you notice a significant event missing or misplaced on a particular date, feel free to leave a comment! Your suggestions will be considered for the next update.
To all Bitcoin enthusiasts, traders, and anyone eager to explore the history of cryptocurrency from its inception, I hope you enjoy this indicator :)

ETF-Benchmark AnalyzerHave you ever wondered which ETF performs the best? Which one is the most volatile, or which one has the smallest drawdown?
This Pine Script™ "ETF-Benchmark Analyzer" compares the performance of an ETF (such as SPY, the S&P 500 ETF) against a benchmark, which can also be adjusted by the user. It provides several key financial metrics, such as:
Performance (%): Displays the total return over a specified lookback period (e.g., 1 year). It compares the performance of the ETF against the benchmark and shows the difference.
Alpha (%): Measures the excess return of the ETF over the expected return, which is calculated using the benchmark’s return. Positive alpha indicates that the ETF has outperformed the benchmark, while negative alpha suggests underperformance. This metric is important because it isolates performance that cannot be explained by exposure to the benchmark's movements.
Sharpe Ratio: A risk-adjusted measure of return. It is calculated by dividing the excess return of the ETF (above the risk-free rate) by its standard deviation (volatility). A higher Sharpe ratio indicates better risk-adjusted returns. The Sharpe ratio is calculated for both the ETF and the benchmark, and their difference is displayed as well.
Drawdown: The percentage decrease from the highest price to the lowest price over the lookback period. This is a critical measure of risk, as it shows the largest potential loss an investor might face during a specific period.
Beta: Measures the ETF’s sensitivity to movements in the benchmark. A beta of 1 means the ETF moves in line with the benchmark; greater than 1 means it is more volatile, while less than 1 means it is less volatile.
These metrics provide a holistic view of the ETF’s performance compared to the benchmark, allowing traders to assess the risk and return profile more effectively.
Scientific Sources
Sharpe Ratio: Sharpe, W. F. (1994). The Sharpe Ratio. Journal of Portfolio Management, 21(1), 49-58. This paper defines and develops the Sharpe ratio as a measure of risk-adjusted return.
Alpha and Beta: Jensen, M. C. (1968). The Performance of Mutual Funds in the Period 1945–1964. The Journal of Finance, 23(2), 389-416. This paper discusses the concepts of alpha and beta in the context of mutual fund performance.

SMT Divergence ICT 01 [TradingFinder] Smart Money Technique🔵 Introduction
SMT Divergence (short for Smart Money Technique Divergence) is a trading technique in the ICT Concepts methodology that focuses on identifying divergences between two positively correlated assets in financial markets.
These divergences occur when two assets that should move in the same direction move in opposite directions. Identifying these divergences can help traders spot potential reversal points and trend changes.
Bullish and Bearish divergences are clearly visible when an asset forms a new high or low, and the correlated asset fails to do so. This technique is applicable in markets like Forex, stocks, and cryptocurrencies, and can be used as a valid signal for deciding when to enter or exit trades.
Bullish SMT Divergence : This type of divergence occurs when one asset forms a higher low while the correlated asset forms a lower low. This divergence is typically a sign of weakness in the downtrend and can act as a signal for a trend reversal to the upside.
Bearish SMT Divergence : This type of divergence occurs when one asset forms a higher high while the correlated asset forms a lower high. This divergence usually indicates weakness in the uptrend and can act as a signal for a trend reversal to the downside.
🔵 How to Use
SMT Divergence is an analytical technique that identifies divergences between two correlated assets in financial markets.
This technique is used when two assets that should move in the same direction move in opposite directions.
Identifying these divergences can help you pinpoint reversal points and trend changes in the market.
🟣 Bullish SMT Divergence
This divergence occurs when one asset forms a higher low while the correlated asset forms a lower low. This divergence indicates weakness in the downtrend and can signal a potential price reversal to the upside.
In this case, when the correlated asset is forming a lower low, and the main asset is moving lower but the correlated asset fails to continue the downward trend, there is a high probability of a trend reversal to the upside.
🟣 Bearish SMT Divergence
Bearish divergence occurs when one asset forms a higher high while the correlated asset forms a lower high. This type of divergence indicates weakness in the uptrend and can signal a potential trend reversal to the downside.
When the correlated asset fails to make a new high, this divergence may be a sign of a trend reversal to the downside.
🟣 Confirming Signals with Correlation
To improve the accuracy of the signals, use assets with strong correlation. Forex pairs like OANDA:EURUSD and OANDA:GBPUSD , or cryptocurrencies like COINBASE:BTCUSD and COINBASE:ETHUSD , or commodities such as gold ( FX:XAUUSD ) and silver ( FX:XAGUSD ) typically have significant correlation. Identifying divergences between these assets can provide a strong signal for a trend change.
🔵 Settings
Second Symbol : This setting allows you to select another asset for comparison with the primary asset. By default, "XAUUSD" (Gold) is set as the second symbol, but you can change it to any currency pair, stock, or cryptocurrency. For example, you can choose currency pairs like EUR/USD or GBP/USD to identify divergences between these two assets.
Divergence Fractal Periods : This parameter defines the number of past candles to consider when identifying divergences. The default value is 2, but you can change it to suit your preferences. This setting allows you to detect divergences more accurately by selecting a greater number of candles.
Bullish Divergence Line : Displays a line showing bullish divergence from the lows.
Bearish Divergence Line : Displays a line showing bearish divergence from the highs.
Bullish Divergence Label : Displays the "+SMT" label for bullish divergences.
Bearish Divergence Label : Displays the "-SMT" label for bearish divergences.
🔵 Conclusion
SMT Divergence is an effective tool for identifying trend changes and reversal points in financial markets based on identifying divergences between two correlated assets. This technique helps traders receive more accurate signals for market entry and exit by analyzing bullish and bearish divergences.
Identifying these divergences can provide opportunities to capitalize on trend changes in Forex, stocks, and cryptocurrency markets. Using SMT Divergence along with risk management and confirming signals with other technical analysis tools can improve the accuracy of trading decisions and reduce risks from sudden market changes.
