Altcoin Breadth | QuantumResearch🌐 Altcoin Breadth | QuantumResearch
Monitor the Macro Strength of 40 Altcoins in Real-Time
📊 What It Does
Altcoin Breadth is a market health dashboard that quantifies how many altcoins are trending above key moving averages — either the 50-day or 200-day.
Instead of tracking individual coins manually, this tool computes the percentage of 40 top altcoins trading above their own MAs — a clear indicator of whether the altcoin sector is in a bullish, neutral, or bearish phase.
🔍 How It Works
For each of the 40 tracked altcoins, the indicator evaluates:
✅ Whether Close > 50-day SMA → short-term strength
✅ Whether Close > 200-day SMA → long-term strength
Then it computes:
Breadth 50 → % of coins above their 50-day SMA
Breadth 200 → % of coins above their 200-day SMA
Both values are normalized between 0 and 1 and visualized with color-coded histograms and optional labels for quick interpretation.
⚙️ Features
🧠 Tracks 40 major altcoins simultaneously
📈 Toggle visibility for 50-day or 200-day breadth
🎨 Dynamic gradient coloring (green = strength, red = weakness)
🔁 Adjustable source timeframe (Daily, 4H, etc.)
✍️ Label annotations at last bar for clear readings
🖌️ 8 custom color palettes for visual personalization
💡 Why It’s Unique
This script extends market-wide insight across the altcoin complex.
Real-time, aggregate sentiment.
Instead of watching one chart at a time, you get a global signal of whether altcoins are gaining or losing momentum.
Choose between trend durations.
Use 50-day for tactical moves and 200-day for macro positioning.
📊 How to Use It
✅ Use Breadth 50 for detecting short-term bullish runs across alts
✅ Use Breadth 200 for identifying macro bull/bear cycles
✅ Watch for divergence between price and breadth
📉 If price rises but breadth drops → fewer alts are leading
📈 If price falls but breadth rises → alts may be accumulating
🔔 Ideal For
Swing traders
Macro crypto analysts
Altcoin fund managers
Cross-asset rotation strategies
Building confluence in entry/exit setups
🛠 Compatible With
QuantumResearch’s DipSpectrum, Trend Filters, and Allocation Models
BTC trend overlays or global sentiment tools
Any altcoin strategy needing macro context
⚠️ Disclaimer
This is an informational and research tool. It is not financial advice. Always perform your own due diligence before making trading or investment decisions.
Educational

Rogue LRR Strategy"They don't chase price. They chase liquidity. So should you."
This indicator detects liquidity sweeps and reversal zones engineered by Smart Money — the kind that trap retail traders at the extremes. Built for swing traders operating on daily and 4H charts, it combines:
Stop-loss raid detection (above swing highs or below swing lows)
Reversal confirmation via engulfing and wick-based candles
Dynamic ATR-based SL and 2R TP projections
Volume confirmation to filter out fake moves
Designed specifically for Indian equities (Nifty 50, F&O stocks), but works across global markets.
Whether you're trading stocks, futures, or high-beta setups — Rogue LRR gives you the edge to enter after the trap, not inside it.
Only for traders who prefer precision over prediction, and discipline over emotion.

ADVTMI - Strict RSI Divergence on S/RKey Features:
Support & Resistance Detection
Dynamically plots pivot-based support (blue) and resistance (red) levels using left/right bar lookback.
RSI Divergence Filtering
Implements strict RSI divergence rules:
Bullish Divergence only considered after a support level has been swept and RSI confirms a higher low.
Bearish Divergence only valid after a resistance sweep and RSI shows a lower high.
Sweep Confirmation Logic
Ensures a price sweep (break) of S/R levels before looking for divergence.
This helps filter out weak or false signals.
Clean Signal Plotting
BUY signals plotted below bars with green labels.
SELL signals plotted above bars with red labels.
These signals only trigger after a valid sweep + divergence, and reset logic prevents overlapping signals.

HMG MA ZonesIt provides zones of possible peaks and troughs. It is an indicator that might show up at a possible top or bottom. It could be used as an overbought or oversold signal. Does Not necessarily mean that the price is topping or bottoming. It could be used to identify a point of time from where the existing momentum might not be sustainable as much.

Advanced DCAAdvanced DCA
(Pine v5 – strategia & indicatore per TradingView)
⸻
➤ Che cos’è
Questo script implementa il Dollar-Cost Averaging “avanzato” illustrato nel video di riferimento e lo confronta - in tempo reale - con un DCA puro (versamento costante investito subito, senza logica di market-timing).
Oltre a inviare gli ordini di back-test, disegna un cruscotto in alto a destra che riassume capitale, depositi, valore attuale delle due strategie e rendimento complessivo/medio.
⸻
➤ Come funziona (logica passo-passo)
Fase Descrizione Parametri coinvolti
1. Versamento mensile Ogni nuova candela mensile → si parte dal valore di Deposito mensile base (1 000 $ pre-definito). Deposito mensile base
2. Riduzioni in fase “caro” Se il prezzo sta +10 % sopra la MA a 12 mesi versi solo il 75 %. Se sale oltre +20 % versi il 50 %. Media mobile (mesi) • % sopra MA → 75 % • % sopra MA → 50 % • Contrib. % > soglia1/2
3. Buffer La parte non investita confluisce in un cash-buffer. –
4. Boost in fase “scontato” Quando il prezzo scende -10 % sotto la MA, il buffer viene frazionato sui successivi 6 mesi e aggiunto ai versamenti (100 %). % sotto MA per boost • Mesi di redistribuzione
5. Acquisto Lo script compra quote intere appena il contante raggiunge il costo di 1 quota (puoi passare alle frazioni sostituendo math.floor() con deposit/close). –
6. Benchmark DCA puro In parallelo calcola quante quote avresti con un versamento fisso di 1 000 $ investito interamente ogni mese (quote frazionarie). –
7. Dashboard Mostra capitali, cash, valore di mercato, confronto fra DCA puro/avanzato e rendimento totale / medio mensile. –
⸻
➤ Significato dei campi nel cruscotto
Etichetta Cosa mostra
Start capital Capitale iniziale (tab Properties).
Deposito mensile Valore del tuo versamento base.
Investito (costo) Somma di capitale iniziale + tutti i depositi ufficiali.
Non investito (cash) Buffer + pendenza ancora da investire.
Valore mercato Valore a prezzo corrente delle quote eventualmente ancora in portafoglio.
Depositi totali Contatore dei versamenti (non ridotti).
DCA puro (valore) Quanto varrebbe oggi il DCA classico.
DCA avanzato (valore) Equity totale della strategia avanzata (quote + cash).
Rend. tot | medio % complessiva sul capitale versato e % media geometrica mensile.
⸻
➤ Personalizzare per i propri test
Vuoi… Imposta così
Simulare il DCA puro thr1/thr2 = 999 e perc1/perc2 = 100.
Media più “lunga” (come nel video: 50-year) Media mobile (mesi) = 600.
Boost più aggressivo Mesi di redistribuzione = 1 e % sotto MA = –5.
Riduzioni più frequenti Abbassa thr1/thr2 (es. 5 / 10 %).
Evitare contante fermo Sostituisci la riga d’acquisto con qty = (depositAdv + extra) / close (quote frazionarie).
⸻
➤ Avvertenze
• È uno strumento di studio: non genera ordini live.
• Le performance storiche non garantiscono risultati futuri.
• Prova più timeframe, ETF o crypto per vedere dove il DCA avanzato porta reale vantaggio rispetto al DCA puro.
Buon back-test!
-------------------------------
Advanced DCA – Overview
(Pine v5 strategy + indicator for TradingView)
⸻
What it does
This script reproduces the “advanced” dollar-cost averaging (DCA) shown in the reference video and compares it live with a simple DCA (the full deposit invested every month with no timing filter).
It places back-test orders and draws a compact dashboard in the top-right corner that tracks capital, deposits, current value of both approaches and total / average returns.
⸻
Workflow
Step What happens Key inputs
1 Monthly deposit On every new monthly candle the script starts with Base monthly deposit (default $1 000). Base deposit
2 Trim when “expensive” If price is +10 % above the chosen MA, only 75 % is invested.If +20 %, only 50 % is invested. MA length, % above MA → 75 % / 50 %, Contribution %
3 Buffer The skipped money is parked in a cash buffer. —
4 Boost when “cheap” If price drops –10 % below the MA, the buffer is split over the next 6 months and added to the deposits. % below MA, Redistribution months
5 Buy The script buys whole shares as soon as cash ≥ 1 share price (switch to fractional by replacing math.floor() with deposit/close). —
6 Simple-DCA benchmark In parallel it tracks what you’d have by investing the full deposit every month (fractional shares). —
7 Dashboard Displays capital, cash, market value, simple vs advanced DCA and total / average monthly return. —
⸻
Dashboard fields
Label Meaning
Start capital Initial account size (Properties tab).
Monthly deposit Your base contribution.
Invested (cost) Initial capital + all official deposits.
Un-invested (cash) Buffer + pending cash.
Market value Current value of any open shares.
Total deposits Count of all monthly deposits.
Simple DCA (value) Value today of classic DCA.
Advanced DCA (value) Total equity of the advanced method (shares + cash).
**Return total avg**
⸻
Quick tuning
Goal Change this
Simulate pure DCA thr1/thr2 = 999, perc1/perc2 = 100.
50-year MA like the video MA length = 600 months.
Stronger boost Redistribution months = 1, % below MA = –5.
More frequent trims Lower thr1/thr2 (e.g. 5 % / 10 %).
No idle cash Buy fractional shares: qty = (deposit + extra) / close.
⸻
Notes
• This is a research tool—no live orders are sent.
• Past results ≠ future returns.
• Test different assets / timeframes to see when advanced DCA really beats simple DCA.
Happy back-testing!

Period Separators With Dates & PricesPeriod separator with dates and relative high-low prices.
Great tool to identify market structure.

Daily Profiler NFPDaily Profiler NFP
Overview
The Daily Profiler NFP is a comprehensive trading tool designed to track, visualize, and analyze price action during Non-Farm Payroll (NFP) release days. By capturing and displaying high, low, and mid-range levels from these significant market events, traders gain valuable support and resistance reference points that often influence future price movements.
Key Features
Monthly NFP Tracking: Captures and displays the high, low, and mid-range levels for each month's NFP release day
Customizable NFP Dates: Easily set the correct NFP release date for each month of the year
Dynamic Support & Resistance: Identifies the closest NFP levels above and below current price with color-coded boxes
Multi-Timeframe Compatibility: Works seamlessly across intraday, daily, and weekly charts
Comprehensive Visualization Options:
High, low, and mid-range horizontal lines
Price labels with customizable display options
Support and resistance boxes with adjustable opacity and size
NFP range extension boxes showing potential influence zones
Trading Applications
Identify key support and resistance levels based on NFP day price action
Anticipate potential reversal or continuation zones when price approaches historical NFP levels
Develop trading strategies around recurring patterns at NFP price levels
Use as confluence with other technical analysis methods for higher probability trades
Customization
Extensive customization options allow you to:
Adjust color schemes and line styles
Modify box heights and extensions
Show or hide specific elements (high/low lines, midpoint lines, labels, prices)
Set hour offset to match exact NFP release timing
Customize label styles and positions
Perfect for futures, forex, and equity index traders who recognize the significance of NFP releases on market dynamics. The Daily Profiler NFP provides a structured framework for incorporating these major economic events into your technical analysis.

Range Breakout Statistics [Honestcowboy]
⯁ Overview
The Range Breakout Statistics uses a very simple system to detect ranges/consolidating markets. The principle is simple, it looks for areas where the slope of a moving average is flat compared to past values. If the moving average is flat for X amount of bars that's a range and it will draw a box.
The statistics part of the script is a bit more complicated. The aim of this script is to expand analysis of trading signals in a different way than a regular backtest. It also highlights the polyline tool, one of my favorite drawing tools on the tradingview platform.
⯁ Statistics Methods
The script has 2 different modes of analyzing a trading signals strength/robustness. It will do that for 2 signals native to the script.
Upper breakout: first price breakout at top of box, before max bars (100 bars by default)
Lower breakout: first price breakout at bottom of box, before max bars
The analysis methods themselves are straightforward and it should be possible for tradingview community to expand this type of analysis to other trading signals. This script is a demo for this analysis, yet some might still find the native signals helpful in their trading, that's why the script includes alerts for the 2 native signals. I've also added a setting to disable any data gathering, which makes script run faster if you want to automate it.
For both of the analysis methods it uses the same data, just with different calculations and drawing methods. The data set is all past price action reactions to the signals saved in a matrix. Below a chart for explaining this visually.
⯁ Method 1: Averages Projection
The idea behind this is that just showing all price action that happened after signal does not give actionable insights. It's more a spaghetti jumble mess of price action lines. So instead the script averages the data out using 3 different approaches, all selectable in the settings menu.
Geometric Average: useful as it accurately reflects compound returns over time, smoothing out the impact of large gains or losses. Accounts for volatility drift.
Arithmetic Average: a standard average calculation, can be misleading in trading due to volatility drift. It is the most basic form of averaging so I included it.
Median: useful as any big volatility huge moves after a signal does not really impact the mean as it's just the middle value of all values.
These averages are the 2 lines you will find in the middle of the projection. Having a clear difference between a lower break average and upper break average price reaction can signal significance of the trading signal instead of pure chaos.
Outside of this I also included calculations for the maximum and minimum values in the dataset. This is useful for seeing price reactions range to the signal, showing extreme losses or wins are possible. For this range I also included 2 matrices of highs and lows data. This makes it possible to draw a band between the range based on closing price and the one using high/low data.
Below is a visualisation of how the averages data is shown on chart.
⯁ Method 2: Equity Simulation
This method will feel closer to home for traders as it more closely resembles a backtest. It does not include any commissions however and also is just a visualisation of price reaction to a signal. This method will simulate what would happen if you would buy at the breakout point and hold the trade for X amount of bars. With 0 being sell at same bar close. To test robustness I've given the option to visualise Equity simulation not just for 1 simulation but a bunch of simulations.
On default settings it will draw the simulations for 0 bars holding all the way to 10 bars holding. The idea behind it is to check how stable the effect is, to have further confirmation of the significance of the signal. If price simulation line moves up on average for 0 bars all the way to 10 bars holding time that means the signal is steady.
Below is a visualisation of the Equity Simulation.
⯁ Signal filtering
For the boxes themselves where breakouts come from I've included a simple filter based on the size of the box in ATR or %. This will filter out all the boxes that are larger top to bottom than the ATR or % value you setup.
⯁ Coloring of Script
The script includes 5 color themes, each carefully created using color themes from the pantone color institute. There are no color settings or other visual settings in the script, the script themes are simple and always have colors that work well together. Equity simulation uses a gradient based on lightness to color the different lines so it's easier to differentiate them while still upper breaks having a different color than lower breaks.
This script is not created to be used in conjunction with other scripts, it will force you into a background color that matches the theme. It's purpose is a research tool for systematic trading, to analyse signals in more depth.
Metaverse color theme:
⯁ Conclusion
I hope this script will help traders get a deeper understanding of how different assets react to their assets. It should be possible to convert this script into other signals if you know how to code on the platform. It is my intention to make more publications that include this type of analysis. It is especially useful when dealing with signals that do not happen often enough, so a regular backtest is not enough to test their significance.

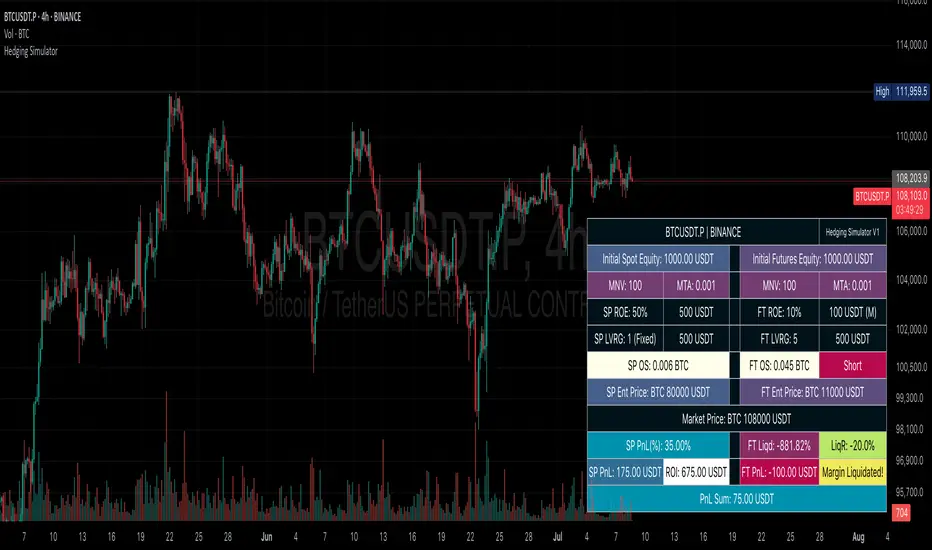
Hedging SimulatorHedging Simulator
The Hedging Simulator is a straightforward hedging tool designed to simulate potential profit and loss outcomes from combined Spot and Futures positions in the cryptocurrency market.
Users can define their equity allocation separately for both spot and futures, allowing for flexible and realistic scenario modelling.
The tool also incorporates MNV (Minimum Notional Value) and MTA (Minimum Trade Amount) parameters to estimate order sizes based on symbol-specific trading rules set by exchanges. While the results may differ slightly from actual exchange calculations, the simulator aims to provide a close approximation for general understanding.
📌Note: Crypto-Only - This tool is designed specifically for cryptocurrency trading and is not intended for use with traditional financial instruments.
Entry Price: Users can input custom entry prices for both spot and futures trades to simulate from specific market positions.
Live Price: The entry price fields for both spot and futures support Live Price based on the currently viewed symbol on your chart.
📌Note: In the real market, spot and futures prices are not always identical—there can be a price gap between them. While the difference is typically small, it's important to understand that the live price shown is only for rough estimation purposes and may not reflect the exact trading price on your chosen exchange.
Expecting Market Price: This represents the projected or target price to simulate potential profit and loss across the hedged position based on market movement.
📌Note: Profit and loss calculations exclude all trading fees. Actual results in live markets may vary due to fees, slippage, and exchange rules.
Feedback: If you notice any bugs, errors on calculation, or have suggestions for better calculations or new features, feel free to share your thoughts. Your feedback helps improve the tool and will be considered for future updates.
⚠️ Disclaimer: This simulator is intended for educational and illustrative purposes only. It does not constitute financial advice or guarantee trading results. Market conditions may vary, and all trading carries inherent risks. Users are solely responsible for any decisions made based on this tool and bear full responsibility for their own trading outcomes.
Position Size Calculator with Fees# Position Size Calculator with Portfolio Management - Manual
## Overview
The Position Size Calculator with Portfolio Management is an advanced Pine Script indicator designed to help traders calculate optimal position sizes based on their total portfolio value and risk management strategy. This tool automatically calculates your risk amount based on portfolio allocation percentages and determines the exact position size needed while accounting for trading fees.
## Key Features
- **Portfolio-Based Risk Management**: Calculates risk based on total portfolio value
- **Tiered Risk Allocation**: Separates trading allocation from total portfolio
- **Automatic Trade Direction Detection**: Determines long/short based on entry vs stop loss
- **Fee Integration**: Accounts for trading fees in position size calculations
- **Risk Factor Adjustment**: Allows scaling of position size up or down
- **Visual Display**: Shows all calculations in a clear, color-coded table
- **Automatic Risk Calculation**: No need to manually input risk amount
## Input Parameters
### Total Portfolio ($)
- **Purpose**: The total value of your investment portfolio
- **Default**: 0.0
- **Range**: Any positive value
- **Step**: 0.01
- **Example**: If your total portfolio is worth $100,000, enter 100000
### Trading Portfolio Allocation (%)
- **Purpose**: The percentage of your total portfolio allocated to active trading
- **Default**: 20.0%
- **Range**: 0.0% to 100.0%
- **Step**: 0.01
- **Example**: If you allocate 20% of your portfolio to trading, enter 20
### Risk from Trading (%)
- **Purpose**: The percentage of your trading allocation you're willing to risk per trade
- **Default**: 0.1%
- **Range**: Any positive value
- **Step**: 0.01
- **Example**: If you risk 0.1% of your trading allocation per trade, enter 0.1
### Entry Price ($)
- **Purpose**: The price at which you plan to enter the trade
- **Default**: 0.0
- **Range**: Any positive value
- **Step**: 0.01
### Stop Loss ($)
- **Purpose**: The price at which you will exit if the trade goes against you
- **Default**: 0.0
- **Range**: Any positive value
- **Step**: 0.01
### Risk Factor
- **Purpose**: A multiplier to scale your position size up or down
- **Default**: 1.0 (no scaling)
- **Range**: 0.0 to 10.0
- **Step**: 0.1
- **Examples**:
- 1.0 = Normal position size
- 2.0 = Double the position size
- 0.5 = Half the position size
### Fee (%)
- **Purpose**: The percentage fee charged per transaction
- **Default**: 0.01% (0.01)
- **Range**: 0.0% to 1.0%
- **Step**: 0.001
## How Risk Amount is Calculated
The script automatically calculates your risk amount using this formula:
```
Risk Amount = Total Portfolio × Trading Allocation (%) × Risk % ÷ 10,000
```
### Example Calculation:
- Total Portfolio: $100,000
- Trading Allocation: 20%
- Risk per Trade: 0.1%
**Risk Amount = $100,000 × 20 × 0.1 ÷ 10,000 = $20**
This means you would risk $20 per trade, which is 0.1% of your $20,000 trading allocation.
## Portfolio Structure Example
Let's say you have a $100,000 portfolio:
### Allocation Structure:
- **Total Portfolio**: $100,000
- **Trading Allocation (20%)**: $20,000
- **Long-term Investments (80%)**: $80,000
### Risk Management:
- **Risk per Trade (0.1% of trading)**: $20
- **Maximum trades at risk**: Could theoretically have 1,000 trades before risking entire trading allocation
## How Position Size is Calculated
### Trade Direction Detection
- **Long Trade**: Entry price > Stop loss price
- **Short Trade**: Entry price < Stop loss price
### Position Size Formulas
#### For Long Trades:
```
Position Size = -Risk Factor × Risk Amount / (Stop Loss × (1 - Fee) - Entry Price × (1 + Fee))
```
#### For Short Trades:
```
Position Size = -Risk Factor × Risk Amount / (Entry Price × (1 - Fee) - Stop Loss × (1 + Fee))
```
## Output Display
The indicator displays a comprehensive table with color-coded sections:
### Portfolio Information (Light Blue Background)
- **Portfolio (USD)**: Your total portfolio value
- **Trading Portfolio Allocation (%)**: Percentage allocated to trading
- **Risk as % of Trading**: Risk percentage per trade
### Trade Setup (Gray Background)
- **Entry Price**: Your specified entry price
- **Stop Loss**: Your specified stop loss price
- **Fee (%)**: Trading fee percentage
- **Risk Factor**: Position size multiplier
### Risk Analysis (Red Background)
- **Risk Amount**: Automatically calculated dollar risk
- **Effective Entry**: Actual entry cost including fees
- **Effective Exit**: Actual exit value including fees
- **Expected Loss**: Calculated loss if stop loss is hit
- **Deviation from Risk %**: Accuracy of risk calculation
### Final Result (Blue Background)
- **Position Size**: Number of shares/units to trade
## Usage Examples
### Example 1: Conservative Long Trade
- **Total Portfolio**: $50,000
- **Trading Allocation**: 15%
- **Risk per Trade**: 0.05%
- **Entry Price**: $25.00
- **Stop Loss**: $24.00
- **Risk Factor**: 1.0
- **Fee**: 0.01%
**Calculated Risk Amount**: $50,000 × 15% × 0.05% ÷ 100 = $3.75
### Example 2: Aggressive Short Trade
- **Total Portfolio**: $200,000
- **Trading Allocation**: 30%
- **Risk per Trade**: 0.2%
- **Entry Price**: $150.00
- **Stop Loss**: $155.00
- **Risk Factor**: 2.0
- **Fee**: 0.01%
**Calculated Risk Amount**: $200,000 × 30% × 0.2% ÷ 100 = $120
**Actual Risk**: $120 × 2.0 = $240 (due to risk factor)
## Color Coding System
- **Green/Red Header**: Trade direction (Long/Short)
- **Light Blue**: Portfolio management parameters
- **Gray**: Trade setup parameters
- **Red**: Risk-related calculations and results
- **Blue**: Final position size result
## Best Practices
### Portfolio Management
1. **Keep trading allocation reasonable** (typically 10-30% of total portfolio)
2. **Use conservative risk percentages** (0.05-0.2% per trade)
3. **Don't risk more than you can afford to lose**
### Risk Management
1. **Start with small risk factors** (1.0 or less) until comfortable
2. **Monitor your total exposure** across all open positions
3. **Adjust risk based on market conditions**
### Trade Execution
1. **Always validate calculations** before placing trades
2. **Account for slippage** in volatile markets
3. **Consider position size relative to liquidity**
## Risk Management Guidelines
### Conservative Approach
- Trading Allocation: 10-20%
- Risk per Trade: 0.05-0.1%
- Risk Factor: 0.5-1.0
### Moderate Approach
- Trading Allocation: 20-30%
- Risk per Trade: 0.1-0.15%
- Risk Factor: 1.0-1.5
### Aggressive Approach
- Trading Allocation: 30-40%
- Risk per Trade: 0.15-0.25%
- Risk Factor: 1.5-2.0
## Troubleshooting
### Common Issues
1. **Position Size shows 0**
- Verify all portfolio inputs are greater than 0
- Check that entry price differs from stop loss
- Ensure calculated risk amount is positive
2. **Very small position sizes**
- Increase risk percentage or risk factor
- Check if your risk amount is too small for the price difference
3. **Large risk deviation**
- Normal for very small positions
- Consider adjusting entry/stop loss levels
### Validation Checklist
- Total portfolio value is realistic
- Trading allocation percentage makes sense
- Risk percentage is conservative
- Entry and stop loss prices are valid
- Trade direction matches your intention
## Advanced Features
### Risk Factor Usage
- **Scaling up**: Use risk factors > 1.0 for high-confidence trades
- **Scaling down**: Use risk factors < 1.0 for uncertain trades
- **Never exceed**: Risk factors that would risk more than your comfort level
### Multiple Timeframe Analysis
- Use different risk factors for different timeframes
- Consider correlation between positions
- Adjust trading allocation based on market conditions
## Disclaimer
This tool is for educational and planning purposes only. Always verify calculations manually and consider market conditions, liquidity, and correlation between positions. The automated risk calculation assumes you're comfortable with the mathematical relationship between portfolio allocation and individual trade risk. Past performance doesn't guarantee future results, and all trading involves risk of loss.

Easy Position Size Calculator with Fees# Easy Position Size Calculator with Fees - Manual
## Overview
The Easy Position Size Calculator is a Pine Script indicator designed to help traders calculate the optimal position size for their trades while accounting for trading fees. This tool automatically determines whether you're planning a long or short position and calculates the exact position size needed to risk a specific dollar amount.
## Key Features
- **Automatic Trade Direction Detection**: Determines if you're going long or short based on entry price vs stop loss
- **Fee Integration**: Accounts for trading fees in position size calculations
- **Risk Management**: Calculates position size based on your specified risk amount
- **Risk Factor Adjustment**: Allows you to scale your position size up or down
- **Visual Display**: Shows all calculations in a clear, organized table
## Input Parameters
### Entry Price ($)
- **Purpose**: The price at which you plan to enter the trade
- **Default**: 0.0
- **Range**: Any positive value
- **Step**: 0.01
### Stop Loss ($)
- **Purpose**: The price at which you will exit the trade if it goes against you
- **Default**: 0.0
- **Range**: Any positive value
- **Step**: 0.01
### Risk ($)
- **Purpose**: The maximum dollar amount you're willing to lose on this trade
- **Default**: 0.0
- **Range**: Any positive value
- **Step**: 0.01
### Risk Factor
- **Purpose**: A multiplier to scale your position size up or down
- **Default**: 1.0 (no scaling)
- **Range**: 0.0 to 10.0
- **Step**: 0.1
- **Examples**:
- 1.0 = Normal position size
- 2.0 = Double the position size
- 0.5 = Half the position size
### Fee (%)
- **Purpose**: The percentage fee charged per transaction (buy/sell)
- **Default**: 0.01% (0.01)
- **Range**: 0.0% to 1.0%
- **Step**: 0.001
## How It Works
### Trade Direction Detection
The script automatically determines your trade direction:
- **Long Trade**: Entry price > Stop loss price
- **Short Trade**: Entry price < Stop loss price
### Position Size Calculation
#### For Long Trades:
```
Position Size = -Risk Factor × Risk Amount / (Stop Loss × (1 - Fee) - Entry Price × (1 + Fee))
```
#### For Short Trades:
```
Position Size = -Risk Factor × Risk Amount / (Entry Price × (1 - Fee) - Stop Loss × (1 + Fee))
```
### Fee Adjustment
The script accounts for fees on both entry and exit:
- **Long trades**: You pay fees when buying (entry) and selling (exit)
- **Short trades**: You pay fees when shorting (entry) and covering (exit)
## Output Display
The indicator displays a table with the following information:
### Trade Information
- **Trade Type**: Shows whether it's a LONG, SHORT, or INVALID trade
- **Entry Price**: Your specified entry price
- **Stop Loss**: Your specified stop loss price
- **Fee (%)**: The fee percentage being used
### Risk Parameters
- **Risk Amount**: The dollar amount you're willing to risk
- **Risk Factor**: The multiplier being applied
### Calculated Values
- **Effective Entry**: The actual cost per share including fees
- **Effective Exit**: The actual exit value per share including fees
- **Expected Loss**: The calculated loss if stop loss is hit
- **Deviation from Risk %**: Shows how close the expected loss is to your target risk
- **Position Size**: The number of shares/units to trade
## Usage Examples
### Example 1: Long Trade
- Entry Price: $100.00
- Stop Loss: $95.00
- Risk Amount: $500.00
- Risk Factor: 1.0
- Fee: 0.01%
**Result**: The script will calculate how many shares to buy so that if the stop loss is hit, you lose approximately $500 (accounting for fees). Position Size: 99.61152
### Example 2: Short Trade
- Entry Price: $50.00
- Stop Loss: $55.00
- Risk Amount: $300.00
- Risk Factor: 1.0
- Fee: 0.01%
**Result**: The script will calculate how many shares to short so that if the stop loss is hit, you lose approximately $300 (accounting for fees). Position Size: 59.87426
## Important Notes
### Validation Requirements
For the script to work properly, all of the following must be true:
- Entry price > 0
- Stop loss > 0
- Risk amount > 0
- Entry price ≠ Stop loss (to determine direction)
### Negative Position Sizes
The script may show negative position sizes, which is normal:
- **Negative values for long trades**: Represents shares to buy
- **Negative values for short trades**: Represents shares to short
### Risk Deviation
The "Deviation from Risk %" shows how closely the calculated position size matches your target risk. Small deviations are normal due to:
- Fee calculations
- Rounding
- Market precision
## Color Coding
The table uses color coding for easy identification:
- **Green**: Long trade information
- **Red**: Short trade information
- **Gray**: Invalid trade (when inputs are incorrect)
- **Blue**: Final position size
- **Red background**: Risk-related calculations
## Troubleshooting
### Common Issues
1. **Position Size shows 0**
- Check that all inputs are greater than 0
- Ensure entry price is different from stop loss
2. **Trade Type shows INVALID**
- Verify that entry price and stop loss are both positive
- Make sure entry price ≠ stop loss
3. **Large Risk Deviation**
- This is normal for very small position sizes
- Consider adjusting your risk amount or price levels
## Best Practices
1. **Always validate your inputs** before placing actual trades
2. **Double-check the trade direction** shown in the table
3. **Review the expected loss** to ensure it aligns with your risk management
4. **Consider the effective entry/exit prices** which include fees
5. **Use appropriate risk factors** - avoid extreme values that could lead to overexposure
## Disclaimer
This tool is for educational and planning purposes only. Always verify calculations manually and consider market conditions, liquidity, and other factors before placing actual trades. The script assumes that fees are charged on both entry and exit transactions.

Automated Scalping Signals with TP/SL Indicator [QuantAlgo]🟢 Overview
The Automated Scalping Signals with Take Profit & Stop Loss Indicator is a multi-timeframe trading system that combines market structure analysis with directional bias filtering to identify potential scalping opportunities. It detects Points of Interest (POI) including Fair Value Gaps (FVG) and Order Blocks (OB) while cross-referencing entries with higher timeframe exponential moving average positioning to create systematic entry conditions.
The indicator features adaptive timeframe calculations that automatically scale analysis periods based on your chart timeframe, maintaining consistent analytical relationships across different trading sessions. It provides integrated trade management with stop loss calculation methods, configurable risk-reward ratios, and real-time performance tracking through dashboard displays showing trade statistics, bias direction, and active position status.
This advanced system is designed for low timeframe trading, typically performing optimally on 1 to 15-minute charts across popular instruments such as OANDA:XAUUSD , CME_MINI:MES1! , CME_MINI:ES1! , CME_MINI:MNQ1! , CBOT_MINI:YM1! , CBOT_MINI:MYM1! , BYBIT:BTCUSDT.P , BYBIT:ETHUSDT.P , or any asset and timeframe of your preference.
🟢 How It Works
The indicator operates using a dual-timeframe mathematical framework where higher timeframe exponential moving averages establish directional bias through cross-over analysis, while simultaneously scanning for specific market structure patterns on the POI timeframe. The timeframe calculation engine uses multiplication factors to determine analysis periods, ensuring the bias timeframe provides trend context while the POI timeframe captures structural formations.
The structural analysis begins with FVG detection, which systematically scans price action to identify imbalances where gaps exist between consecutive candle ranges with no overlapping wicks. When such gaps are detected, the algorithm measures their size against minimum thresholds to filter out insignificant formations. Concurrently, OB recognition analyzes three-candle sequences, examining specific open/close relationships that indicate potential institutional accumulation zones. Once these structural patterns are identified, the algorithm cross-references them against the higher timeframe bias direction, creating a validation filter that only permits entries aligned with the prevailing EMA cross-over state. When price subsequently intersects these validated POI zones, entry signals generate with the system calculating entry levels at zone midpoints, then applying the selected stop loss methodology combined with the configured risk-reward ratio to determine take profit placement.
To mirror realistic trading conditions, the indicator incorporates configurable slippage calculations that account for execution differences between intended and actual fill prices. When trades reach their take profit or stop loss levels, the algorithm applies slippage adjustments that worsen the exit prices in a conservative manner - reducing take profit fills and increasing stop loss impact. This approach ensures backtesting results reflect more realistic performance expectations by accounting for spread costs, market volatility during execution, and liquidity constraints that occur in live trading environments.
It also has a performance dashboard that continuously tracks and displays comprehensive trading metrics:
1/ Bias TF / POI TF: Displays the calculated timeframes used for bias analysis and POI detection, showing the actual periods (e.g., "15m / 5m") that result from the multiplier settings to confirm proper adaptive timeframe selection
2/ Bias Direction: Shows current market trend assessment (Bullish, Bearish, or Sideways) derived from EMA cross-over analysis to indicate which trade directions align with prevailing momentum
3/ Data Processing: Indicates how many price bars have been analyzed by the system, helping users verify if complete historical data has been processed for comprehensive strategy validation
4/ Total Trades: Displays the cumulative number of completed trades plus any active positions, providing volume assessment for statistical significance of other metrics
5/ Wins/Losses: Shows the raw count of profitable versus unprofitable trades, offering immediate insight into strategy effectiveness frequency
6/ Win Rate: Reveals the percentage of successful trades, where values above 50% generally indicate effective entry timing and values below suggest strategy refinement needs
7/ Total R-Multiple: Displays cumulative risk-reward performance across all trades, with positive values demonstrating profitable system operation and negative values indicating net losses requiring analysis
8/ Average R Win/Loss: Shows average risk-reward ratios for winning and losing trades separately, where winning averages approaching the configured take profit ratio indicate minimal slippage impact while losing averages near -1.0 suggest effective stop loss execution
9/ TP Ratio / Slippage: Displays the configured take profit ratio and slippage settings with calculated performance impact, showing how execution costs affect actual versus theoretical returns
10/ Profit Factor: Calculates the ratio of total winning amounts to total losing amounts, where values above 1.5 suggest robust profitability, values between 1.0-1.5 indicate modest success, and values below 1.0 show net losses
11/ Maximum Drawdown: Tracks the largest peak-to-trough decline in R-multiple terms, with smaller negative values indicating better capital preservation and risk control during losing streaks
🟢 How to Use
Start by applying the indicator to your chart and observe its performance across different market conditions to understand how it identifies bias direction and POI formations. Then navigate to the settings panel to configure the Bias Timeframe Multiplier for trend context sensitivity and POI Timeframe Multiplier for structural analysis frequency according to your trading preference and objectives.
Next, fine-tune the EMA periods in Bias Settings to control trend detection sensitivity and select your preferred POI types based on your analytical preference. Proceed to configure your Risk Management approach by selecting from the available stop loss calculation methods and setting the Take Profit ratio that aligns with your risk tolerance and profit objectives. Complete the setup by customizing Display Settings to control table visibility and trade visualization elements, adjusting UI positioning and colors for optimal chart readability, then activate Alert Conditions for automated notifications on trade entries, exits, and bias direction changes to support systematic trade management.
🟢 Examples
OANDA:XAUUSD
CME_MINI:MES1!
CME_MINI:ES1!
CME_MINI:MNQ1!
CBOT_MINI:YM1!
BYBIT:BTCUSDT.P
BINANCE:SOLUSD
*Disclaimer: Past performance is not indicative of future results. None of our statements, claims, or signals from our indicators are intended to be financial advice. All trading involves substantial risk of loss, not just upside potential. Users are highly recommended to carefully consider their financial situation and risk tolerance before trading.

Price Coil Expansion & Trap Detector✅ Title:
Price Coil Expansion & Trap Detector (PCE-TD)
⸻
✅ Updated Description:
The PCE-TD (Price Coil Expansion & Trap Detector) is a hybrid volatility and market structure indicator designed to identify three high-impact setups:
1. Price Coil Compression Zones
2. Breakout Buy/Sell Signals (Expansion Events)
3. False Breakout Traps (Bull/Bear Fakes)
⸻
🔍 Core Concepts & Signal Logic
✅ 1. Price Coil Detection (Compression Phase)
• Highlights tight-range zones where price volatility shrinks and candles display smaller bodies with larger wicks.
• Criteria used:
• Consecutive shrinking bodies (customizable)
• High average wick-to-body ratio
• Coil zone must be tighter than recent range average
• These zones are shaded in gray on the chart to signal potential buildup before explosive movement.
⸻
✅ 2. Breakout Expansion Signals
Triggered when price breaks out of the coil zone with strong body momentum, optional volume spike, and optional EMA filter.
🔺 Signal: Buy↑ (Green Triangle Up)
• Appears below bar
• Triggers when:
• Price breaks above coil high
• Candle body exceeds average × user-defined multiplier
• Volume spike (if enabled)
• Trend filter (optional EMA confirmation)
🔻 Signal: Sell↓ (Red Triangle Down)
• Appears above bar
• Triggers when:
• Price breaks below coil low
• Candle body exceeds threshold
• Optional volume and trend confirmation
💬 Alerts Triggered:
• PCE-TD: Coil breakout UP
• PCE-TD: Coil breakout DOWN
These will be sent via TradingView’s alert system if configured using alert conditions.
⸻
✅ 3. False Breakout Detector (Trap Finder)
Identifies fake breakouts that fail within the next X bars and re-enter the prior range.
❌ False Bullish Breakout:
• Printed as Red X (above bar)
• Also subtly highlights background red
❌ False Bearish Breakout:
• Printed as Green X (below bar)
• Background turns green
These help avoid chasing traps and improve timing accuracy after failed breakouts.
⸻
⚙️ Customization Parameters:
• Coil Window Length, Shrinking Body Count, Wick-to-Body Ratio
• Volume Spike Multiplier
• EMA Trend Filter
• Range Lookback and Trap Detection Window
• Enable/disable zones, signals, and trap markers
⸻
🧠 Designed For:
• Breakout traders
• Volatility compression pattern followers
• Traders avoiding fake breakouts
• Scalpers and swing traders alike

PitStopPersonal Pit Stop Line drawing tool. It is designed to draw horizontal line every 10 points thus i do not have t draw them manually one by one


Confluence checklistConfluences by Scalpr
Custom Confluences Checklist - Trading Setup Confirmation Tool
A clean and customizable confluence tracking indicator designed to help traders confirm high-probability setups by monitoring multiple technical factors simultaneously.
Key Features:
10 Fully Customizable Confluences - Name each confluence to match your trading strategy (Premium/Discount zones, Liquidity sweeps, Market structure, etc.)
Dynamic Dashboard - Only appears when confluences are active, keeping your chart clean
Visual Confirmation - Green checkmarks (✅) for each confirmed confluence with custom color coding
Flexible Display Options - Choose dashboard position (4 corners) and size (Small/Normal/Large)
Real-time Counter - Shows active confluence count in header
Professional Layout - Confluence names on left, checkmarks on right for easy scanning
How to Use:
Setup Phase - Enable and rename confluences in settings to match your analysis criteria
Analysis Phase - Check/uncheck confluences as market conditions align with your setup
Confirmation Phase - Use the dashboard as a visual checklist to confirm trade entries
Perfect For:
ICT traders tracking premium/discount, liquidity sweeps, and market structure
Multi-timeframe analysis confirmation
Setup validation before trade execution
Educational purposes for learning confluence-based trading

Finance Nirvana Buy/Sell Signals Generator V1.2Finance Nirvana Buy Sell Indicator combines multiple layers of analysis into a single, streamlined overlay. It plots key trend and volatility structures—EMAs and Bollinger Bands—while computing a fast, zero-lag EMA (ZLEMA20) for more responsive trend detection. Extreme RSI and volume events are flagged directly on the chart, and classic two-bar price-action (Buy / Sell) signals are only triggered when confirmed by ATR-based volatility breakouts, ADX trend strength, dynamic RSI momentum filters, and volume confirmations. A multit imeframe alignment table shows both “bullish vs. bearish” status and live RSI readings across 5m, 15m, 60m, 240m, and daily frames, and intraday pivot, support, and resistance levels are drawn for easy reference.
table added to show live level + Todays n yesterday high n low levels

itradepro 2 ema crossingvisit itradepro.academy and get more strategies and scanners and educational courses

MENOLAK RUGI TRADING PLAN "MENOLAK RUGI TRADING PLAN"
is a customizable trading plan table designed to help Smart Money Concept (SMC) traders visualize their execution checklist directly on the chart.
With this tool, you can select multiple timeframes for analysis, define your POI (Point of Interest) entry types, entry system preferences, stop-loss parameters, target exit strategies, break-even setup conditions, and risk per trade — all displayed in a clean, organized table.
🔧 Features:
Multi-timeframe selection (D1 to M1)
Multi-select POI Entry, Entry System, and Target Exit
Customizable SL levels (10–100 pips)
BEP setup from 1R to 5R
Risk/Trade options from 0.1% to 1%
Full control over table color, font size, and position
Perfect for discretionary and rule-based traders who want to remain consistent, accountable, and structured in their trading approach.

200 EMA, 50 EMA, 21 EMAEMA Indicator 3 in 1 (21,50,200) Why download three individual indicator in you can have all in one.

itradepro 2 ema crossingvisit www.itradepro.academy and get more strategies and scanners and educational courses

Full HTF Levels (Extended) Full HTF Levels (Monthly, Weekly, Daily) – Customizable & Always Visible
Description:
This indicator automatically draws previous high, low, and close levels from:
📅 Previous Month (MH, ML, MC) + Current Month Open (CMO)
📆 Previous Week (H, L, 1V)
📈 Previous Day (PDH, PDL, PDC)
💡 Features:
Each line has a unique label, style, and color
Toggle each level on/off via settings
Fully extended horizontal lines — visible across the entire chart (even when scrolling)
Clean and lightweight for any timeframe
🎨 Visual Customizations:
Monthly: Black solid lines, label as MH/ML/MC/CMO
Weekly: Purple dotted lines (H/L), Turquoise thick line (1V)
Daily: Black solid (PDH/PDL), Black dotted (PDC)
✅ Ideal For:
Traders who use multi-timeframe analysis
Intraday scalpers and swing traders
Spotting key historical levels with clarity

