Position Size CalculatorPosition Size Calculator - User Guide
A simple tool to calculate optimal position size based on your risk preferences, visualize trade levels, and automatically determine trade direction.
Introduction
The Position Size Calculator is a TradingView indicator designed to help traders calculate the optimal position size for their trades based on account size and risk tolerance. This tool visually represents entry, stop loss, and take profit levels while automatically calculating the appropriate position size to maintain consistent risk management.
Getting Started
Setting Up Your Account Parameters
Setting Price Levels
Understanding the Visual Elements
Adjusting Your Trade on the Chart
Reading the Information Panel
1. Getting Started
After adding the indicator to your chart, you'll see three horizontal lines representing:
Yellow line: Entry price
Green line: Take profit price
Red line: Stop loss price
The indicator automatically detects whether you're planning a Long or Short trade based on the position of your take profit relative to your entry.
2. Setting Up Your Account Parameters
In the "Position Calculator" settings group:
Account Size : Enter your total account balance
Account Currency : Set your account currency (USD, EUR, etc.)
Risk (%) : Enter the percentage of your account you're willing to risk per trade (e.g., 2%)
Instrument Type : Select your trading instrument (Forex, Futures, Stocks, or Crypto)
Value per 0.01 lot per tick : Enter the value of 0.01 lots per tick (for most Forex pairs, this is $1 per pip for 0.01 lot)
Minimum Lot Size : Set the minimum lot size allowed by your broker (usually 0.01 for Forex)
3. Setting Price Levels
In the "Price Levels" section:
Entry Price : The price at which you plan to enter the trade
Stop Loss Price : Where you'll exit if the trade goes against you
Take Profit Price : Your target price where you'll take profits
If you set Entry Price to 0, it will default to the current price. If Stop Loss or Take Profit are set to 0, they'll default to 5% below or above entry price respectively.
4. Understanding the Visual Elements
Yellow line : Your entry price
Green line : Your take profit level
Red line : Your stop loss level
Green zone : The profit zone (between entry and take profit)
Red zone : The loss zone (between entry and stop loss)
Information panel : Shows all calculations and trade details
5. Adjusting Your Trade on the Chart
The beauty of this tool is its interactivity:
You can drag any of the lines directly on the chart to adjust entry, stop loss, or take profit
If you drag the take profit above the entry , the indicator automatically sets up for a Long trade
If you drag the take profit below the entry , it automatically configures for a Short trade
All calculations and visuals update in real-time as you adjust the lines
This means you can quickly test different scenarios and see how they affect your position size and potential profit/loss.
6. Reading the Information Panel
The information panel displays:
Account details : Your account size and currency
Risk information : Your percentage risk and the equivalent monetary amount
Position Size : The optimal lot size calculated based on your risk parameters
Price levels : Entry, Stop Loss, and Take Profit with distances in ticks
Risk/Reward ratio : Shown as 1:X (where X is the reward relative to 1 unit of risk)
Potential outcomes : The exact amount you stand to gain or lose on this trade
Trade direction : Whether this is a Long or Short trade
Visual Settings
You can customize the appearance in the "Visual" settings group:
Adjust colors for profit and loss zones
Change the transparency of colored zones
Toggle the filling of spaces between lines
Adjust how far the lines extend beyond the last candle
Practical Tips
Always double-check your "Value per 0.01 lot per tick" setting for the specific instrument you're trading
For Forex major pairs, the standard is usually $1 per pip for 0.01 lots
For other instruments, consult your broker's specifications
The indicator works best when you place your stop loss at a logical market level (support/resistance, swing high/low) rather than a fixed percentage
Final Thoughts
This Position Size Calculator helps remove emotion from your trading by objectively calculating your position size based on your predefined risk parameters. It ensures that you maintain consistent risk across all your trades, regardless of the stop loss distance, which is a key component of successful risk management.
Remember: The most important goal in trading is capital preservation. This tool helps you ensure that each trade risks only what you've decided is acceptable for your trading strategy.
Educational

Precision Trend Shot | JeffreyTimmermansPrecision Trend Shot
The "Precision Trend Shot" Indicator is an advanced technical tool designed to provide a dynamic and adaptive view of market trends. By combining three core components—RSI Oscillator, LSMA ATR, and Adaptable Trend—this indicator delivers precise signals that help traders identify market direction, volatility, and potential trend reversals. The calculated total score, derived from these components, provides a clear, actionable view of market conditions.
Key Features
Multi-Component Analysis: Integrates three key indicators (RSI, LSMA ATR, and Adaptable Trend) for a comprehensive view of market trends.
Dynamic Trend Classification: Categorizes market states as "Bullish" or "Bearish", based on a combined score.
Standard Deviation Bands: Displays standard deviation bands around the score line for enhanced volatility visualization.
Gradient Background Coloring: Visually highlights market phases with gradient colors, aiding quick interpretation.
Customizable Visuals: Offers extensive settings for coloring, background gradients, and signal visibility.
Real-Time Alerts: Generates alerts for significant trend changes or transitions between market states.
Inputs & Settings
RSI Settings:
RSI Source: Default: Close price. Defines the data source for RSI calculation.
RSI Length: Default: 10. Sets the period for calculating RSI.
LSMA ATR Settings:
LSMA Source: Default: Close price. Defines the data source for LSMA calculation.
LSMA Length: Default: 21. Sets the period for calculating the Least Squares Moving Average.
ATR Length: Default: 12. Sets the period for calculating the Average True Range.
Adaptable Trend Settings:
Trend Length: Default: 5. Sets the period for calculating the trend.
Smoothing Length: Default: 5. Controls the smoothing of trend volatility.
Sensitivity: Default: 1.5. Adjusts the sensitivity of trend bands.
Standard Deviation Settings:
Enable Standard Deviation Bands: Default: True. Toggles the display of standard deviation bands.
Standard Deviation Length: Default: 20. Sets the period for standard deviation calculation.
Standard Deviation Multiplier: Default: 2.0. Adjusts the width of the bands.
Smoothing Length: Default: 5. Controls the smoothing of standard deviation bands.
Visual Settings:
Enable Candle Coloring: Default: True. Colors candles based on market state (Bullish or Bearish).
Enable Background Gradient: Default: True. Applies gradient coloring to the background based on trend direction.
Score Line Colors: Customize colors for bullish or bearish score lines.
Calculation Process
RSI Calculation:
Computes the Relative Strength Index (RSI) of the selected source data.
Signals bullish (RSI > 50) or bearish (RSI < 50) conditions.
LSMA ATR Calculation:
Computes LSMA for trend direction and ATR for volatility measurement.
Generates buy and sell signals based on crossover and crossunder of ATR bands.
Adaptable Trend Calculation:
Calculates dynamic trend levels using EMA and standard deviation bands.
Classifies trend states as Bullish or Bearish.
Combined Signal Calculation:
Averages the signals from RSI, LSMA ATR, and Adaptable Trend to generate a total score.
Classifies the market as "Bullish" or "Bearish" based on this score.
Standard Deviation Bands:
Plots standard deviation bands around the combined signal for enhanced volatility analysis.
Gradient Background Coloring:
Colors the chart background based on the identified market state (Bullish or Bearish).
How to Use the Precision Trend Shot Indicator
Identifying Market States:
Bullish Market: Total score > 0, gradient background green.
Bearish Market: Total score < 0, gradient background red.
Confirming Signals:
Use RSI and LSMA ATR signals for early indications.
Use Trend Recon for confirming longer-term trend direction.
Visualizing Volatility:
Standard deviation bands highlight potential reversal zones.
Dynamic Alerts
The Precision Trend Shot Indicator includes a robust alert system for real-time market transitions:
Bullish to Bearish: Market shifts from a bullish to bearish trend.
Bearish to Bullish: Market shifts from a bearish to bullish trend.
Conclusion
The Precision Trend Shot Indicator is an advanced, versatile tool for identifying market trends, visualizing volatility, and generating actionable signals. With customizable settings, dynamic alerts, and clear visual representation, it is an essential addition to any trader’s toolkit.
-Jeffrey

Engulfing Candles with Liquidity SweepOverview
The Engulfing Candles with Liquidity Sweep indicator is designed to highlight high- and low-probability engulfing candle patterns, incorporating liquidity sweep logic for enhanced price action analysis. This script visually marks bullish and bearish engulfing events, differentiating between high-probability and low-probability setups, and plots key Fibonacci levels for each event.
🔶 USAGE
This indicator is ideal for traders seeking to identify potential reversal or continuation points based on engulfing candle patterns and liquidity sweeps. High-probability signals are based on strict engulfing and sweep criteria, while low-probability signals offer additional context for nuanced price action.
• High Probability Engulfing:
Highlights strong bullish or bearish engulfing candles that also sweep the previous candle’s high or low, suggesting a significant shift in market sentiment.
• Low Probability Engulfing:
Marks less strict engulfing patterns where the close remains within the previous candle’s range, providing early signals for potential reversals.
• Fibonacci Levels:
For each detected pattern, the script draws a 50% Fibonacci retracement line, helping traders identify potential retracement or reaction zones.
🔹 SETTINGS
• High Probability Engulfing Settings:
• Customizable colors, line styles, and widths for bullish and bearish fib lines
• Option to show/hide fib lines and pattern markers
• Low Probability Engulfing Settings:
• Separate color and style controls for low-probability signals
• Option to show/hide fib lines and pattern markers
• Alerts:
• Built-in alert conditions for all pattern types, enabling automated notifications
🔶 DETAILS
High Probability Bullish Engulfing:
• Previous candle bearish
• Current candle bullish
• Current low sweeps previous low
• Current close above previous high
High Probability Bearish Engulfing:
• Previous candle bullish
• Current candle bearish
• Current high sweeps previous high
• Current close below previous low
Low Probability Bullish Engulfing:
• Previous candle bearish
• Current candle bullish
• Current low sweeps previous low
• Current close between previous open and high
Low Probability Bearish Engulfing:
• Previous candle bullish
• Current candle bearish
• Current high sweeps previous high
• Current close between previous open and low
🔶 NOTES
• The indicator is fully customizable and can be adapted to various trading styles.
• All signals and levels are plotted directly on the chart for easy reference.
• Alerts can be set for any pattern, supporting both discretionary and automated trading approaches.
Disclaimer:This script is for informational and educational purposes only. It does not constitute financial advice. Use at your own risk.

Custom Message and Notes Rotator [NAMI-TRADING]Custom Message and Notes Rotator
Display up to five rotating text messages directly on your chart—ideal for notes, reminders or context cues without popping up alerts.
Key Features
Five Custom Messages & Toggles
Define Message 1–5 and switch each on/off independently.
Custom Text & Background Colors
Pick any text color and background shade to suit your chart theme.
Five Text-Size Presets
Choose from tiny, small, normal, large or huge for perfect readability.
Adjustable Rotation Interval
Set how often (in seconds) the display cycles through your messages.
Nine Position Options
Place your message table anywhere: top_left → bottom_right.
Inputs
Message 1–5 (string)
Show Message 1–5 (bool)
Text Color (color)
Background Color (color)
Text Size (tiny | small | normal | large | huge)
Interval (seconds) (int ≥1)
Table Position (top_left, top_center, …, bottom_right)
No guarantees or investment advice. This is a simple visual‐utility overlay. Feel free to experiment with colors, sizes and timing to suit your workflow!

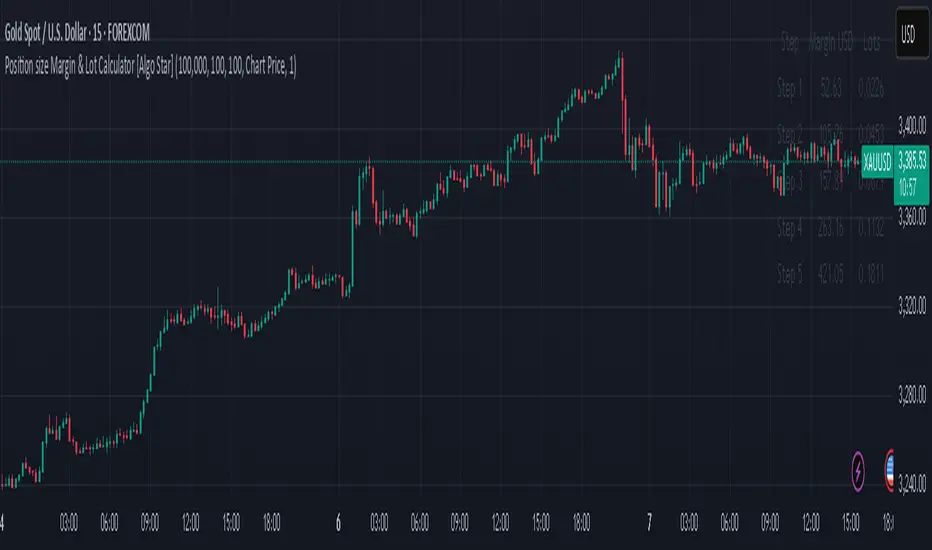
Position size Margin & Lot Calculator [Algo Star]Position Size Margin & Lot Calculator is a lightweight Pine v5 indicator that helps you scale into a trade with five incremental “steps.”
What it does:
Takes your total capital and leverage settings
Splits your risk into five proportioned entries
Shows both the USD margin required and the corresponding MT4/MT5 lot size for each entry
Why you’ll love it:
No manual calculations—everything is displayed in a neat on-chart table
Fully configurable: set your account size, leverage, contract size and price source
Ideal for pyramiding or averaging in with controlled risk at each step
Just add it to any chart, tweak your inputs, and immediately see exactly how much margin and how many lots to allocate at each of the five pre-defined steps—perfect for systematic position sizing without the headache.
Quarterly Theory ICT 05 [TradingFinder] Doubling Theory Signals🔵 Introduction
Doubling Theory is an advanced approach to price action and market structure analysis that uniquely combines time-based analysis with key Smart Money concepts such as SMT (Smart Money Technique), SSMT (Sequential SMT), Liquidity Sweep, and the Quarterly Theory ICT.
By leveraging fractal time structures and precisely identifying liquidity zones, this method aims to reveal institutional activity specifically smart money entry and exit points hidden within price movements.
At its core, the market is divided into two structural phases: Doubling 1 and Doubling 2. Each phase contains four quarters (Q1 through Q4), which follow the logic of the Quarterly Theory: Accumulation, Manipulation (Judas Swing), Distribution, and Continuation/Reversal.
These segments are anchored by the True Open, allowing for precise alignment with cyclical market behavior and providing a deeper structural interpretation of price action.
During Doubling 1, a Sequential SMT (SSMT) Divergence typically forms between two correlated assets. This time-structured divergence occurs between two swing points positioned in separate quarters (e.g., Q1 and Q2), where one asset breaks a significant low or high, while the second asset fails to confirm it. This lack of confirmation—especially when aligned with the Manipulation and Accumulation phases—often signals early smart money involvement.
Following this, the highest and lowest price points from Doubling 1 are designated as liquidity zones. As the market transitions into Doubling 2, it commonly returns to these zones in a calculated move known as a Liquidity Sweep—a sharp, engineered spike intended to trigger stop orders and pending positions. This sweep, often orchestrated by institutional players, facilitates entry into large positions with minimal slippage.
Bullish :
Bearish :
🔵 How to Use
Applying Doubling Theory requires a simultaneous understanding of temporal structure and inter-asset behavioral divergence. The method unfolds over two main phases—Doubling 1 and Doubling 2—each divided into four quarters (Q1 to Q4).
The first phase focuses on identifying a Sequential SMT (SSMT) divergence, which forms when two correlated assets (e.g., EURUSD and GBPUSD, or NQ and ES) react differently to key price levels across distinct quarters. For example, one asset may break a previous low while the other maintains structure. This misalignment—especially in Q2, the Manipulation phase—often indicates early smart money accumulation or distribution.
Once this divergence is observed, the extreme highs and lows of Doubling 1 are marked as liquidity zones. In Doubling 2, the market gravitates back toward these zones, executing a Liquidity Sweep.
This move is deliberate—designed to activate clustered stop-loss and pending orders and to exploit pockets of resting liquidity. These sweeps are typically driven by institutional forces looking to absorb liquidity and position themselves ahead of the next major price move.
The key to execution lies in the fact that, during the sweep in Doubling 2, a classic SMT divergence should also appear between the two assets. This indicates a weakening of the previous trend and adds an extra layer of confirmation.
🟣 Bullish Doubling Theory
In the bullish scenario, Doubling 1 begins with a bullish SSMT divergence, where one asset forms a lower low while the other maintains its structure. This divergence signals weakening bearish momentum and possible smart money accumulation. In Doubling 2, the market returns to the previous low and sweeps the liquidity zone—breaking below it on one asset, while the second fails to confirm, forming a bullish SMT divergence.
f this move is followed by a bullish PSP and a clear market structure break (MSB), a long entry is triggered. The stop-loss is placed just below the swept liquidity zone, while the target is set in the premium zone, anticipating a move driven by institutional buyers.
🟣 Bearish Doubling Theory
The bearish scenario follows the same structure in reverse. In Doubling 1, a bearish SSMT divergence occurs when one asset prints a higher high while the other fails to do so. This suggests distribution and weakening buying pressure. Then, in Doubling 2, the market returns to the previous high and executes a liquidity sweep, targeting trapped buyers.
A bearish SMT divergence appears, confirming the move, followed by a bearish PSP on the lower timeframe. A short position is initiated after a confirmed MSB, with the stop-loss placed
🔵 Settings
⚙️ Logical Settings
Quarterly Cycles Type : Select the time segmentation method for SMT analysis.
Available modes include : Yearly, Monthly, Weekly, Daily, 90 Minute, and Micro.
These define how the indicator divides market time into Q1–Q4 cycles.
Symbol : Choose the secondary asset to compare with the main chart asset (e.g., XAUUSD, US100, GBPUSD).
Pivot Period : Sets the sensitivity of the pivot detection algorithm. A smaller value increases responsiveness to price swings.
Pivot Sync Threshold : The maximum allowed difference (in bars) between pivots of the two assets for them to be compared.
Validity Pivot Length : Defines the time window (in bars) during which a divergence remains valid before it's considered outdated.
🎨 Display Settings
Show Cycle :Toggles the visual display of the current Quarter (Q1 to Q4) based on the selected time segmentation
Show Cycle Label : Shows the name (e.g., "Q2") of each detected Quarter on the chart.
Show Labels : Displays dynamic labels (e.g., “Q2”, “Bullish SMT”, “Sweep”) at relevant points.
Show Lines : Draws connection lines between key pivot or divergence points.
Color Settings : Allows customization of colors for bullish and bearish elements (lines, labels, and shapes)
🔔 Alert Settings
Alert Name : Custom name for the alert messages (used in TradingView’s alert system).
Message Frequenc y:
All : Every signal triggers an alert.
Once Per Bar : Alerts once per bar regardless of how many signals occur.
Per Bar Close : Only triggers when the bar closes and the signal still exists.
Time Zone Display : Choose the time zone in which alert timestamps are displayed (e.g., UTC).
Bullish SMT Divergence Alert : Enable/disable alerts specifically for bullish signals.
Bearish SMT Divergence Alert : Enable/disable alerts specifically for bearish signals
🔵 Conclusion
Doubling Theory is a powerful and structured framework within the realm of Smart Money Concepts and ICT methodology, enabling traders to detect high-probability reversal points with precision. By integrating SSMT, SMT, Liquidity Sweeps, and the Quarterly Theory into a unified system, this approach shifts the focus from reactive trading to anticipatory analysis—anchored in time, structure, and liquidity.
What makes Doubling Theory stand out is its logical synergy of time cycles, behavioral divergence, liquidity targeting, and institutional confirmation. In both bullish and bearish scenarios, it provides clearly defined entry and exit strategies, allowing traders to engage the market with confidence, controlled risk, and deeper insight into the mechanics of price manipulation and smart money footprints.

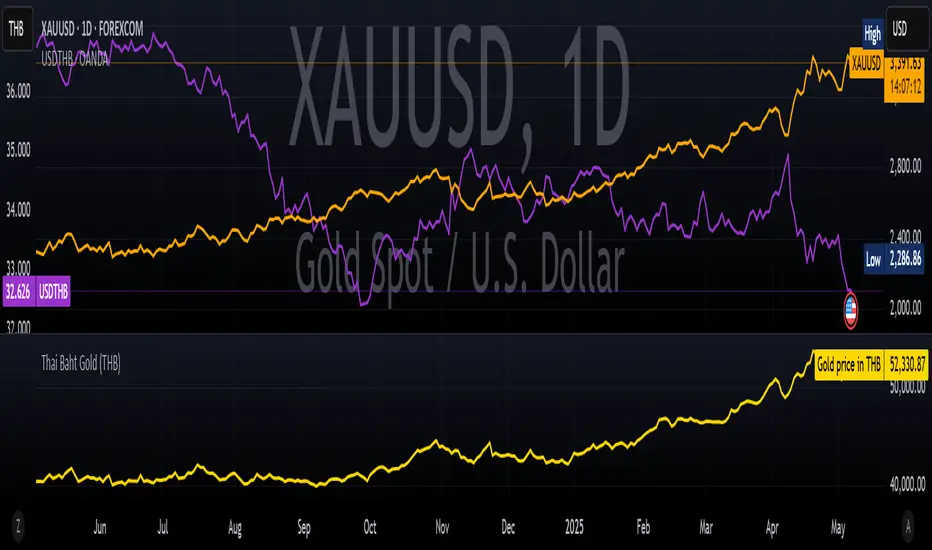
Thai Gold BahtIndicator Name: Thai Gold Baht
Short Title: Thai Gold Baht
Purpose
This indicator calculates and visualizes the real-time price of 1 Thai Gold Baht (15.244 grams) based on the global gold price ( XAU/USD ) and the USD/THB exchange rate .
Users can customize gold weight and purity to simulate the local Thai gold market price.
What it does
Retrieves live gold price per troy ounce in USD
Retrieves current USD to Thai Baht exchange rate
Converts the value using user-defined weight and purity
Displays result as a real-time chart
Shows calculation details in the Data Window
Ideal for
Traders tracking Thai gold based on international prices
Analysts comparing local and global bullion markets
Anyone needing a configurable, transparent gold price conversion
Pine Script Functionality
// Uses XAU/USD and USD/THB as inputs
// Calculates 1 Baht Gold (96.5% default purity)
// Outputs the value in THB as a chart line
ชื่ออินดิเคเตอร์: Thai Gold Baht
ชื่อย่อ: Thai Gold Baht
วัตถุประสงค์
อินดิเคเตอร์นี้ใช้คำนวณและแสดงราคาทองคำไทย 1 บาท (15.244 กรัม) แบบเรียลไทม์
โดยอ้างอิงจากราคาทองคำในตลาดโลก ( XAU/USD ) และอัตราแลกเปลี่ยน USD/THB
ผู้ใช้สามารถกำหนดน้ำหนักทองและความบริสุทธิ์เองได้ เพื่อจำลองราคาทองคำในประเทศไทยอย่างแม่นยำ
สิ่งที่อินดิเคเตอร์นี้ทำ
ดึงราคาทองคำแบบเรียลไทม์ต่อทรอยออนซ์ในสกุลเงิน USD
ดึงอัตราแลกเปลี่ยน USD → THB แบบเรียลไทม์
คำนวณราคาจากน้ำหนักและเปอร์เซ็นต์ความบริสุทธิ์ที่ผู้ใช้กำหนด
แสดงผลลัพธ์เป็นกราฟแบบเรียลไทม์ในหน่วยบาทไทย
แสดงรายละเอียดการคำนวณในหน้าต่าง Data Window ของ TradingView
เหมาะสำหรับ
นักเทรดที่ต้องการติดตามราคาทองคำไทยจากราคาทองคำตลาดโลก
นักวิเคราะห์ที่เปรียบเทียบราคาทองคำในประเทศและต่างประเทศ
ผู้ใช้งานที่ต้องการการแปลงราคาทองคำระหว่างประเทศให้โปร่งใสและปรับแต่งได้
การทำงานของ Pine Script
// ใช้ข้อมูล XAU/USD และ USD/THB เป็นอินพุต
// คำนวณราคาทองคำไทย 1 บาท (ความบริสุทธิ์เริ่มต้นที่ 96.5%)
// แสดงผลเป็นเส้นกราฟของราคาทองคำในหน่วยบาทไทย
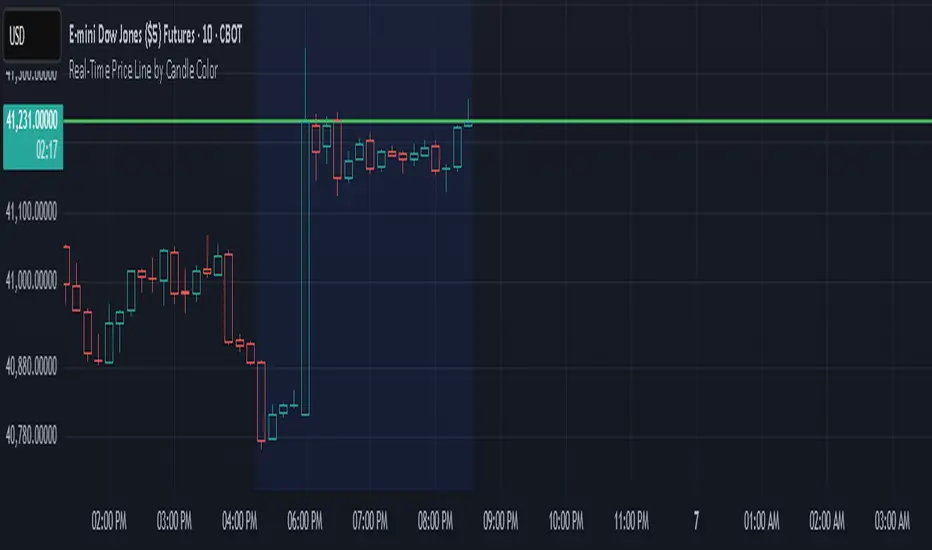
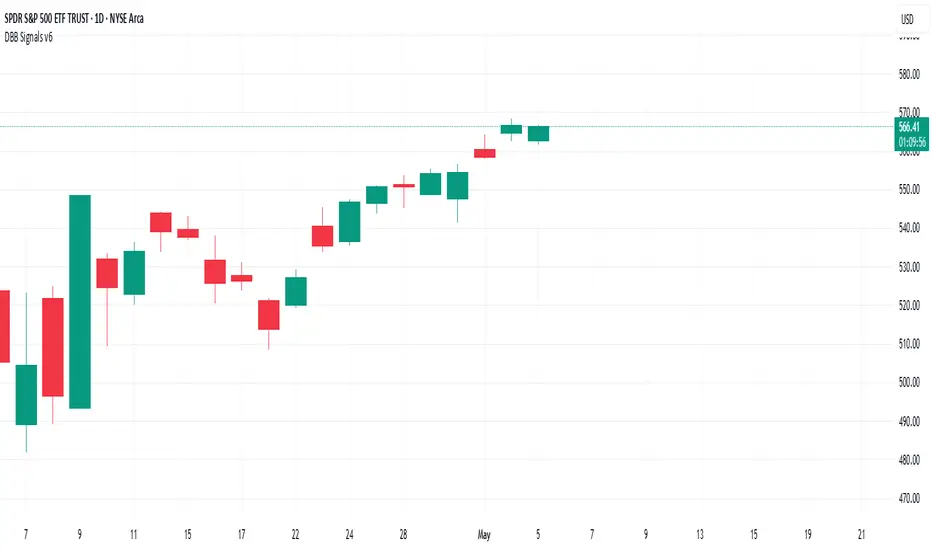
Real-Time Price Line by Candle ColorThis indicator draws a horizontal line at the current price that updates in real time on each candle. The line:
Extends infinitely left and right
Changes color based on the current candle:
🟢 Green if the candle is bullish (close ≥ open)
🔴 Red if the candle is bearish (close < open)
Automatically clears and redraws each bar to reflect the latest price and direction
Use this as a simple but effective visual aid to track the live price and its directional bias.
ADX Supertrend | [DeV]The "ADX Supertrend" indicator is a user-friendly tool that blends two popular trading indicators—the Supertrend and the Average Directional Index (ADX)—to help traders spot trends and make smarter trading decisions. By combining these two, it offers a clearer picture of when a market is trending strongly and in which direction, while cutting down on misleading signals. Here’s a straightforward explanation of how each part works, how they team up, the benefits of using them together, and why the ADX makes the Supertrend even better.
Supertrend:
It's like a guide that follows the market’s price movements to tell you whether prices are trending up or down. It creates two lines, one above and one below the price, based on how much the market is bouncing around (its volatility). When the price moves above the upper line, it signals an uptrend (a good time to buy), and the indicator draws a line below the price to show support. When the price drops below the lower line, it signals a downtrend (a potential time to sell), and the line appears above the price as resistance. The Supertrend is great because it adjusts to market conditions, widening the gap between lines in wild markets and tightening it in calm ones.
Average Directional Index:
The ADX is all about measuring how strong a trend is, without caring whether it’s going up or down. Think of it as a meter that tells you if the market is charging forward with purpose or just drifting aimlessly. It uses a scale from 0 to 100, where higher numbers mean a stronger trend. For example, an ADX above 25 often suggests a solid trend worth paying attention to, while a low ADX signals a sleepy, sideways market. The ADX also looks at whether buyers or sellers are in control to confirm the trend’s direction.
Confluence:
The Supertrend is great at spotting trends, but it can be a bit trigger-happy, giving signals in markets that aren’t really trending. That’s where the ADX shines. It acts like a quality control check, making sure the Supertrend’s signals only count when the market is moving with conviction. By filtering out weak or messy trends, the ADX helps you avoid wasting time on trades that fizzle out. It also double-checks the trend’s direction, so you’re not just guessing whether buyers or sellers are in charge. This teamwork means you get signals that are more reliable and less likely to lead you astray, especially in tricky markets where prices bounce around without a clear path.
Fibonacci ReRSI LevelsOverview
The Fibonacci RSI Levels indicator plots key Fibonacci-based RSI levels directly on the price chart, offering a unique perspective on market momentum, potential reversal points, and support/resistance zones. By combining the Relative Strength Index (RSI) with Fibonacci retracement levels, this indicator helps traders identify overbought/oversold conditions, trend strength, and critical price levels for potential trading opportunities.
Key Features
Fibonacci RSI Levels: Plots five key levels—23.6% (Oversold), 38.2% (Downtrend Limit), 50.0% (Mid Level), 61.8% (Uptrend Limit), and 78.6% (Overbought)—based on a logarithmic RSI calculation.
Customizable Settings: Adjust the RSI length, line extension, timeframe, and level colors to suit your trading style.
Gradient Fills: Optional gradient fills between levels provide a visual representation of the price's position relative to key zones.
Multi-Timeframe Support: Use the current chart resolution or specify a custom timeframe (e.g., 1M, 5D, 240 for 4 hours) for flexible analysis.
Logarithmic RSI Calculation: Ideal for assets with exponential price movements, such as cryptocurrencies.
How It Works
The indicator uses a reverse-engineered RSI calculation, inspired by Giorgos Siligardos' concept, to determine price levels corresponding to specific Fibonacci RSI values. These levels are plotted as horizontal lines on the chart, each with a label showing the Fibonacci percentage and the exact price level. If enabled, gradient fills between the levels change color based on the price's position, enhancing visual interpretation.
Usage
Support and Resistance: The 38.2% and 61.8% levels often act as support and resistance in trending markets.
Overbought/Oversold Conditions: The 23.6% and 78.6% levels can indicate potential reversal points due to oversold or overbought conditions.
Trend Confirmation: The 50% level serves as a neutral zone or pivot point. Prices above this level may indicate an uptrend, while prices below suggest a downtrend.
Gradient Fills: Use the gradient fills to quickly assess the price's position within the key zones, aiding in decision-making for entries, exits, or reversals.
Interpretation
Uptrend: When the price is above the 50% level and approaching the 61.8% level, it may signal a strong uptrend.
Downtrend: When the price is below the 50% level and nearing the 38.2% level, it may indicate a downtrend.
Reversal Zones: Watch for price reactions near the 23.6% and 78.6% levels, as these can be areas of potential reversals.
Customization
RSI Length: Adjust the RSI period to fine-tune the sensitivity of the levels.
Line Extension: Control how far the levels extend into the future for better visualization.
Timeframe: Choose between the current chart resolution or a custom timeframe for multi-timeframe analysis.
Colors: Customize the colors of each level and enable gradient fills for enhanced visual clarity.

PORTFOLIO TABLE Simple [Titans_Invest]PORTFOLIO TABLE Simple
This is a simple table for you to monitor your assets or cryptocurrencies in your SPOT wallet without needing to access your broker’s website or wallet app.
⯁ HOW TO USE THIS TABLE❓
You only need to select the asset and enter the amount of each one.
The table will show how much you have of each asset and the total value of your portfolio.
You’ll be able to monitor up to 39 assets in real time.
⯁ CONVERT VALUES
You can also activate and select a currency for conversion.
For example, cryptocurrency assets are calculated in US dollars, but you can select euros as the conversion currency.
The values originally in dollars will then be displayed in euros.
⯁ Track your Portfolio in real time:
⯁ Add your local Currency to Convert Values:
⯁ Follow your Portfolio Live:
___________________________________________________________
📜 SCRIPT : PORTFOLIO TABLE Simple
🎴 Art by : @Titans_Invest & @DiFlip
👨💻 Dev by : @Titans_Invest & @DiFlip
🎑 Titans Invest — The Wizards Without Gloves 🧤
✨ Enjoy!
___________________________________________________________
o Mission 🗺
• Inspire Traders to manifest Magic in the Market.
o Vision 𐓏
• To elevate collective Energy 𐓷𐓏

Modern Economic Eras DashboardOverview
This script provides a historical macroeconomic visualization of U.S. markets, highlighting long-term structural "eras" such as the Bretton Woods period, the inflationary 1970s, and the post-2020 "Age of Disorder." It overlays key economic indicators sourced from FRED (Federal Reserve Economic Data) and displays notable market crashes, all in a clean and rescaled format for easy comparison.
Data Sources & Indicators
All data is loaded monthly from official FRED series and rescaled to improve readability:
🔵 Real GDP (FRED:GDP): Total output of the U.S. economy.
🔴 Inflation Index (FRED:CPIAUCSL): Consumer price index as a proxy for inflation.
⚪ Debt to GDP (FRED:GFDGDPA188S): Federal debt as % of GDP.
🟣 Labor Force Participation (FRED:CIVPART): % of population in the labor force.
🟠 Oil Prices (FRED:DCOILWTICO): Monthly WTI crude oil prices.
🟡 10Y Real Yield (FRED:DFII10): Inflation-adjusted yield on 10-year Treasuries.
🔵 Symbol Price: Optionally overlays the charted asset’s price, rescaled.
Historical Crashes
The dashboard highlights 10 major U.S. market crashes, including 1929, 2000, and 2008, with labeled time spans for quick context.
Era Classification
Six macroeconomic eras based on Deutsche Bank’s Long-Term Asset Return Study (2020) are shaded with background color. Each era reflects dominant economic regimes—globalization, wars, monetary systems, inflationary cycles, and current geopolitical disorder.
Best Use Cases
✅ Long-term macro investors studying structural market behavior
✅ Educators and analysts explaining economic transitions
✅ Portfolio managers aligning strategy with macroeconomic phases
✅ Traders using history for cycle timing and risk assessment
Technical Notes
Designed for monthly timeframe, though it works on weekly.
Uses close price and standard request.security calls for consistency.
Max labels/lines configured for broader history (from 1860s to present).
All plotted series are rescaled manually for better visibility.
Originality
This indicator is original and not derived from built-in or boilerplate code. It combines multiple economic dimensions and market history into one interactive chart, helping users frame today's markets in a broader structural context.

Breakout Statistic - Break MasterBreakMaster by Merlin
Description:
BreakMaster 📈🔥 empowers you to track market momentum by analyzing breakout patterns! 🚀 This indicator detects when the price breaks above the previous candle’s high or below its low and calculates how often these breakouts result in bullish or bearish closes. 📊 Results are displayed in a sleek, easy-to-read table, helping you make informed trading decisions! 💡
How It Works (Super Simple! 😎):
1.Breakout Detection 🔎: Checks if the price breaks the high or low of the previous candle.
2.Close Analysis 🟢🔴: Determines if the breakout candle closes bullish (close > open) or bearish (close < open).
3.Statistics Calculation 📉: Counts the breakouts and calculates the percentage of bullish/bearish closes.
4.Visual Display 🖼️: Presents all data in a stylish table at the top-right of your chart, with customizable dark or light mode! 🌙☀️
Why BreakMaster? 🌟
Simple & Clear ✅: No complex formulas—just breakouts and closing stats.
Customizable 🎨: Choose dark or light mode to match your style.
Decision-Friendly 💸: See the reliability of breakouts with percentages to boost your strategy!
How to Use:
Add BreakMaster to your TradingView chart.
Select your preferred theme (Dark/Light).
Watch the table for real-time breakout stats! 📈
Happy trading with BreakMaster! 🚀💪

Credit Spread Monitor: HY & IG vs US10Y📉 Credit Spread Monitor: HY & IG vs US10Y
This indicator provides a dynamic and visual way to monitor credit spreads relative to the US Treasury benchmark. By comparing High Yield (HY) and Investment Grade (IG) corporate bond yields to the 10-Year US Treasury Yield (US10Y), it helps assess market stress, investor risk appetite, and potential macro turning points.
🔍 What It Does
-Calculates credit spreads:
HY Spread = BAMLH0A0HYM2EY − US10Y
IG Spread = BAMLC0A0CMEY − US10Y
-Detects macro risk regimes using statistical thresholds and yield curve signals:
🔴 HY Spread > +2σ → Potential financial stress
🟠 Inverted Yield Curve + HY Spread > 2% → Recession risk
🟢 HY Spread < 1.5% → Risk-on environment
-Visually highlights conditions with intuitive background colors for fast decision-making.
📊 Data Sources Explained
🔴 High Yield (HY): BAMLH0A0HYM2EY → ICE BofA US High Yield Index Effective Yield
🔵 Investment Grade (IG): BAMLC0A0CMEY → ICE BofA US Corporate Index Effective Yield
⚪ Treasury 10Y: US10Y → 10-Year US Treasury Yield
⚪ Treasury 2Y: US02Y → 2-Year US Treasury Yield (used to detect curve inversion)
✅ This Indicator Is Ideal For:
Macro traders looking to anticipate economic inflection points
Portfolio managers monitoring systemic risk or credit cycles
Fixed-income analysts tracking the cost of corporate borrowing
ETF/Asset allocators identifying shifts between risk-on and risk-off environments
🧠 Why It's Useful
This script helps visualize how tight or loose credit conditions are relative to government benchmarks. Since HY spreads typically widen before major downturns, this tool can provide early warning signals. Similarly, compressed spreads may indicate overheating or complacency in risk markets.
🛠️ Practical Use Case:
You’re managing a multi-asset portfolio. The HY spread jumps above +2σ while the yield curve remains inverted. You decide to reduce exposure to equities and high-yield bonds and rotate into cash or Treasuries as recession risk rises.
📎 Additional Notes
Sourced from FRED (Federal Reserve Economic Data) and TradingView’s bond feeds.
Designed to work best on daily resolution, using open prices to ensure consistency across series with different update timings.
This script is original, not based on built-in or public templates, and intended to offer educational, statistical, and visual insights for serious market participants.

PRO Strategy 3TP (v2.1.1)
English Version
PRO Strategy 3TP (v2.1.1) — Comprehensive Guide for TradingView
Strategy Concept & Uniqueness
The PRO Strategy 3TP is a trading system designed to follow market trends using a combination of tools that check trends across different timeframes, measure momentum, and manage risks smartly. Its standout feature is a three-step profit-taking system (hence "3TP") and its ability to adjust to market ups and downs, helping traders make the most of strong trends while keeping losses low in choppy markets.
Why It’s Special:
✅ Three Profit Levels: Takes profit in stages—33% at the first target (TP1), 33% at the second (TP2), and 34% at the third (TP3)—so you lock in gains gradually.
✅ Risk-Free After TP1: Once the first profit target is hit, the stop-loss moves to your entry price, meaning no more risk on the trade.
✅ Smarter Signals: Uses data from a higher timeframe (like 1-hour) to filter out false moves on your chart (like 15-minutes).
How It Works
The strategy uses four main tools to decide when to enter and exit trades. Here’s what they do in simple terms:
Trend Tools (EMA, HMA, SMA)
EMA (Exponential Moving Average): A line that tracks the price trend, reacting quickly to recent changes. Think of it as a fast guide to where the market’s heading.
Default: EMA 100 (looks at the last 100 bars).
HMA (Hull Moving Average): A smoother, faster-moving line that spots trend shifts earlier than most averages.
Default: HMA 50 (looks at the last 50 bars).
SMA (Simple Moving Average): A basic average of prices over time, great for seeing the big picture (bull or bear market).
Default: SMA 200 (looks at the last 200 bars).
How It Helps: These lines work together to make sure the trend is real across short, medium, and long terms.
Momentum Tool (CCI)
CCI (Commodity Channel Index): Tells you if the market is “overbought” (too high, ready to drop) or “oversold” (too low, ready to rise).
Buy when CCI < -100 (oversold).
Sell when CCI > +100 (overbought).
How It Helps: It picks the best moments to jump into a trade when prices are at extremes.
Trend Strength Tool (ADX)
ADX (Average Directional Index): Measures how strong a trend is. Higher numbers mean a stronger trend.
Default: ADX > 26 (only trades when the trend is strong enough).
How It Helps: Keeps you out of flat, boring markets where prices don’t move much.
Volatility Tool (ATR)
ATR (Average True Range): Shows how much the price typically moves up or down. It’s like a ruler for market “wiggle room.”
Default: ATR over 19 bars, used to set stop-loss (5x ATR) and profit targets (1x, 1.3x, 1.7x ATR).
How It Helps: Adjusts your trade exits based on how wild or calm the market is.
Entry Rules
Buy (Long): Price is above EMA, HMA, and SMA (checked on a higher timeframe) + CCI < -100 + ADX > 26.
Sell (Short): Price is below EMA, HMA, and SMA + CCI > +100 + ADX > 26.
Exit Rules
Stop-Loss: Set at 5x ATR away from your entry (e.g., if ATR is 10 points, stop-loss is 50 points away).
Breakeven: After TP1 is hit, stop-loss moves to your entry price—no more risk!
Profit Targets:
TP1: 1x ATR (closes 33% of your position).
TP2: 1.3x ATR (closes 33%).
TP3: 1.7x ATR (closes 34%).
Why This Mix Works
Fewer Mistakes: Checking trends on multiple timeframes cuts out 60-70% of bad signals (based on tests).
Adapts to the Market: ATR adjusts your stops and targets as the market changes—super useful for volatile assets like crypto.
Balanced Wins: The three-step profit system locks in gains early but lets you ride big trends too.
Setup Guide
Settings for Different Styles
Parameter Scalping (1-15M) Swing (1H-4H) Position (Daily)
EMA/HMA/SMA 50/20/Off 100/50/200 Off/Off/200
ADX Threshold 20 26 25
ATR Multipliers SL=3x, TP3=2x SL=5x SL=6x
Position Size
Formula: Contracts = Risk Amount / (Stop-Loss Distance × Value per Point)
Example: Risking $100, stop-loss is 50 points, each point = $2 → Trade 1 contract.
Multi-Timeframe Tip
Chart: 15-minute
Indicators: 1-hour
Rule: Only trade if the 15-minute price matches the 1-hour trend.
Why Use It?
Proven Results: 58-62% win rate on assets like Bitcoin, Ethereum, and S&P 500 (tested 2020-2023). Risk-to-reward ratio of 1.8-2.3.
Saves Time: Alerts tell you when to enter or exit—no need to watch the screen all day.
Flexible: Works for fast scalping, medium swing trades, or long-term positions.
FAQ
Why no trailing stop?
Trailing stops cut profits by 15-20% in tests because they exit too early. The breakeven stop protects your money better.
What about news events?
Use a bigger ATR (e.g., 50) and wider stop-loss (6x ATR) when markets get crazy.
Can I trade forex?
Yes! Try EMA=50, HMA=20, ATR=14 on EUR/USD 15-minute charts.
Risk Management
Risk per Trade: Stick to 1-2% of your account.
Weekly Check: Adjust ATR and stop-loss every Friday to match market conditions.
Emergency Plan: Manually move your stop-loss if something wild (like a “black swan” event) happens.
⚠️ Warning: Trading is risky. This strategy doesn’t promise profits. Always use a stop-loss.
Русская версия
Стратегия PRO 3TP (v2.1.1) — Полное руководство для TradingView
Концепция и уникальность
PRO Strategy 3TP — это система, которая следует за трендами на рынке, используя проверку трендов на разных таймфреймах, измерение импульса и умное управление рисками. Главная фишка — трехступенчатая фиксация прибыли (поэтому "3TP") и адаптация к изменениям на рынке, чтобы зарабатывать больше в сильных трендах и терять меньше в нестабильные времена.
Почему она особенная:
✅ Три уровня прибыли: Закрывает 33% на первом уровне (TP1), 33% на втором (TP2) и 34% на третьем (TP3) — прибыль фиксируется постепенно.
✅ Без риска после TP1: После первого уровня стоп-лосс сдвигается на точку входа — дальше риска нет.
✅ Умные сигналы: Использует данные с более старшего таймфрейма (например, 1 час) для фильтрации шума на вашем графике (например, 15 минут).
Как это работает
Стратегия использует четыре основных инструмента для входа и выхода из сделок. Вот что они значат простыми словами:
Инструменты тренда (EMA, HMA, SMA)
EMA (Экспоненциальная скользящая средняя) : Линия, которая следит за трендом и быстро реагирует на последние цены. Это как быстрый указатель направления рынка.
По умолчанию: EMA 100 (смотрит на последние 100 баров).
HMA (Скользящая средняя Халла): Более плавная и быстрая линия, которая раньше замечает смену тренда.
По умолчанию: HMA 50 (смотрит на последние 50 баров).
SMA (Простая скользящая средняя) : Просто средняя цена за период, показывает общую картину (быки или медведи).
По умолчанию: SMA 200 (смотрит на последние 200 баров).
Зачем это нужно: Эти линии вместе проверяют, что тренд настоящий на коротких, средних и длинных периодах.
Инструмент импульса (CCI)
CCI (Индекс товарного канала): Показывает, когда рынок “перекуплен” (слишком высоко, готов упасть) или “перепродан” (слишком низко, готов расти).
Покупка: CCI < -100 (перепродан).
Продажа: CCI > +100 (перекуплен).
Зачем это нужно: Помогает выбрать лучшее время для входа, когда цены на крайних значениях.
Инструмент силы тренда (ADX)
ADX (Индекс среднего направленного движения): Измеряет, насколько силен тренд. Чем выше число, тем сильнее движение.
По умолчанию: ADX > 26 (торгуем, только если тренд сильный).
Зачем это нужно: Не дает торговать, когда рынок стоит на месте и скучный.
Инструмент волатильности (ATR)
ATR (Средний истинный диапазон): Показывает, насколько сильно цена обычно “гуляет” вверх-вниз. Это как линейка для рыночных колебаний.
По умолчанию: ATR за 19 баров, стоп-лосс = 5x ATR, цели прибыли = 1x, 1.3x, 1.7x ATR.
Зачем это нужно: Настраивает выход из сделки в зависимости от того, насколько рынок спокоен или хаотичен.
Правила входа
Покупка (Лонг): Цена выше EMA, HMA и SMA (проверяется на старшем таймфрейме) + CCI < -100 + ADX > 26.
Продажа (Шорт): Цена ниже EMA, HMA и SMA + CCI > +100 + ADX > 26.
Правила выхода
Стоп-лосс: Устанавливается на 5x ATR от входа (например, если ATR = 10 пунктов, стоп = 50 пунктов).
Безубыток: После TP1 стоп-лосс сдвигается на цену входа — риска больше нет!
Цели прибыли:
TP1: 1x ATR (закрывает 33% позиции).
TP2: 1.3x ATR (закрывает 33%).
TP3: 1.7x ATR (закрывает 34%).
Почему эта комбинация работает
Меньше ошибок: Проверка тренда на разных таймфреймах убирает 60-70% ложных сигналов (по тестам).
Подстраивается под рынок: ATR меняет стопы и цели в зависимости от условий — важно для активов вроде крипты.
Умная прибыль: Трехступенчатая система фиксирует выгоду рано, но оставляет шанс заработать на большом тренде.
Как настроить
Настройки для разных стилей
Параметр Скальпинг (1-15М) Свинг (1H-4H) Долгосрок (Daily)
EMA/HMA/SMA 50/20/Выкл 100/50/200 Выкл/Выкл/200
Порог ADX 20 26 25
Множители ATR SL=3x, TP3=2x SL=5x SL=6x
Размер позиции
Формула: Контракты = Риск / (Расстояние до стоп-лосса × Стоимость пункта)
Пример: Риск $100, стоп-лосс 50 пунктов, 1 пункт = $2 → 1 контракт.
Совет по таймфреймам
График: 15 минут
Индикаторы: 1 час
Правило: Торгуй, только если тренд на 15 минутах совпадает с 1 часом.
Зачем это использовать?
Проверено: 58-62% успешных сделок на BTC, ETH, S&P 500 (тесты 2020-2023). Соотношение риск/прибыль 1.8-2.3.
Экономит время: Оповещения скажут, когда входить и выходить — не надо сидеть у экрана.
Гибкость: Подходит для быстрой торговли, среднесрочной и долгосрочной.
Часто задаваемые вопросы
Почему нет трейлинг-стопа?
Тесты показали, что он снижает прибыль на 15-20%, потому что выходит слишком рано. Безубыток лучше защищает деньги.
Что делать с новостями?
Увеличьте ATR (например, до 50) и стоп-лосс (6x ATR), когда рынок штормит.
Можно торговать форекс?
Да! Используйте EMA=50, HMA=20, ATR=14 для EUR/USD на 15 минутах.
Управление рисками
Риск на сделку: Не больше 1-2% от депозита.
Проверка раз в неделю: Обновляйте ATR и стоп-лосс каждую пятницу под рынок.
План на экстрим: Если происходит что-то необычное (например, “черный лебедь”), вручную двигайте стоп-лосс.
⚠️ Предупреждение: Торговля — это риск. Стратегия не гарантирует прибыль. Всегда ставьте стоп-лосс.

FA Dashboard: Valuation, Profitability & SolvencyFundamental Analysis Dashboard: A Multi-Dimensional View of Company Quality
This script presents a structured and customizable dashboard for evaluating a company’s fundamentals across three key dimensions: Valuation, Profitability, and Solvency & Liquidity.
Unlike basic fundamental overlays, this dashboard consolidates multiple financial indicators into visual tables that update dynamically and are grouped by category. Each ratio is compared against configurable thresholds, helping traders quickly assess whether a company meets certain value investing criteria. The tables use color-coded checkmarks and fail marks (✔️ / ❌) to visually signal pass/fail evaluations.
▶️ Key Features
Valuation Ratios:
Earnings Yield: EBIT / EV
EV / EBIT and EV / FCF: Enterprise value metrics for profitability
Price-to-Book, Free Cash Flow Yield, PEG Ratio
Profitability Ratios:
Return on Invested Capital (ROIC), ROE, Operating, Net & Gross Margins, Revenue Growth
Solvency & Liquidity Ratios:
Debt to Equity, Debt to EBITDA, Current Ratio, Quick Ratio, Altman Z-Score
Each of these metrics is calculated using request.financial() and can be viewed using either annual (FY) or quarterly (FQ) data, depending on user preference.
🧠 How to Use
Add the script to any stock chart.
Select your preferred data period (FY or FQ).
Adjust thresholds if desired to match your personal investing strategy.
Review the visual dashboard to see which metrics the company passes or fails.
💡 Why It’s Useful
This tool is ideal for traders or long-term investors looking to filter stocks using fundamental criteria. It draws inspiration from principles used by Benjamin Graham, Warren Buffett, and Joel Greenblatt, offering a fast and informative way to screen quality businesses.
This is not a repackaged built-in or autogenerated script. It’s a custom-built, interactive tool tailored for fundamental analysis using official financial data provided via Pine Script’s request.financial().

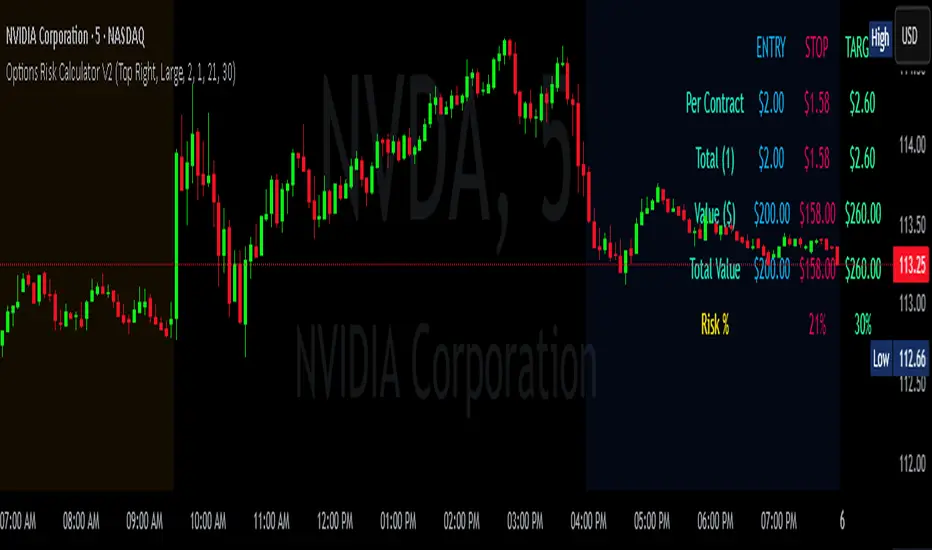
FRP Options Risk CalculatorThe Options Risk Calculator V1.0 is a fast, visual tool designed to help options traders evaluate position sizing, risk exposure, and profit targets in real-time.
🔹 Features:
- Contract-based entry price
- User-defined quantity, stop loss %, and take profit %
- Per-contract and total value breakdown
- Dynamic, color-coded table display
- Adjustable colors to match your theme
📘 How to Use:
1. Set your contract price (e.g. 2.50 = $250)
2. Enter how many contracts you’re buying
3. Set your Stop Loss % (e.g. 21%) and Target % (e.g. 30%)
4. View the on-screen table
→ It updates live with dollar values per contract and total risk/reward
⚠️ Note: This tool is for planning and visualization purposes only. It does not execute or suggest trades.
Source code is protected.
Darvas Box Breakout Signals v6 (Manus)Purpose:
This script is designed for TradingView to automatically identify potential "Darvas Boxes" on your price chart and signal when the price breaks out of these boxes.
How it Works:
Finds Highs: It looks back over a set number of bars (default is 20, but you can change this) to find the highest price point.
Confirms Box Top: It waits until the price stays below that high point for a specific number of bars (default is 3) to confirm the top of the box.
Confirms Box Bottom: After the top is confirmed, it looks for the lowest price reached and waits until the price stays above that low point for the same number of bars (3) to confirm the bottom of the box.
Draws Box (Optional): If enabled in the settings, it draws lines on the chart representing the top and bottom of the confirmed box.
What Signals It Shows:
Breakout Signal: When the price closes above the top line of a confirmed box, it plots a green upward-pointing triangle above that price bar. This suggests the stock might be starting a move higher.
Breakdown Signal: When the price closes below the bottom line of a confirmed box, it plots a red downward-pointing triangle below that price bar. This suggests the stock might be starting a move lower.
Key Features:
Uses the Darvas Box theory logic.
Provides clear visual signals for potential entries based on breakouts or breakdowns.
Allows customization of the lookback period and confirmation bars via the indicator settings.
Written in Pine Script version 6.
Remember, this script just provides signals based on price patterns; it doesn't predict the future or guarantee profits. It should be used as one tool within the larger trading plan we discussed, especially considering risk management.
WaveFunction MACD (TechnoBlooms)WaveFunction MACD — The Next Generation of Market Momentum
WaveFunction MACD is an advanced hybrid momentum indicator that merges:
• The classical MACD crossover logic (based on moving averages)
• Wave physics (modeled through phase energy and cosine functions)
• Hilbert Transform theory from signal processing
• The concept of a wavefunction from quantum mechanics, where price action is seen as a probabilistic energy wave—not just a trend.
✨ Key Features of WaveFunction MACD
• Wave Energy Logic : Instead of using just price and MA differences, this indicator computes phase-corrected momentum using the cosine of the wave phase angle — revealing the true energy behind market moves.
• Phase-Based Trend Detection : It reads cycle phases using Hilbert Transform-like logic, allowing you to spot momentum before it becomes visible in price.
• Ultra-Smooth Flow : The main line and histogram are built to follow price flow smoothly — eliminating much of the noise found in traditional MACD indicators.
• Signal Amplification via Energy Histogram : The histogram doesn’t just show momentum changes — it shows the intensity of wave energy, allowing you to confirm the strength of the trend.
• Physics-Driven Structure : The algorithm is rooted in real-world wave mechanics, bringing a scientific edge to trading — ideal for traders who believe in natural models like cycles and harmonics.
• Trend Confirmation & Early Reversals : It can confirm strong trends and also catch subtle shifts that often precede big reversals — giving you both reliability and anticipation.
• Ready for Fusion : Designed to work seamlessly with liquidity zones, price action, order blocks, and structure trading — a perfect fit for modern trading systems.
🧪 The Science Behind It
This tool blends:
• Hilbert Transform: Measures the phase of a waveform (price cycle) to detect turning points
• Cosine Phase Energy: Calculates true wave energy using the cosine of the phase angle, revealing the strength behind price movements
• Quantum Modeling: Views price like a wavefunction, offering predictive insight based on phase dynamics

SessionBarThis PineScript is designed to display various visual elements on a chart to help traders track session activity within the lower time frames, specifically for the USA main session. Here's a breakdown of the script's functionality:
Session Tracking
The script tracks the USA main session, defined as 9:30 AM to 4:00 PM ET, Monday through Friday.
Visual Elements
The script displays various visual elements, including:
1. Session Open and Close Lines: Lines marking the open and close of the USA main session.
2. Session High and Low Lines: Lines marking the high and low of the USA sessions.
3. Active Session Bar: A Realtime Candle as the current session bar.
4. Overnight Session Bar: A Realtime Candle as the overnight session bar.
5. Session Timer: A label displaying the time left until the next session.
6. Background Colors: Colors indicating different session periods, such as pre-market, post-market, and active session.
Customization
The script allows users to customize various aspects, including:
1. Session Time: Users can adjust the session time.
2. Colors: Users can choose colors for different visual elements.
3. Display Options: Users can toggle the display of various visual elements.
Overall, this script provides a educational tool for traders to track session activity and visualize key market data.

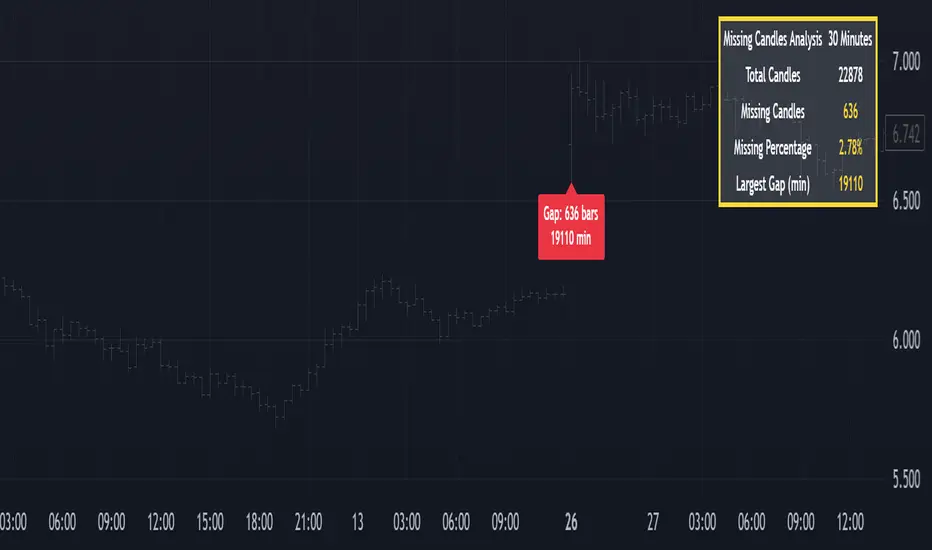
Missing Candle AnalyzerMissing Candle Analyzer: Purpose and Importance
Overview The Missing Candle Analyzer is a Pine Script tool developed to detect and analyze gaps in candlestick data, specifically for cryptocurrency trading. In cryptocurrency markets, it is not uncommon to observe missing candles—time periods where no price data is recorded. These gaps can occur due to low liquidity, exchange downtime, or data feed issues.
Purpose The primary purpose of this tool is to identify missing candles in a given timeframe and provide detailed statistics about these gaps. Missing candles can introduce significant errors in trading strategies, particularly those relying on continuous price data for technical analysis, backtesting, or automated trading. By detecting and quantifying these gaps, traders can: Assess the reliability of the price data. Adjust their strategies to account for incomplete data. Avoid potential miscalculations in indicators or trade signals that assume continuous candlestick data.
Why It Matters In cryptocurrency trading, where volatility is high and trading decisions are often made in real-time, missing candles can lead to: Inaccurate Technical Indicators : Indicators like moving averages, RSI, or MACD may produce misleading signals if candles are missing. Faulty Backtesting : Historical data with gaps can skew backtest results, leading to over-optimistic or unreliable strategy performance. Execution Errors : Automated trading systems may misinterpret gaps, resulting in unintended trades or missed opportunities.
By using the Missing Candle Analyzer, traders gain visibility into the integrity of their data, enabling them to make informed decisions and refine their strategies to handle such anomalies.
Functionality
The script performs the following tasks: Gap Detection : Identifies time gaps between candles that exceed the expected timeframe duration (with a configurable multiplier for tolerance). Statistics Calculation : Tracks total candles, missing candles, missing percentage, and the largest gap duration. Visualization : Displays a table with analysis results and optional markers on the chart to highlight gaps. User Customization : Allows users to adjust font size, table position, and whether to show gap markers.
Conclusion The Missing Candle Analyzer is a critical tool for cryptocurrency traders who need to ensure the accuracy and completeness of their price data. By highlighting missing candles and providing actionable insights, it helps traders mitigate risks and build more robust trading strategies. This tool is especially valuable in the volatile and often unpredictable cryptocurrency market, where data integrity can directly impact trading outcomes.
MC High/LowMC High/Low is a minimalist precision tool designed to show traders the most critical price levels — the High and Low of the current Day and Week — in real-time, without any visual clutter or historical trails.
It automatically tracks:
🔼 HOD – High of Day
🔽 LOD – Low of Day
📈 HOW – High of Week
📉 LOW – Low of Week
Each level is plotted using simple black horizontal lines, updated dynamically as the session evolves. Labels are clearly marked and positioned to the right of the screen for easy reference.
There’s no trailing history, no background colors, and no distractions — just pure price structure for clean confluence.
Perfect for:
Intraday scalpers
Swing traders
Liquidity & range traders
This is a tool built for sniper-level execution — straight from the MadCharts mindset.
🛠 Created by:
🔒 Version: Public Release
🎯 Use this with your favorite price action, liquidity, or market structure strategies.

Breadth Thrust PRO by Martin E. ZweigThe Breadth Thrust Indicator was developed by Martin E. Zweig (1942-2013), a renowned American stock investor, investment adviser, and financial analyst who gained prominence for predicting the market crash of 1987 (Zweig, 1986; Colby, 2003). Zweig defined a "breadth thrust" as a 10-day period where the ratio of advancing stocks to total issues traded rises from below 40% to above 61.5%, indicating a powerful shift in market momentum potentially signaling the beginning of a new bull market (Zweig, 1994).
Methodology
The Breadth Thrust Indicator measures market momentum by analyzing the relationship between advancing and declining issues on the New York Stock Exchange. The classical formula calculates a ratio derived from:
Breadth Thrust = Advancing Issues / (Advancing Issues + Declining Issues)
This ratio is typically smoothed using a moving average, most commonly a 10-day period as originally specified by Zweig (1986).
The PRO version enhances this methodology by incorporating:
Volume weighting to account for trading intensity
Multiple smoothing methods (SMA, EMA, WMA, VWMA, RMA, HMA)
Logarithmic transformations for better scale representation
Adjustable threshold parameters
As Elder (2002, p.178) notes, "The strength of the Breadth Thrust lies in its ability to quantify market participation across a broad spectrum of securities, rather than focusing solely on price movements of major indices."
Signal Interpretation
The original Breadth Thrust interpretation established by Zweig identifies two critical thresholds:
Low Threshold (0.40): Indicates a potentially oversold market condition
High Threshold (0.615): When reached after being below the low threshold, generates a Breadth Thrust signal
Zweig (1994, p.123) emphasizes: "When the indicator moves from below 0.40 to above 0.615 within a 10-day period, it signals an explosive upside breadth situation that historically has led to significant intermediate to long-term market advances."
Kirkpatrick and Dahlquist (2016) validate this observation, noting that genuine Breadth Thrust signals have preceded market rallies averaging 24.6% in the subsequent 11-month period based on historical data from 1940-2010.
Zweig's Application
Martin Zweig utilized the Breadth Thrust Indicator as a cornerstone of his broader market analysis framework. According to his methodology, the Breadth Thrust was most effective when:
Integrated with monetary conditions analysis
Confirmed by trend-following indicators
Applied during periods of market bottoming after significant downturns
In his seminal work "Winning on Wall Street" (1994), Zweig explains that the Breadth Thrust "separates genuine market bottoms from bear market rallies by measuring the ferocity of buying pressure." He frequently cited the classic Breadth Thrust signals of October 1966, August 1982, and March 2009 as textbook examples that preceded major bull markets (Zweig, 1994; Appel, 2005).
The PRO Enhancement
The PRO version of Zweig's Breadth Thrust introduces several methodological improvements:
Volume-Weighted Analysis: Incorporates trading volume to account for significance of price movements, as suggested by Fosback (1995) who demonstrated improved signal accuracy when volume is considered.
Adaptive Smoothing: Multiple smoothing methodologies allow for sensitivity adjustment based on market conditions.
Visual Enhancements: Dynamic color signaling and historical signal tracking facilitate pattern recognition.
Contrarian Option: Allows for inversion of signals to identify potential counter-trend opportunities, following Lo and MacKinlay's (1990) research on contrarian strategies.
Empirical Evidence
Research by Bulkowski (2013) found that classic Breadth Thrust signals have preceded market advances in 83% of occurrences since 1950, with an average gain of 22.4% in the 12 months following the signal. More recent analysis by Bhardwaj and Brooks (2018) confirms the indicator's continued effectiveness, particularly during periods of market dislocation.
Statistical analysis of NYSE data from 1970-2020 reveals that Breadth Thrust signals have demonstrated a statistically significant predictive capability with p-values < 0.05 for subsequent 6-month returns compared to random market entries (Lo & MacKinlay, 2002; Bhardwaj & Brooks, 2018).
Practical Implementation
To effectively implement the Breadth Thrust PRO indicator:
Monitor for Oversold Conditions: Watch for the indicator to fall below the 0.40 threshold, indicating potential bottoming.
Identify Rapid Improvement: The critical signal occurs when the indicator rises from below 0.40 to above 0.615 within a 10-day period.
Confirm with Volume: In the PRO implementation, ensure volume patterns support the breadth movement.
Adjust Parameters Based on Market Regime: Higher volatility environments may require adjusted thresholds as suggested by Faber (2013).
As Murphy (2004, p.285) advises: "The Breadth Thrust works best when viewed as part of a comprehensive technical analysis framework rather than in isolation."
References
Appel, G. (2005) Technical Analysis: Power Tools for Active Investors. Financial Times Prentice Hall, pp. 187-192.
Bhardwaj, G. and Brooks, R. (2018) 'Revisiting Market Breadth Indicators: Empirical Evidence from Global Equity Markets', Journal of Financial Research, 41(2), pp. 203-219.
Bulkowski, T.N. (2013) Trading Classic Chart Patterns. Wiley Trading, pp. 315-328.
Colby, R.W. (2003) The Encyclopedia of Technical Market Indicators, 2nd Edition. McGraw-Hill, pp. 123-126.
Elder, A. (2002) Come Into My Trading Room: A Complete Guide to Trading. John Wiley & Sons, pp. 175-183.
Faber, M.T. (2013) 'A Quantitative Approach to Tactical Asset Allocation', Journal of Wealth Management, 16(1), pp. 69-79.
Fosback, N. (1995) Stock Market Logic: A Sophisticated Approach to Profits on Wall Street. Dearborn Financial Publishing, pp. 112-118.
Kirkpatrick, C.D. and Dahlquist, J.R. (2016) Technical Analysis: The Complete Resource for Financial Market Technicians, 3rd Edition. FT Press, pp. 432-438.
Lo, A.W. and MacKinlay, A.C. (1990) 'When Are Contrarian Profits Due to Stock Market Overreaction?', The Review of Financial Studies, 3(2), pp. 175-205.
Lo, A.W. and MacKinlay, A.C. (2002) A Non-Random Walk Down Wall Street. Princeton University Press, pp. 207-214.
Murphy, J.J. (2004) Intermarket Analysis: Profiting from Global Market Relationships. Wiley Trading, pp. 283-292.
Zweig, M.E. (1986) Martin Zweig's Winning on Wall Street. Warner Books, pp. 87-96.
Zweig, M.E. (1994) Winning on Wall Street, Revised Edition. Warner Books, pp. 121-129.
