Volume Profile Delta & DOM @MaxMaserati 2.0Volume Profile Delta & DOM @Maxserati 2.0- Real Order Flow Analysis
What this indicator actually does!!!
Most volume indicators just show you total volume - which honestly doesn't tell you much. This one breaks down WHO is driving that volume. Big difference between 1000 shares of balanced buying/selling versus 800 buy + 200 sell. This tool shows you exactly that breakdown at every price level.
Trading without this kind of data means you're basically trading blind. Price action is important, but without knowing if smart money is buying or selling, you're mostly guessing. This gives you the same view that institutional traders have.
The main components
**DOM Display**: Shows real-time order flow with separate columns for buying and selling volume at each price level. You can toggle any column on/off depending on what you actually use.
**Volume Delta**: This is the key part - it shows net buying pressure (buy volume minus sell volume) at each price. When you see heavy buying at a support level, that's usually a good sign. When you see heavy selling at resistance, different story.
**Understanding the key columns:**
- **VPS (Volume Profile Sell)**: Shows selling volume (bid volume) at each price level - how much selling pressure exists
- **VPB (Volume Profile Buy)**: Shows buying volume (ask volume) at each price level - how much buying pressure exists
- **VPD (Volume Profile Delta)**: The difference between VPB and VPS (buy volume minus sell volume) - this tells you who's winning the battle at each price
**Time & Sales**: Live trade data with timestamps. There are filters so you can ignore the small retail trades and focus on the size that actually moves markets.
**Recent Activity**: Tracks momentum by showing cumulative buying/selling above and below current price. Useful for seeing if institutions are accumulating or distributing.
Why volume analysis works
Professional traders don't just look at price. They look at volume because volume precedes price movement. When smart money starts accumulating a position, you'll see it in the volume before you see it in price.
Think about it - if a stock is at $100 and someone wants to buy 100,000 shares, they can't just market buy it all at once without moving the price. They'll spread it out, but you can still see the accumulation pattern if you know where to look.
Real trading applications
**For day trading**: This works well for timing entries. If you see price breaking a level but volume delta is negative, that's usually a fake breakout. If volume confirms the move, much higher probability trade.
**For swing positions**: Great for finding accumulation zones. When you see consistent buying volume at certain levels over multiple days, institutions are likely building positions there.
**Risk management**: Volume shifts often happen before price reversals. If you're long and suddenly see heavy selling volume while price is still going up, that's a good exit signal.
Multi-market setup
Works on stocks, futures, forex, and crypto. The indicator automatically detects what type of market you're trading and adjusts accordingly. For forex it uses tick volume since real volume isn't available. For crypto it handles the decimal precision properly.
Customization options
You can show or hide any column depending on your trading style. If you're just scalping, maybe you only need price and delta. If you're doing deeper analysis, turn on all the columns.
There's color customization since everyone has their preferences, and text sizing because not everyone trades on huge monitors.
The indicator has both real-time and backtesting modes. Real-time for live trading, backtesting for developing strategies with historical volume data.
Learning curve
Fair warning - this isn't a simple moving average. There's a learning curve to reading order flow properly. Start by watching how volume patterns develop around known support and resistance levels.
Pay attention to volume divergences. If price makes a new high but volume delta is weaker, that's often a warning sign. If price breaks down but there's no real selling volume, it might be a false breakdown.
Performance notes
This processes a lot of data in real-time, so disable any columns you don't actually use. The more features you enable, the more processing power it needs.
Works best on lower timeframes (1-15 minutes) where you can see the tick-by-tick order flow. Still useful on higher timeframes but less granular.
## Bottom line
If you're serious about trading and want to see what institutional money is doing instead of just guessing from price action alone, this will help. It's not magic - you still need to understand market structure and have a trading plan. But it gives you information that most retail traders don't have access to.
The goal is to stop trading against smart money and start trading with them. Volume tells you where they're active.
---
*Works on all markets. Real volume for stocks/futures, tick volume for forex. Compatible with TradingView's replay feature for backtesting.*
Educational

Timeframe Resistance Evaluation And Detection - CoffeeKillerTREAD - Timeframe Resistance Evaluation And Detection Guide
🔔 Important Technical Limitation 🔔
**This indicator does NOT fetch true higher timeframe data.** Instead, it simulates higher timeframe levels by aggregating data from your current chart timeframe. This means:
- Results will vary depending on what chart timeframe you're viewing
- Levels may not match actual higher timeframe candle highs/lows
- You might miss important wicks or gaps that occurred between chart timeframe bars
- **Always verify levels against actual higher timeframe charts before trading**
Welcome traders! This guide will walk you through the TREAD (Timeframe Resistance Evaluation And Detection) indicator, a multi-timeframe analysis tool developed by CoffeeKiller that identifies support and resistance confluence across different time periods.(I am 50+ year old trader and always thought I was bad a teaching and explaining so you get a AI guide. I personally use this on the 5 minute chart with the default settings, but to each there own and if you can improve the trend detection methods please DM me. I would like to see the code. Thanks)
Core Components
1. Dual Timeframe Level Tracking
- Short Timeframe Levels: Tracks opening price extremes within shorter periods
- Long Timeframe Levels: Tracks actual high/low extremes within longer periods
- Dynamic Reset Mechanism: Levels reset at the start of each new timeframe period
- Momentum Detection: Identifies when levels change mid-period, indicating active price movement
2. Visual Zone System
- High Zones: Areas between long timeframe highs and short timeframe highs
- Low Zones: Areas between long timeframe lows and short timeframe lows
- Fill Coloring: Dynamic colors based on whether levels are static or actively changing
- Momentum Highlighting: Special colors when levels break during active periods
3. Customizable Display Options
- Multiple Plot Styles: Line, circles, or cross markers
- Flexible Timeframe Selection: Wide range of short and long timeframe combinations
- Color Customization: Separate colors for each level type and momentum state
- Toggle Controls: Show/hide different elements based on trading preference
Main Features
Timeframe Settings
- Short Timeframe Options: 15m, 30m, 1h, 2h, 4h
- Long Timeframe Options: 1h, 2h, 4h, 8h, 12h, 1D, 1W
- Recommended Combinations:
- Scalping: 15m/1h or 30m/2h
- Day Trading: 30m/4h or 1h/4h
- Swing Trading: 4h/1D or 1D/1W
Display Configuration
- Level Visibility: Toggle short/long timeframe levels independently
- Fill Zone Control: Enable/disable colored zones between levels
- Momentum Fills: Special highlighting for actively changing levels
- Line Customization: Width, style, and color options for all elements
Color System
- Short TF High: Default red for resistance levels
- Short TF Low: Default green for support levels
- Long TF High: Transparent red for broader resistance context
- Long TF Low: Transparent green for broader support context
- Momentum Colors: Brighter colors when levels are actively changing
Technical Implementation Details
How Level Tracking Works
The indicator uses a custom tracking function that:
1. Detects Timeframe Periods: Uses `time()` function to identify when new periods begin
2. Tracks Extremes: Monitors highest/lowest values within each period
3. Resets on New Periods: Clears tracking when timeframe periods change
4. Updates Mid-Period: Continues tracking if new extremes are reached
The Timeframe Limitation Explained
`pinescript
// What the indicator does:
short_tf_start = ta.change(time(short_timeframe)) != 0 // Detects 30m period start
= track_highest(open, short_tf_start) // BUT uses chart TF opens!
// What true multi-timeframe would be:
// short_tf_high = request.security(syminfo.tickerid, short_timeframe, high)
`
This means:
- On a 5m chart with 30m/4h settings: Tracks 5m bar opens during 30m and 4h windows
- On a 1m chart with same settings: Tracks 1m bar opens during 30m and 4h windows
- Results will be different between chart timeframes
- May miss important price action that occurred between your chart's bars
Visual Elements
1. Level Lines
- Short TF High: Upper resistance line from shorter timeframe analysis
- Short TF Low: Lower support line from shorter timeframe analysis
- Long TF High: Broader resistance context from longer timeframe
- Long TF Low: Broader support context from longer timeframe
2. Zone Fills
- High Zone: Area between long TF high and short TF high (potential resistance cluster)
- Low Zone: Area between long TF low and short TF low (potential support cluster)
- Regular Fill: Standard transparency when levels are static
- Momentum Fill: Enhanced visibility when levels are actively changing
3. Dynamic Coloring
- Static Periods: Normal colors when levels haven't changed recently
- Active Periods: Momentum colors when levels are being tested/broken
- Confluence Zones: Different intensities based on timeframe alignment
Trading Applications
1. Support/Resistance Trading
- Entry Points: Trade bounces from zone boundaries
- Confluence Areas: Focus on areas where short and long TF levels cluster
- Zone Breaks: Enter on confirmed breaks through entire zones
- Multiple Timeframe Confirmation: Stronger signals when both timeframes align
2. Range Trading
- Zone Boundaries: Use fill zones as range extremes
- Mean Reversion: Trade back toward opposite zone when price reaches extremes
- Breakout Preparation: Watch for momentum color changes indicating potential breakouts
- Risk Management: Place stops outside the opposite zone
3. Trend Following
- Direction Bias: Trade in direction of zone breaks
- Pullback Entries: Enter on pullbacks to broken zones (now support/resistance)
- Momentum Confirmation: Use momentum coloring to confirm trend strength
- Multiple Timeframe Alignment: Strongest trends when both timeframes agree
4. Scalping Applications
- Quick Bounces: Trade rapid moves between zone boundaries
- Momentum Signals: Enter when momentum colors appear
- Short-Term Targets: Use opposite zone as profit target
- Tight Stops: Place stops just outside current zone
Optimization Guide
1. Timeframe Selection
For Different Trading Styles:
- Scalping: 15m/1h - Quick levels, frequent updates
- Day Trading: 30m/4h - Balanced view, good for intraday moves
- Swing Trading: 4h/1D - Longer-term perspective, fewer false signals
- Position Trading: 1D/1W - Major structural levels
2. Chart Timeframe Considerations
**Important**: Your chart timeframe affects results
- Lower Chart TF: More granular level tracking, but may be noisy
- Higher Chart TF: Smoother levels, but may miss important price action
- Recommended: Use chart timeframe 2-4x smaller than short indicator timeframe
3. Display Settings
- Busy Charts: Disable fills, show only key levels
- Clean Analysis: Enable all fills and momentum coloring
- Multi-Monitor Setup: Use different color schemes for easy identification
- Mobile Trading: Increase line width for visibility
Best Practices
1. Level Verification
- Always Cross-Check: Verify levels against actual higher timeframe charts
- Multiple Timeframes: Check 2-3 different chart timeframes for consistency
- Price Action Confirmation: Wait for candlestick confirmation at levels
- Volume Analysis: Combine with volume for stronger confirmation
2. Risk Management
- Stop Placement: Use zones rather than exact prices for stops
- Position Sizing: Reduce size when zones are narrow (higher risk)
- Multiple Targets: Scale out at different zone boundaries
- False Break Protection: Allow for minor zone penetrations
3. Signal Quality Assessment
- Momentum Colors: Higher probability when momentum coloring appears
- Zone Width: Wider zones often provide stronger support/resistance
- Historical Testing: Backtest on your preferred timeframe combinations
- Market Conditions: Adjust sensitivity based on volatility
Advanced Features
1. Momentum Detection System
The indicator tracks when levels change mid-period:
`pinescript
short_high_changed = short_high != short_high and not short_tf_start
`
This identifies:
- Active level testing
- Potential breakout situations
- Increased market volatility
- Trend acceleration points
2. Dynamic Color System
Complex conditional logic determines fill colors:
- Static Zones: Regular transparency for stable levels
- Active Zones: Enhanced colors for changing levels
- Mixed States: Different combinations based on user preferences
- Custom Overrides: User can prioritize certain color schemes
3. Zone Interaction Analysis
- Convergence: When short and long TF levels approach each other
- Divergence: When timeframes show conflicting levels
- Alignment: When both timeframes agree on direction
- Transition: When one timeframe changes while other remains static
Common Issues and Solutions
1. Inconsistent Levels
Problem: Levels look different on various chart timeframes
Solution: Always verify against actual higher timeframe charts
2. Missing Price Action
Problem: Important wicks or gaps not reflected in levels
Solution: Use chart timeframe closer to indicator's short timeframe setting
3. Too Many Signals
Problem: Excessive level changes and momentum alerts
Solution: Increase timeframe settings or reduce chart timeframe granularity
4. Lagging Signals
Problem: Levels seem to update too slowly
Solution: Decrease chart timeframe or use more sensitive timeframe combinations
Recommended Setups
Conservative Approach
- Timeframes: 4h/1D
- Chart: 1h
- Display: Show fills only, no momentum coloring
- Use: Swing trading, position management
Aggressive Approach
- Timeframes: 15m/1h
- Chart: 5m
- Display: All features enabled, momentum highlighting
- Use: Scalping, quick reversal trades
Balanced Approach
- Timeframes: 30m/4h
- Chart: 15m
- Display: Selective fills, momentum on key levels
- Use: Day trading, multi-session analysis
Final Notes
**Remember**: This indicator provides a synthetic view of multi-timeframe levels, not true higher timeframe data. While useful for identifying potential confluence areas, always verify important levels by checking actual higher timeframe charts.
**Best Results When**:
- Combined with actual multi-timeframe analysis
- Used for confluence confirmation rather than primary signals
- Applied with proper risk management
- Verified against price action and volume
**DISCLAIMER**: This indicator and its signals are intended solely for educational and informational purposes. The timeframe limitation means results may not reflect true higher timeframe levels. Always conduct your own analysis and verify levels independently before making trading decisions. Trading involves significant risk of loss.

Consolidation Zones[RanaAlgo]Overview
This indicator helps traders identify price consolidation zones (ranges) and potential breakouts in the market. It is useful for spotting periods of low volatility before significant price movements.
How It Works
Detects Consolidation Zones
Uses the ADX (Average Directional Index) to determine when the market is in a consolidation phase .
When ADX is below the threshold , the indicator marks the start of a consolidation zone.
Draws a semi-transparent box around the price range, adjusting its height as new highs/lows form.
Tracks Breakouts
When price breaks above/below the consolidation box, it signals a potential trend continuation.
Displays breakout arrows/labels (configurable shape & style) when price exits the range.
Visual Features
Boxes highlight consolidation areas (customizable color, border, and style).
Labels show real-time status ("CONSOLIDATING" or "TRENDING").
Breakout signals appear as arrows or shapes (up/down).
Usefulness in Trading
Range Trading: Helps traders identify sideways markets for buying low and selling high.
Breakout Trading: Signals potential trend entries when price exits consolidation.
Trend Confirmation: Low ADX + consolidation box = weak trend; breakout = possible trend start.
Example: If price stays in a blue box (consolidation) and then breaks above with an arrow, it suggests a bullish move.

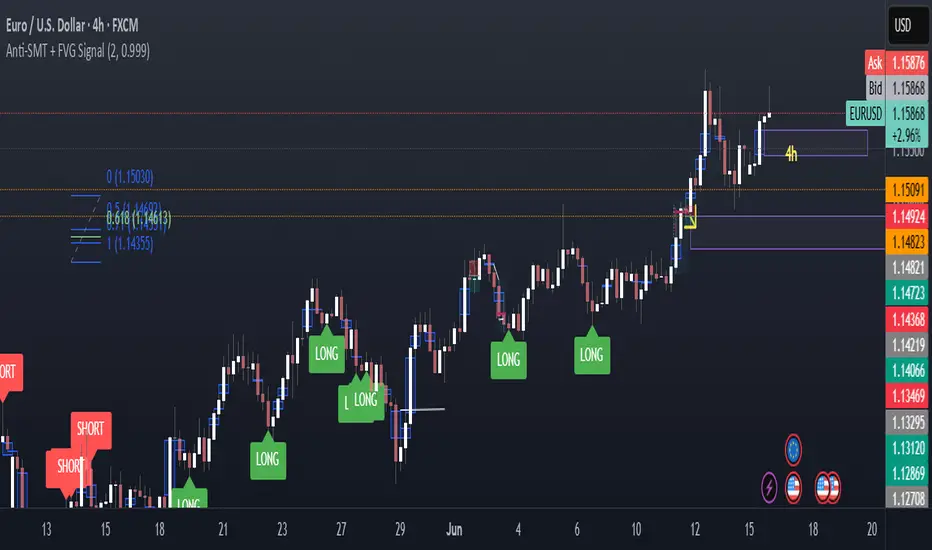
Anti-SMT + FVG SignalMade by Laila
Anti-SMT + FVG Strategy
A contrarian price-action strategy that combines SMT illusion with Fair Value Gap (FVG) confirmation and multiple filters.
Strategy Concept
This strategy challenges traditional SMT divergence logic. Instead of entering trades based on expected SMT divergence between correlated pairs (e.g., EURUSD and DXY), it assumes the divergence is false and will reverse. The concept is to take advantage of these false signals, also known as "SMT illusions."
To confirm the setup, the strategy integrates Fair Value Gaps (FVGs), which are price imbalances left unfilled between candle 1 and 3.
Anti-SMT Logic
Short Entry:
EURUSD makes a new high (Candle 1)
DXY does not make a new low
Long Entry:
EURUSD makes a new low (Candle 1)
DXY does not make a new high
This divergence is considered false, and the strategy expects a reversal.
Fair Value Gap (FVG) Confirmation
A trade is only triggered if the price touches a Fair Value Gap during:
Candle 1 (the candle that forms the SMT illusion), or
Candle 2 (entry confirmation)
This helps avoid low-quality setups and increases entry precision.
Additional Filters
To improve robustness and prevent overfitting, the strategy includes:
EMA Trend Filter:
Long entries are allowed only if price is above the 50 EMA
Short entries are allowed only if price is below the 50 EMA
Time Filter:
Trades are only permitted between 08:00 and 18:00 UTC
Cooldown Filter:
A minimum of 10 candles between trades is required to prevent overtrading
Strategy Parameters and Defaults
Optimized for EURUSD on the 4-hour (4H) timeframe
Includes realistic commission and slippage
Uses conservative position sizing (e.g., 1% per trade)
Backtesting over hundreds of trades shows approximately 57% win rate under default conditions
These results are historical and do not guarantee future performance
Purpose and Value
This strategy offers a structured and logical approach to contrarian trading by:
Introducing the concept of false SMT divergence
Using price inefficiencies (FVGs) as confirmation
Filtering trades with realistic and widely accepted conditions
Encouraging quality over quantity through strict entry rules
It is not a simple mashup but a well-defined trading system that blends institutional concepts in a usable framework.
Candle Range Detector by TradeTech AnalysisCandle Range Detector by TradeTech Analysis
This advanced indicator identifies and visualizes price compression zones based on inside bar formations, then tracks how price behaves around those zones — offering valuable insights into liquidity sweeps, range expansions, and trap/mitigation behavior.
The script builds upon the foundational concept of range-based price action, commonly used by institutional traders, and adds automation, mitigation tracking, and sweep detection to map how price reacts around these critical ranges.
🔍 How It Works:
• Range Formation: A new range is detected when the current candle forms entirely within the high and low of the previous candle (i.e., an inside bar). This behavior often indicates price compression and potential breakout zones.
• Range Extension: Once a range is confirmed, the script projects upper and lower boundaries (using either a percentage-based multiplier or Fibonacci log extension), providing context for expected breakout zones.
• Mitigation Tracking: The script continuously monitors whether price breaks above or below the projected extensions, marking that range as mitigated — useful for confirming whether liquidity was absorbed.
• Sweep Detection: If price re-visits a mitigated zone and shows signs of a liquidity sweep (via wick + close behavior), the indicator triggers visual sweep labels and optional alerts.
🧠 Optional Visual Enhancements:
• Highlight range-forming candles with light blue background (toggle on/off)
• Midpoint dotted line for symmetry analysis
• Labels for “Range High” and “Range Low” for visual clarity
• Dynamic box drawing that adapts upon mitigation or continuation
⚙️ Customizable Features:
• Choose between Normal and Fibonacci-based detection modes
• Toggle visibility of range boxes, extension lines, and sweep markers
• Configure sweep alerts, mitigation window size, and visual transparency
⸻
🧪 Use Cases
• Identify consolidation zones before major price moves
• Confirm liquidity sweeps for entry/exit traps
• Visualize and test mitigation behavior of past zones
• Combine with Order Flow or Volume Profile tools to enhance context
⸻
⚠️ This is a fully original implementation that goes beyond classical inside-bar scanners by incorporating mitigation, extension projection, and liquidity sweeps — making it a powerful tool for intraday, swing, and even Smart Money-based trading setups.

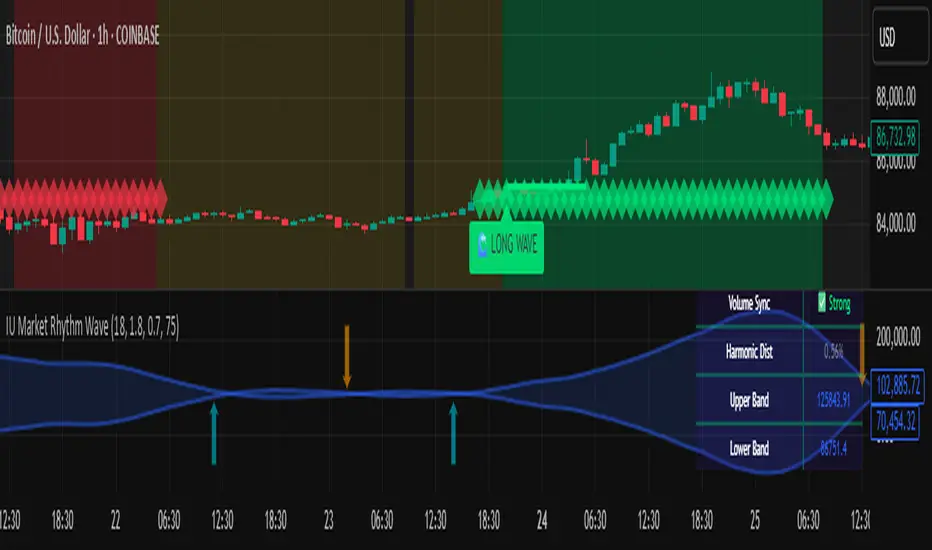
IU Market Rhythm WaveDESCRIPTION:
The IU Market Rhythm Wave is a multi-dimensional indicator designed to reveal the underlying rhythm and energy of the market. By analyzing price momentum, harmonic oscillations, volume behavior, and market breadth, it helps traders identify high-quality long and short wave signals. It also visualizes rhythm bands, wave strength zones, and harmonic levels to provide comprehensive context for decision-making.
This tool is best used on trending instruments where rhythm cycles and volume patterns create clear wave-based opportunities.
USER INPUTS:
Rhythm Cycle Length
Controls the main lookback period used to calculate price waves, harmonic oscillation, volume rhythm, and breath. A longer cycle smooths signals, while a shorter cycle makes them more responsive. Recommended range: 8 to 35.
Wave Signal Strength
Multiplies the standard deviation of rhythm to define dynamic breakout thresholds. A higher value results in fewer but stronger signals, filtering out minor fluctuations.
Harmonic Filter
Applies a sensitivity filter to the harmonic mean and standard deviation. It helps eliminate weak or noisy signals and ensures rhythm-based signals align with harmonic structure.
Show Wave Energy Zones
Toggles background color shading based on current rhythm conditions. Greenish zones indicate strong upward rhythm, red for strong downward rhythm, yellow for positive bias, and gray for weak or neutral zones.
Show Rhythm Bands
Enables the display of upper and lower rhythm bands derived from ATR and rhythm volatility. These bands act as dynamic price envelopes and potential support/resistance zones.
Wave Zone Opacity
Adjusts the transparency of background energy zones, allowing users to control how prominent these zones appear on the chart. Range: 60 to 90 for optimal visibility.
INDICATOR LOGIC:
The indicator combines multiple rhythmic components into a composite rhythm score:
1. Price Wave – Based on momentum (rate of price change) smoothed by a moving average.
2. Harmonic Oscillation – Measures how far price has deviated from a central harmonic average (HLC3).
3. Volume Rhythm – Uses volume’s deviation from its mean, standardized by its volatility.
4. Market Breath – Captures range expansion and closing strength relative to range.
These elements form the Raw Rhythm, which is further smoothed to produce the Market Rhythm. When the rhythm exceeds statistically calculated thresholds and other conditions like volume confirmation and harmonic proximity are met, wave signals are triggered.
Harmonic Fibonacci levels (0.236, 0.382, 0.618, 0.764) are also calculated every rhythm cycle to identify nearby structural price zones. Signals occurring near these levels are considered more reliable.
The Rhythm Bands use ATR and rhythm strength to define dynamic boundaries above and below price. Visual zones and arrows mark rhythm shifts and highlight the underlying energy of the market.
WHY IT IS UNIQUE:
This indicator goes beyond traditional oscillators or volume indicators by blending multiple market dimensions into one rhythmic framework. It adapts to volatility, applies harmonic structure awareness, and filters signals based on real-time market conditions. It offers:
* A unique rhythm-based view of price, volume, and volatility
* Dynamic, adaptive signal generation and zone coloring
* Visual analytics and contextual data in a summary table
* Signal filtering using harmonic alignment and market breath
Its real-time responsiveness and multi-layered logic make it suitable for intraday, swing, and positional traders.
HOW USER CAN BENEFIT FROM IT:
* Spot high-conviction long or short entries when rhythm, volume, and structure align
* Avoid low-quality trades during weak or noisy rhythm periods
* Use visual wave zones to gauge trend strength and rhythm direction
* Monitor harmonic proximity to enter or exit near key structural levels
* Apply rhythm bands for dynamic stop-loss and target setting
* Use rhythm direction arrows and analytics table to gain deeper market insight
DISCLAIMER:
This indicator is created for educational and informational purposes only. It does not constitute financial advice or a recommendation to buy or sell any asset. All trading involves risk, and users should conduct their own analysis or consult with a qualified financial advisor before making any trading decisions. The creator is not responsible for any losses incurred through the use of this tool. Use at your own discretion.
TASC 2025.07 Laguerre Filters█ OVERVIEW
This script implements the Laguerre filter and oscillator described by John F. Ehlers in the article "A Tool For Trend Trading, Laguerre Filters" from the July 2025 edition of TASC's Traders' Tips . The new Laguerre filter utilizes the UltimateSmoother filter in place of an exponential moving average (EMA) in its calculation, offering improved responsiveness and reduced lag.
█ CONCEPTS
As Ehlers explains in his article, the Laguerre filter is a form of transversal filter . A transversal filter calculates an output signal using a tapped delay line . It creates multiple delayed versions of an input signal, applies weight to each delay, and then calculates their sum to generate the filtered result.
The Laguerre filter's structure relies on Laguerre polynomials — solutions to a differential equation solved by Edmond Laguerre in the 1800s. When Ehlers analyzed the formula for these polynomials on discrete systems (e.g., financial time series), he found that the first term's expression corresponds to an EMA response, and all subsequent terms correspond to an all-pass response. In contrast to other filter types, an all-pass filter produces phase shift (i.e., delay) in an input signal's components without affecting its amplitude.
Ehlers observed that these characteristics of Laguerre polynomials make them suitable for use in a transversal filter structure, and thus the Laguerre filter was born. However, he notes that EMAs are not great filters in general. As such, to improve on the Laguerre filter's design, Ehlers modified it by replacing the EMA term with his UltimateSmoother filter. The resulting Laguerre filter has significantly reduced lag, achieving a tighter response to market fluctuations while maintaining smoothness. Ehlers suggests that traders can analyze crossings between the UltimateSmoother and this Laguerre filter, or those between two Laguerre filters of different order, for helpful buy and sell signals.
In addition to the Laguerre filter, Ehlers derived a smooth, low-lag oscillator based on the difference between the first and second terms in the modified filter structure, scaled by the root mean square (RMS). The resulting oscillator provides an alternative filtered representation of market data, which can help traders identify swing and mean-reversion signals.
█ USAGE
This indicator calculates both the Laguerre filter and the Laguerre oscillator described in Ehlers' article. It displays the Laguerre filter on the main chart pane and the oscillator in a separate pane.
Users can control the behavior of the filter and oscillator with the inputs in the "Settings/Inputs" tab:
The "Period" input defines the critical period of the UltimateSmoother used in the Laguerre filter and oscillator calculations. Its default value is 30.
The "Gamma" input determines the weighting behavior of the Laguerre filter and oscillator. It accepts a positive value between 0 and 1. Use a lower value for quicker responsiveness to market changes, and a higher value for trends. The default value is 0.5.
The "RMS length" input determines the length of the RMS calculation for oscillator normalization. The default value is 100 bars.

Adaptive Normalized Global Liquidity OscillatorAdaptive Normalized Global Liquidity Oscillator
A dynamic, non-repainting oscillator built on real central bank balance sheet data. This tool visualizes global liquidity shifts by aggregating monetary asset flows from the world’s most influential central banks.
🔍 What This Script Does:
Aggregates Global Liquidity:
Includes Federal Reserve (FED) assets and subtracts liabilities like the Treasury General Account (TGA) and Reverse Repo Facility (RRP), combined with asset positions from the ECB, BOJ, PBC, BOE, and over 10 other central banks. All data is normalized into USD using FX rates.
Adaptive Normalization:
Optimizes the lookback period dynamically based on rate-of-change stability—no fixed lengths, enabling adaptation across macro conditions.
Self-Optimizing Weighting:
Applies inverse standard deviation to balance raw liquidity, smoothed momentum (HMA), and standardized deviation from the mean.
Percentile-Ranked Highlights:
Liquidity readings are ranked relative to history—extremes are visually emphasized using gradient color and adaptive transparency.
Non-Repainting Design:
Data is anchored with bar index awareness and offset techniques, ensuring no forward-looking bias. What you see is what was known at that time.
⚠️ Important Interpretation Note:
This is not a zero-centered oscillator like RSI or MACD. The signal line does not represent neutrality at zero.
Instead, a dynamic baseline is calculated using a rolling mean of scaled liquidity.
0 is irrelevant on its own—true directional signals come from crosses above or below this adaptive baseline.
Even negative values may signal strength if they are rising above the moving average of past liquidity conditions.
✅ What to Watch For:
Crossover Above Dynamic Baseline:
Indicates liquidity is expanding relative to recent conditions—supports a risk-on interpretation.
Crossover Below Dynamic Baseline:
Suggests deteriorating liquidity conditions—may align with risk-off shifts.
Percentile Extremes:
Readings near the top or bottom historical percentiles can act as contrarian or confirmation signals, depending on momentum.
⚙️ How It Works:
Bounded Normalization:
The final oscillator is passed through a tanh function, keeping values within and reducing distortion.
Adaptive Transparency:
The strength of deviations dynamically adjusts plot intensity—visually highlighting stronger liquidity shifts.
Fully Customizable:
Toggle which banks are included, adjust dynamic optimization ranges, and control visual display options for plot and background layers.
🧠 How to Use:
Trend Confirmation:
Sustained rises in the oscillator above baseline suggest underlying monetary support for asset prices.
Macro Turning Points:
Reversals or divergences, especially near OB/OS zones, can foreshadow broader risk regime changes.
Visual Context:
Use the dynamic baseline to see if liquidity is supportive or suppressive relative to its own adaptive history.
📌 Disclaimer:
This indicator is for educational and informational purposes only. It does not constitute financial advice. Past performance is not indicative of future results. Always consult a qualified financial advisor before making trading or investment decisions.

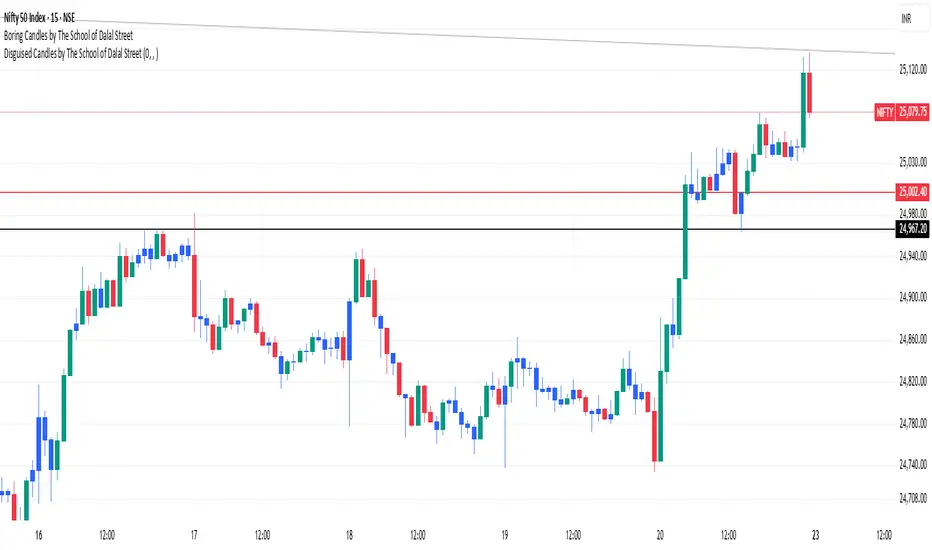
Boring Candles by The School of Dalal StreetThis indicator highlights the "boring" candles. These are candles where the body is less than 50% in length as compared to the high and low length. This allows us to quickly find the lower timeframe demand/supply without switching the chart timeframe. The use case is to quickly find our targets based on lower time frames.
LiquidEdge Original1️⃣ Why Most Traders Miss Key Market Turning Points
Most traders (you) struggle to identify true market pivots THE REAL TOP and BOTTOMS where reversals begin.
❌ You enter too early or too late because price alone doesn’t give enough confirmation
❌ You follow price blindly, unaware of the volume pressure building underneath
❌ You get caught in sideways markets, not realizing they’re often accumulation or distribution zones
❌ You can’t tell if momentum is building or fading, which leads to low confidence and inconsistent results
👉 LiquidEdge helps solve this by tracking volume momentum through a modified MFI slope and scoring system. It highlights potential pivots with real context, so you can see where smart money might be entering or exiting before price makes it obvious.
2️⃣ What LiquidEdge Actually Does and How
LiquidEdge helps solve common trading problems by adding structure and clarity to volume analysis.
✅ It builds on the classic Money Flow Index (MFI), but instead of just showing overbought/oversold levels, it calculates the slope of MFI to track real-time changes in volume momentum
✅ Each setup is scored based on a combination of factors: divergence strength, trend alignment using EMA, and whether the signal occurs inside a liquidity zone
✅ Hidden accumulation or distribution is revealed when volume pressure increases or fades while price remains flat or moves slightly, a sign of smart money positioning
✅ Divergences are only flagged when they occur near pivot zones and align with overall trend conditions, helping reduce false signals
✅ Potential pivots are identified when multiple factors overlap such as a liquidity zone breach, volume slope shift, and valid divergence which often signals entry or exit points for institutional players
👉 The result is a structured interpretation of price and volume flow, helping traders read momentum shifts and potential reversals more clearly in both trending and ranging markets.
3️⃣ What Makes LiquidEdge Different
LiquidEdge is built on top of the classic Money Flow Index (MFI), but adds structure that transforms it from a basic momentum tool into a decision-support system.
Instead of simply showing highs and lows, it scores each potential setup based on:
✅ The steepness and direction of the MFI slope (used to measure volume pressure)
✅ Whether the setup aligns with the broader trend using an EMA filter (default: 200 EMA)
✅ Whether the signal appears inside predefined liquidity zones (MFI above 80 or below 20)
👉 This scoring system reduces noise and helps you focus only on high-probability setups.
👉 It also checks volume pressure across multiple timeframes using MFI slope on 5M, 15M, 1H, 4H, and Daily charts. This reveals whether short-term moves are backed by longer-term volume momentum.
Color changes in the line and histogram are not decorative they reflect real shifts in volume pressure. Every visual cue is linked to live market logic.
What Makes It Stand Out
👉 Setup Scoring That Makes Sense
Each setup is scored by combining:
Signal strength (MFI slope intensity and stability)
Trend direction (via customizable EMA)
Liquidity zone relevance (MFI range filtering)
This structured scoring means you spend less time second-guessing and more time reading clean signals.
👉 Flow That Follows Real Momentum
The slope of the MFI tracks whether volume pressure is rising or falling:
🟢 Green = increasing inflow (buying pressure)
🔴 Red = increasing outflow (selling pressure)
👉 Multi-Timeframe Volume Context
LiquidEdge calculates flow direction independently on each major timeframe. You’ll know if short-term setups are confirmed by higher timeframe volume or going against it.
👉 Smart Divergence Filtering
Unlike simple divergence tools that compare price highs/lows directly, LiquidEdge filters divergences based on:
Local pivot zones (defined by lookback periods)
Trend confirmation (to eliminate countertrend noise)
4️⃣ How LiquidEdge Works (Under the Hood)
LiquidEdge tracks directional momentum using the slope of the Money Flow Index (MFI) giving you a real-time read on buying and selling pressure.
When the slope rises, it means buyers are stepping in and volume is supporting the move.
When it falls, sellers are taking control and volume outflow is increasing.
This slope acts like a pressure gauge for the market, helping you spot when a trend has strength or when it's starting to fade.
💡 Quick Comparison
RSI = momentum from price
MFI = momentum from price + volume
LiquidEdge takes it one step further by calculating the rate of change (slope) in MFI. That’s where the pressure signal comes from not just value, but directional flow.
Core Calculations (Simplified)
Typical Price = (High + Low + Close) ÷ 3
Raw Money Flow = Typical Price × Volume
MFI = 100 −
MFI ranges from 0 to 100.
High = strong buying volume
Low = growing selling pressure
LiquidEdge then calculates the slope of this MFI over time to track volume momentum dynamically.
Divergence Engine
LiquidEdge detects divergence by comparing price pivots with the direction of MFI slope.
❌ If price makes a higher high but MFI slope turns down, it’s a bearish divergence
✅ If price makes a lower low but MFI slope rises, it’s a bullish divergence
Divergences are only confirmed when they occur:
Near local pivot zones (defined by configurable lookback windows)
And, optionally, in alignment with the broader trend using an EMA filter
This filtering helps reduce false positives and keeps you focused on clean setups.
Structured Confidence Scoring
Each signal is visually scored based on:
➡️ Whether a valid divergence is detected
➡️ Whether the signal occurs inside a liquidity zone (MFI > 80 or < 20)
➡️ Whether the setup aligns with the overall trend direction (EMA filter)
More confluence = higher confidence
The scoring system helps prioritize setups that meet multiple criteria, not just one.
Liquidity Zones
Above 80: Signals possible buying exhaustion 👉 risk of reversal
Below 20: Indicates potential selling exhaustion 👉 watch for a bounce
Zones are shaded directly on the chart to highlight pressure extremes in real time.
Price + Volume Fusion
LiquidEdge blends price action with volume pressure using MFI slope and histogram behavior. It doesn’t just show you where price is moving. it shows whether the move is backed by real volume.
This lets you see:
Whether volume is confirming or fading behind a move
If a reversal is building even before price confirms it
Visual Feedback That Speaks Clearly
🟢 Green slope = increasing buying pressure
🔴 Red slope = increasing selling pressure
5️⃣ When Price Is Flat but LiquidEdge Moves: Volume Tells the Truth
One of the most useful things LiquidEdge can do is reveal pressure shifts when price looks neutral.
If price is moving sideways but the MFI slope or histogram rises, it may suggest that buying pressure is quietly increasing possibly pointing to early accumulation.
If price stays flat while the volume slope or histogram drops, this could indicate distribution, where sellers are exiting without moving the market noticeably.
These changes don’t guarantee a breakout or breakdown, but they often precede key moves especially when combined with other confluences like trend alignment or liquidity zones.
👉 LiquidEdge helps spot these setups by measuring volume momentum shifts beneath price action.
It doesn’t predict the future, but it gives you additional context to evaluate what may be developing before it’s visible on price alone.
6️⃣ Multi-Timeframe Flow Table
LiquidEdge includes a real-time table that tracks volume pressure across multiple timeframes including 5-minute, 15-minute, 1-hour, 4-hour, and daily charts.
Each row reflects the direction of the MFI slope on that timeframe, indicating whether volume pressure is increasing (inflow) or decreasing (outflow).
🟢 A rising slope suggests that buying momentum is building
🔴 A falling slope suggests selling pressure may be increasing
👉 This lets traders quickly assess whether short-term setups are aligned with higher timeframe volume trends a useful layer of confirmation for both intraday and swing strategies.
Rather than flipping between charts, the table gives you a snapshot of flow strength across the board, helping you stay focused on opportunities that align with broader market pressure.
7️⃣ Timeframes & Assets
Where LiquidEdge Works Best:
✅ Crypto: Supports major coins and high-volume altcoins (BTC, ETH, Top 100)
✅ Stocks: Effective on large-cap and mid-cap equities with consistent volume
✅ Futures: Tested on instruments like NQ, MNQ, ES, and MES
✅ Any liquid market where volume data is reliable and stable
For best results, use LiquidEdge on assets with consistent trading volume. It’s not recommended for ultra-low volume crypto pairs or micro-cap stocks, where irregular volume can distort signals.
Recommended Timeframes:
👉 Intraday trading: Works well on 3-minute, 5-minute, 15-minute, and 1-hour charts
👉 Swing trading: Performs reliably on 4-hour, daily, and weekly charts
👉 Ultra short-term (1-minute or less): Not recommended due to high noise and low reliability
LiquidEdge adapts to various trading styles from scalping short-term momentum shifts to analyzing broader volume trends across swing and positional setups. The key is choosing assets and timeframes with reliable volume flow for the tool to work effectively.
8️⃣ Common Mistakes to Avoid When Using LiquidEdge
❌ Using It in Isolation
LiquidEdge offers valuable context, but it’s not designed to function as a standalone trading system. Always combine it with key tools such as trendlines, support/resistance zones, chart structure, or fundamental data. The more supporting evidence you have, the stronger your analysis becomes.
❌ Relying on a Single Indicator
No indicator, including LiquidEdge, can account for every market condition. It’s important to use it alongside other forms of confirmation to avoid making decisions based on limited data.
❌ Misinterpreting Divergences as Reversals
A divergence between price and volume pressure doesn't always signal the end of a trend. If the broader direction remains strong (based on EMAs or higher timeframe volume flow), a divergence could reflect temporary consolidation rather than reversal.
❌ Ignoring Trend Alignment and Confidence Scoring
LiquidEdge includes confidence scoring to help validate signals. Disregarding this structure can lead to reacting to weak or out-of-context divergences, especially in choppy or low-volume environments.
❌ Using It on Second-Based or Tick Charts
Very low timeframes introduce too much noise, which can distort volume slope and divergence signals. For intraday analysis, start with 3-minute charts or higher. For swing trading, use 4H and up for clearer, more reliable structure.
9️⃣ LiquidEdge Settings Overview
A quick breakdown of what you can customize in the indicator and how each option affects what you see:
➡️ LiquidEdge Length
Controls how sensitive the indicator is to changes in volume pressure (via MFI slope).
Shorter values = faster response, more frequent signals
Longer values = smoother output, less noise
👉 Default: 14
➡️ EMA Trend Filter
Determines overall trend direction based on EMA slope. Used to filter out signals that go against the broader move.
Helps reduce countertrend entries
Adjustable to suit your strategy
👉 Recommended: 200 EMA
➡️ Pivot Lookback (Left & Right)
Defines how many bars the system looks back and forward to identify swing highs/lows for divergence detection.
Narrow: more responsive but can be noisy
Wide: slower but more stable pivot zones
👉 Default: 5 left / 5 right
➡️ Histogram Toggle
Enables a visual histogram showing how volume pressure deviates from its recent average.
Useful for spotting shifts in flow intensity
👉 Optional for added visual detail
➡️ Liquidity Zones
Highlights potential exhaustion zones based on MFI value:
Above 80 = potential distribution (buying pressure peaking)
Below 20 = possible accumulation (selling pressure fading)
👉 Zones are fully customizable (color, opacity, background)
➡️ Custom Threshold Zones
Set your own upper/lower boundaries for liquidity extremes helpful when adapting to different markets or asset classes.
👉 Especially useful outside of crypto/forex
➡️ Show LiquidEdge Line
Toggle the main MFI slope line. When turned off, liquidity zones and levels also disappear.
👉 Use if you prefer to focus only on histogram/divergences
➡️ Style Settings
Customize line colors, histogram appearance, and background shading
👉 Helps tailor visuals to your chart layout
➡️ Simplified Mode
Removes all colors and replaces visuals with a clean, grayscale output.
👉 Ideal for minimalist or distraction-free charting
➡️ Signal Score Label
Displays the confidence score of the current setup, based on:
Divergence presence
Liquidity zone positioning
Trend alignment (EMA)
👉 Tooltip explains how the score is calculated
➡️ Divergence Labels
Shows “Bullish” or “Bearish” labels at divergence points.
Optional Filters based on trend if EMA filter is active
➡️ Multi-Timeframe Flow Table
Shows directional flow (based on MFI slope) across: 5M, 15M, 1H, 4H, 1D
Color-coded (faded green/red) for clarity
👉 Table position is customizable on your chart
➡️ Alerts
Get notified when any of these conditions are met:
✅ Bullish or bearish divergence detected
✅ Price enters high/low liquidity zones
✅ Signal score reaches a defined value
➡️ Visibility Settings
Control which timeframes display the LiquidEdge indicator
👉 Best used on 3-minute and above
⚠️ Not recommended on ultra-low or second-based charts due to noise
🔟 Q&A – What Traders Usually Ask
➡️ Can this help reduce bad trades?
To a degree, yes. LiquidEdge is built to highlight areas where price may react, based on volume pressure, liquidity zones, and divergence patterns. It can offer clarity in sideways or messy markets, helping traders avoid impulsive or poorly timed entries.
That said, it’s not predictive or guaranteed. It works best when used with broader context including structure, support/resistance, trend, and volume-based confluence.
👉 Reminder: LiquidEdge is not a signal tool. It’s a decision-support framework designed to help you assess potential shifts, not replace judgment or trading rules.
➡️ Is this just another flashy signal tool?
No. LiquidEdge doesn’t give buy/sell alerts. Instead, it visualizes volume shifts using MFI slope, divergence filtering, and trend-based scoring. It’s built to help you understand why price action may be changing not just react to a one-dimensional signal.
You’re seeing how volume pressure evolves across timeframes, which gives added context to what’s unfolding in the market.
➡️ How do I know this isn’t just another overhyped tool?
LiquidEdge is based on real trading logic: volume pressure (via MFI slope), price behavior, and divergence within trend and liquidity zones. It was developed and tested by traders, not packaged by marketers.
No performance is guaranteed. It’s designed to support your decisions not promise results.
➡️ Will this work with my trading style?
If you trade any market with volume crypto, stocks, or futures LiquidEdge can add value.
✔️ Scalpers: Best from 3-minute and up
✔️ Swing traders: Works well on 4H, Daily, Weekly
✔️ Investors: Weekly charts show pressure buildup over time
⚠️ Avoid ultra-low timeframes (under 1M) or illiquid markets, as noise and irregular data can reduce reliability.
➡️ Can I trust the signals?
These are not buy/sell signals. LiquidEdge offers confidence-weighted insights based on:
✔️ Valid divergence
✔️ Zone positioning (above 80 / below 20)
✔️ Optional trend alignment (via EMA)
Each setup is scored visually to reflect how much confluence exists. You can combine that information with structure, price action, or your existing tools to evaluate opportunities.
👉 Think of LiquidEdge as a decision filter not a trigger.
It’s meant to slow down impulsive trades and help you make more context-aware decisions.
1️⃣1️⃣ Limitations – Know When It’s Less Effective
LiquidEdge performs best in stable, high-volume markets where volume data is consistent and structure is visible.
It’s not recommended for:
❌ Low-volume tokens
❌ Micro-cap or penny stocks
❌ Newly listed assets with limited trading history
These types of markets often show inconsistent or erratic volume behavior, making it difficult for LiquidEdge to accurately assess pressure or identify reliable divergences.
⚠️ During major news events or sudden volatility spikes, volume and price behavior can become disconnected or extreme. This may distort MFI slope calculations and reduce the accuracy of divergence or confidence scoring.
LiquidEdge is built to read structured volume flow. When market conditions become highly erratic or unpredictable, it's best to:
Wait for structure to return
Use it alongside other filters for additional confirmation
This isn't a flaw it's simply the nature of tools that rely on consistency in price and volume data.
1️⃣2️⃣ Real Chart Examples – See It in Action
Now that you’ve seen how LiquidEdge works, here are real-world chart examples from various asset classes
including:
✅ Crypto
✅ Stocks
✅ Futures
✅ Commodities
These examples demonstrate how LiquidEdge behaves under different conditions, and how both the line (MFI slope) and histogram (volume deviation) can be used to interpret market flow.
In each walkthrough, you’ll see:
How the histogram can highlight potential momentum shifts
When the slope line provides stronger directional clarity
Examples of possible hidden accumulation or distribution (before price responds)
What to watch out for such as weak volume, false divergences, or conflicting flow signals
👉 These are real examples based on live market data not theoretical setups. They’re meant to help you recognize how LiquidEdge reacts across multiple styles and timeframes.
Let’s walk through each one and break down the logic step by step, so you can understand how to evaluate setups using structure, volume behavior, and context-driven confluence.
Example: Microsoft (MSFT) – Possible Hidden Accumulation
In this setup, price was moving lower within a short-term downtrend. However, LiquidEdge began showing signs of increasing inflow pressure a common characteristic of accumulation, where volume rises even as price declines.
This divergence suggested that buying interest may have been increasing behind the scenes, despite weak price action on the surface.
Step-by-step breakdown:
👉 Trend context – Price was clearly trending down at the time
👉 Volume divergence – Price made lower lows, but LiquidEdge slope was rising = possible bullish divergence
👉 Accumulation clue – The rising slope, despite falling price, pointed to volume inflow often seen during quiet accumulation
👉 Histogram support – Volume pressure (via the histogram) also increased, confirming the flow shift
👉 Anticipating reaction – When liquidity pressure rises ahead of price, it can signal potential reversal interest
In this case, price later moved sharply higher. While not guaranteed, setups like this illustrate how divergence + volume flow may help highlight early accumulation zones before price confirms the shift.
Same Setup – Focusing on the Histogram Alone
Here, we’re revisiting the Microsoft setup but this time focusing only on the histogram, without the MFI slope line.
Even without the directional slope, the histogram showed rising volume pressure while price continued to drift lower. This visual pattern may indicate that buying interest was quietly increasing, despite weak price movement.
This is where the histogram adds value: it helps visualize the intensity of volume flow over time. When volume pressure builds during a flat or declining price phase, it can be consistent with accumulation where larger participants begin positioning before the market responds.
This example highlights how the histogram alone can provide early insight into underlying volume dynamics even before price shifts noticeably.
Filtering with EMA and why It Matters
Here, we revisit the Microsoft example this time applying the 200 EMA filter, which helps define the broader trend.
Once enabled, LiquidEdge automatically removed any bullish or bearish divergence signals that were against the prevailing trend. This helped reduce noise and focus only on setups aligned with market structure.
✅ The EMA acts as a contextual filter.
For example, if a bullish divergence occurs during a confirmed downtrend, LiquidEdge suppresses that signal helping you avoid setups that may carry more risk.
This filtering mechanism is especially useful in fast or choppy markets, where not all divergences are meaningful.
Want More Flexibility? Adjust the Filter
If you're a more aggressive trader or prefer shorter-term signals, you can reduce the EMA length (e.g., to 150, 50, or even 25). This increases the number of setups shown but also raises the importance of additional context and confirmation.
⚠️ Keep in mind:
❌ More signals doesn’t always mean better outcomes
✅ Focused, context-aware signals tend to be more consistent with broader market pressure
If you’re using this in combination with strategies like options trading, this filter can help refine your entry zones especially when paired with other structure or volatility tools.
Distribution Example and Bitcoin Setup Before a Major Drop
In this example, Bitcoin was trading in a relatively tight range while price continued to push upward. However, LiquidEdge began to show signs of volume outflow, which can suggest potential distribution.
Here’s what was observed:
🔴 Price was moving up inside a horizontal range
🔴 LiquidEdge’s slope indicated declining volume pressure
🔴 Several bearish divergence signals appeared during this consolidation phase
🔴 The histogram also showed weakening flow, even before price broke down
These overlapping signals pointed to a possible distribution phase, where buying momentum was fading despite price still holding up.
🧭 Signs to Watch for in Potential Distribution:
1️⃣ Price holding flat or rising slightly within a tight range
2️⃣ Volume pressure (line or histogram) sloping downward
3️⃣ Repeated bearish divergences forming at the highs
4️⃣ Lack of follow-through on bullish setups signaling hesitation in demand
While LiquidEdge can’t predict market outcomes, this scenario demonstrates how a combination of divergence, outflow, and failure to break out may serve as early warnings that momentum is shifting beneath the surface.
Failed Auction Example – Volume Shift Before a Breakdown
In this example, price attempted to break out above a recent high, creating the appearance of a bullish continuation. However, LiquidEdge began to signal volume outflow, despite the upward price move a potential sign of a failed auction.
Here’s what was observed:
👉 Price made a new high, appearing to break resistance
👉 LiquidEdge slope and histogram both showed declining liquidity
👉 The indicator formed lower lows, even as price pushed higher
👉 This divergence suggested that volume wasn’t supporting the breakout
Shortly after, price reversed and returned back inside the range which is a common characteristic of failed auction behavior.
🧭 Spotting a Potential Failed Auction with LiquidEdge:
1️⃣ Price breaks above a recent high
2️⃣ Volume flow (line + histogram) shows outflow, not inflow
3️⃣ Indicator forms lower lows while price makes higher highs (bearish divergence)
4️⃣ Market reverts back into the previous range without follow-through
While no tool can predict outcomes, this setup demonstrated how volume pressure and divergence can help identify moments where a breakout may lack real support offering context before price action confirms the shift.
Reading the Histogram - Spotting Pressure Fades
In this example, price was still rising but the LiquidEdge histogram showed falling volume pressure. This type of divergence between price and volume can serve as a potential early signal that momentum may be fading.
🔻 Histogram levels declined while price continued higher
🔻 This suggested that buying pressure was weakening, even though price hadn’t turned
🔻 Volume flow behavior didn’t support the continuation possibly indicating buyer exhaustion
Just before the peak, the histogram nearly reached its lower threshold, despite price still being near its highs.
💡 How to Read It:
When volume pressure (shown by the histogram) starts to fade while price is still rising, it can indicate that momentum is weakening. This may precede a pullback or reversal particularly if other factors like divergence or zone exhaustion are also present.
Conversely, rising histogram values during a price drop may suggest potential accumulation.
👉 Use the histogram as a volume intensity gauge, not a signal on its own especially when evaluating whether a move is supported by actual flow, or just price momentum.
The Table – Fast, Visual Multi-Timeframe Flow Insight
The multi-timeframe flow table in LiquidEdge provides a consolidated view of volume momentum across several key timeframes so you don’t need to switch between charts to compare flow strength.
👉 Instead of flipping from 5-minute to 15M, 1H, 4H, and Daily, the table displays flow direction on all of them at a glance.
Example layout:
🔼 Daily: Up
🔽 1H: Down
🔼 15M: Up
🔽 5M: Down
This setup gives you a quick read on whether volume momentum is aligned across multiple timeframes or diverging which can help frame your trade approach.
🧠 Why It’s Useful:
✅ Supports timeframe alignment
If higher timeframes show strong inflow while lower ones are mixed, you may interpret it as a swing-based opportunity. If short timeframes show pressure but higher frames are flat, it might suggest short-term setups with caution.
✅ Improves context awareness
Instead of interpreting a move in isolation, the table helps you assess whether short-term signals are part of a broader shift or going against higher timeframe flow.
💡 Pro Tip: Use the table as a starting point in your analysis. It’s a simple but effective snapshot of current liquidity pressure across the board helping you plan trades with broader context, rather than reacting chart-by-chart.
🔚 Final Thoughts
If you're focused on trading with better clarity and structure, LiquidEdge is designed to help you interpret what’s happening beneath the surface not just follow price movement.
While many tools highlight price alone, LiquidEdge combines volume pressure, divergence filtering, and trend-based context to help identify potential areas of accumulation, distribution, or momentum shifts even before they become obvious on a chart.
👉 This isn’t just another signal tool. It’s a framework to support smarter decision-making:
✔️ One that helps you filter out noise
✔️ One that scores setups using multiple layers of confirmation
✔️ One that brings volume context into every trade idea
Whether you're scalping on a 5-minute chart or managing a longer-term swing trade, LiquidEdge is built to help you stay aligned with volume-driven behavior not just react to price alone.
If you've struggled with late entries, unreliable setups, or second-guessing trades, this tool was designed to bring more structure to your process. It won’t remove all uncertainty but it can help you stay more selective, confident, and intentional.
✅ Trade with clarity
✅ Stay process-driven
✅ Focus on structure, not noise
LiquidEdge is not meant to replace your strategy. It’s here to enhance it.
In this chart, the 200 EMA filter was applied. As a result, only signals that aligned with the dominant trend direction were displayed helping to reduce distractions and focus on setups with stronger context.
💡 Using a higher EMA setting like 200 can reduce the number of signals shown, but may help you focus on higher-conviction opportunities.
That said, every trader is different:
Longer EMAs = fewer signals, but more trend-filtered setups
Shorter EMAs = more signals, faster entries but with potentially more noise
👉 Adjust the filter based on your trading style. Use a 200 EMA for swing trading, or reduce it to 50, 25, or even 5 if you're trading more aggressively or intraday.
LiquidEdge adapts to you not the other way around.
🔁 Adjusting EMA for Your Trading Style
Personal Tip: When trading more aggressively, I often use a 5 EMA filter especially when combining histogram strength with other tools. This increases signal responsiveness and may help highlight short-term flow shifts more quickly.
Below are visual examples that show how different EMA lengths impact the behavior of LiquidEdge:
50 EMA ON
25 EMA ON
5 EMA ON
Lower EMA Example – Gold with the 5 EMA
In this example, the 5 EMA filter was applied to Gold. As expected, more signals were plotted compared to higher EMA settings. The tool became more responsive to rapid shifts in volume momentum, making it more suitable for fast-paced trading environments.
This setting can help traders who prefer early entries but it also introduces more sensitivity, so context and additional confirmation become even more important.
Each setting affects signal frequency and filtering:
Higher EMA → fewer signals, more trend-confirmed setups
Lower EMA → more signals, quicker responses, but with more potential for noise
Choose what fits your approach:
Long-term swing → Stick with 200 EMA
Intraday or scalping → Consider shorter EMAs (50, 25, or 5)
💡 Reminder: EMA filtering is fully adjustable. LiquidEdge doesn’t lock you into one trading style it’s meant to adapt to your process, whether you’re swing trading or scalping short-term moves.
But There’s a Catch…
Using a lower EMA setting (like 5) opens up faster, more frequent signals but it also increases the need for precision and stronger trade management.
❗ More signals = More responsiveness
❗ Faster setups mean quicker decisions
❗ Risk control becomes even more important
💡 Lower Timeframes = More Detail, Less Margin for Error
A short EMA (like 5) can help you:
✅ Identify early momentum shifts
✅ Respond before traditional trend-followers
✅ Highlight short-term divergence and volume changes
But it also comes with tradeoffs:
❌ Greater signal noise
❌ Higher potential for misreads or fakeouts
❌ Requires clear structure and disciplined entries
🚩 Watch Out for Liquidity Grabs
In lower timeframes, a common trap is the liquidity grab where price pushes beyond recent highs or lows, triggers stops, then quickly reverses.
📌 These moves can look like breakouts, but often reverse quickly possibly reflecting institutional order placement or low-liquidity manipulation.
🧭 How to Approach It Smartly
✅ Use structure: Mark support and resistance to frame moves
✅ Confirm volume behavior: Is histogram strength rising or fading?
✅ Avoid chasing: Look for confluence, not just a single signal
✅ Be intentional with stops: Place them with structure in mind to avoid being swept out
NASDAQ Futures Example – Low Timeframe Setups with LiquidEdge
In this example, we look at how LiquidEdge was used to identify both short and long setups on the NASDAQ Futures (NQ) particularly on a low timeframe (5M), where quick decision-making and volume precision matter most.
⚠️ A Note on Futures and Volume
When trading futures, especially on intraday charts, it’s important to separate overnight volume from regular session activity.
🕒 Overnight Volume ≠ Real Volume Context
Overnight price action is informative, but the volume data itself may not reflect true market participation. In LiquidEdge, histogram and pressure calculations emphasize regular session flow helping avoid skewed signals that could come from low-volume overnight moves.
Using the Histogram to Spot Potential Shifts
One of the key cues I use is color transition in the histogram:
🔴 A flip from strong green to red can signal fading buying pressure, sometimes marking the beginning of a potential short setup.
🟢 A shift from red to green may indicate that buyers are returning, suggesting possible accumulation.
These shifts serve as early visual cues of changing pressure especially when confirmed by other tools or context.
🔁 Adding Context with the Line + Structure
After spotting a histogram shift, I look at:
1️⃣ Slope Line – Is it confirming the same directional pressure?
2️⃣ Support/Resistance – Are we near a meaningful zone?
3️⃣ Additional Tools – This includes trendlines, VWAP, EMAs, and overall price structure.
On lower timeframes like 5M, these pieces become even more important. LiquidEdge gives directional insight, but your full setup provides confirmation and execution logic.
⚠️ Disclaimer
LiquidEdge is not a signal tool. It’s a visual representation of market pressure and flow designed to help you make more informed trading and investing decisions. It shows you what’s happening beneath the price action but you are still responsible for your decisions.
Always combine LiquidEdge with your own strategy, research, and supporting tools. That includes trend analysis, support/resistance levels, chart patterns, and fundamentals (like P/E ratios, price-to-sales, debt ratios, etc.).
This tool should never be used alone or treated as financial advice.
Some content may include AI-powered enhancements for clarity or formatting.
Always do your own research. For personal financial guidance, speak with a licensed financial advisor.

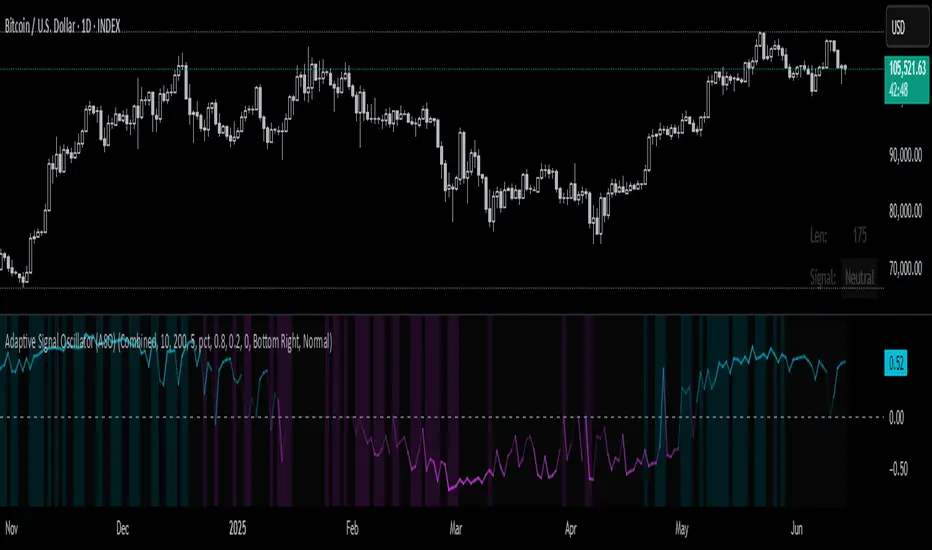
Adaptive Signal Oscillator (ASO)📘 Adaptive Signal Oscillator (ASO)
A fully dynamic, self-calibrating oscillator that adapts to any asset or timeframe by optimizing for real-time signal stability and volatility structure — without relying on static parameters or hardcoded thresholds.
🔍 Overview
The Adaptive Signal Oscillator (ASO) is a next-generation technical analysis tool designed to provide context-aware long/short signals across crypto, equities, or forex markets. Unlike traditional oscillators (RSI, Stochastics, MACD), ASO requires no manual tuning of lookback periods or overbought/oversold zones — it self-optimizes based on current market behavior.
🧠 How It Works
✅ 1. Dynamic Lookback Optimization
ASO evaluates a range of lookback lengths between user-defined minLen and maxLen. For each length, it calculates the standard deviation of returns and finds the one with the least volatility change (i.e., the most stable structure). This length is dynamically assigned as bestLen, recalculated on every bar.
✅ 2. Multi-Layer Signal Composition
Four independent signal layers are computed using bestLen:
RSI Layer: Measures relative price strength via a custom dynamic RSI.
Z-Score Layer: Standardized deviation of price from its mean.
Volatility Layer: Standard deviation of log or percent returns.
Price Position Layer: Current price percentile within the lookback window.
Each of these layers is transformed into a percentile score scaled to the range .
✅ 3. Volatility-Based Weighting
The standard deviation (volatility) of each signal layer is computed. Less volatile layers are weighted more heavily, ensuring the final composite signal prioritizes stable, consistent inputs.
Weights are normalized and combined to form a composite score, representing a dynamically blended, noise-weighted signal across the four layers.
✅ 4. Optional Adaptive Smoothing
A boolean toggle lets users apply smoothing to the final score. The smoothing window scales proportionally to bestLen, preserving adaptiveness even during trend transitions.
✅ 5. Percentile-Based Thresholding
Rather than using arbitrary fixed thresholds, ASO converts the composite score into a ranked percentile. Long/short signals are then generated based on user-defined percentile bands, adapting naturally to each asset’s behavior.
📈 Interpreting ASO
Score > Threshold → Strong long signal (highlighted in aqua).
Score < Threshold → Strong short signal (highlighted in fuchsia).
Crossing h_thresh (e.g., 0) → Neutral-to-bias change; useful for early trend cues.
The background and label update in real time to reflect the current regime and bestLen.
⚙️ Inputs
minLen, maxLen, step: Define the search range for optimal lookback length.
retMethod: Choose between log or percent return calculations.
threshHigh, threshLow: Define signal zones using percentiles.
smooth: Enable dynamic score smoothing.
h_thresh: Midline crossover zone for directional context.
⚠️ Disclaimer
This tool is designed for exploratory and educational purposes only. It does not offer financial advice or trading recommendations. Past performance is not indicative of future results.
Always consult a licensed financial advisor before making investment decisions.
Setup Score OscillatorSetup Score Oscillator – Full Description
🎯 Purpose of the Script
This script is a manual trading setup scoring tool, designed to help traders quantify the quality of a trade setup by combining multiple technical, cyclical, and contextual signals.
Instead of relying on a single indicator, the trader manually selects which signals are present, and the script calculates a total score (0–100%), displayed as an oscillator in a separate panel (like RSI or MACD).
🔧 How it works in practice
1. Manual signal inputs
The script presents a set of checkboxes in the settings, where the trader can enable/disable the following signals:
✅ Confirmed Support/Resistance
✅ Aligned Volume Profile
✅ Favorable Cyclic Timing
✅ Valid Trend Line
✅ Aligned Cyclical Moving Averages
✅ Relevant Fibonacci Level
✅ Classic Volume Signal (spike, dry-up, etc.)
✅ Oscillator confirmation (e.g., divergences)
✅ Extreme Sentiment
✅ Relevant or incoming News
Each selected signal contributes to the total score based on its weight.
2. Scoring system
Each signal has a default weight (e.g., 20% for support/resistance, 15% for cycles, etc.).
Optionally, the trader can enable the “custom weights” checkbox and adjust each signal’s weight directly in the settings.
3. Score visualization
The final score (sum of all active weights) is plotted as an oscillator ranging from 0 to 100%, with dynamic coloring:
Range Color Meaning
0–39% Red No valid setup
40–54% Yellow Watchlist only
55–69% Orange Good setup
70–100% Green Strong setup
Several horizontal threshold lines are displayed:
50% → neutral threshold
40%, 55%, 70% → operational levels
4. Optional background coloring
When the score exceeds 55% or 70%, the oscillator background lightly changes color to highlight stronger setups (non-intrusive).
📌 Practical benefits
Objectifies subjective analysis: each decision becomes a number.
Prevents overtrading: no entries if the score is too low.
Adaptable to any trading style: swing, intraday, positional.
User-friendly: no coding needed – just tick boxes.
Italiano:
Setup Score Oscillator – Descrizione completa
🎯 Obiettivo dello script
Lo script è uno strumento manuale di valutazione dei setup di trading, pensato per aiutare il trader a quantificare la qualità di un'opportunità operativa basandosi su più segnali tecnici, ciclici e contestuali.
Invece di affidarsi a un solo indicatore, il trader seleziona manualmente quali segnali sono presenti, e lo script calcola un punteggio complessivo percentuale (0–100%), rappresentato come oscillatore in una finestra separata (tipo RSI, MACD, ecc.).
🔧 Come funziona operativamente
1. Input manuale dei segnali
Lo script mostra una serie di checkbox nelle impostazioni, dove il trader può attivare o disattivare i seguenti segnali:
✅ Supporto/Resistenza confermata
✅ Volume Profile allineato
✅ Cicli o timing favorevole
✅ Trend line valida
✅ Medie mobili cicliche allineate
✅ Livello di Fibonacci rilevante
✅ Volume classico significativo (spike, dry-up)
✅ Conferme da oscillatori (es. divergenze)
✅ Sentiment estremo (es. euforia o panico)
✅ News importanti imminenti o appena uscite
Ogni casella attiva contribuisce al punteggio totale, con un peso specifico.
2. Sistema di punteggio
Ogni segnale ha un peso predefinito (es. 20% per supporti/resistenze, 15% per cicli, ecc.).
Facoltativamente, il trader può attivare la funzione “Enable custom weights” per personalizzare i pesi di ciascun segnale direttamente da input.
3. Visualizzazione del punteggio
Il punteggio complessivo (somma dei pesi attivati) viene tracciato come oscillatore da 0 a 100%, con colori dinamici:
Range Colore Significato
0–39% Rosso Nessun setup valido
40–54% Giallo Osservazione
55–69% Arancione Setup buono
70–1005 Verde Setup forte
Sono tracciate anche delle linee guida orizzontali a:
50% → soglia neutra
40%, 55%, 70% → soglie operative
4. Colorazione dello sfondo (facoltativa)
Quando il punteggio supera 55% o 70%, lo sfondo dell’oscillatore cambia leggermente colore per evidenziare il segnale (non invasivo).
📌 Vantaggi pratici
Oggettivizza l’analisi soggettiva: ogni decisione manuale si trasforma in un numero.
Evita overtrading: se il punteggio è troppo basso, non si entra.
Adattabile a ogni stile: swing, intraday, position.
Facile da usare anche senza codice: basta spuntare le caselle.
Disguised Candles by The School of Dalal StreetDisguised Candles corrects one of the subtle visual distortions present in normal candlestick charts — the mismatch between the close of one candle and the open of the next.
On many instruments (especially at day/session breaks), the next candle’s open often jumps due to price gaps or data feed behavior. This can make reading the flow of price action harder than necessary.
Disguised Candles fixes this by plotting synthetic candles where the open of each candle is forced to match the close of the previous one — creating a visually continuous flow of price.
Real candles are made fully transparent, so only the "corrected" candles are visible.
This allows traders to:
Visualize price flow as a smooth path
Better spot true directional shifts and trends
Avoid distractions caused by technical gaps that are not meaningful to their strategy
🚀 Pure visual clarity. No noise from false opens.
How it works:
The open of each synthetic candle = close of previous real candle
High, Low, Close remain unchanged
Colors are based on Close vs Corrected Open
Real chart candles are hidden under a transparent overlay
Use this as a clean canvas for trend analysis or as a foundation for building new visual systems.
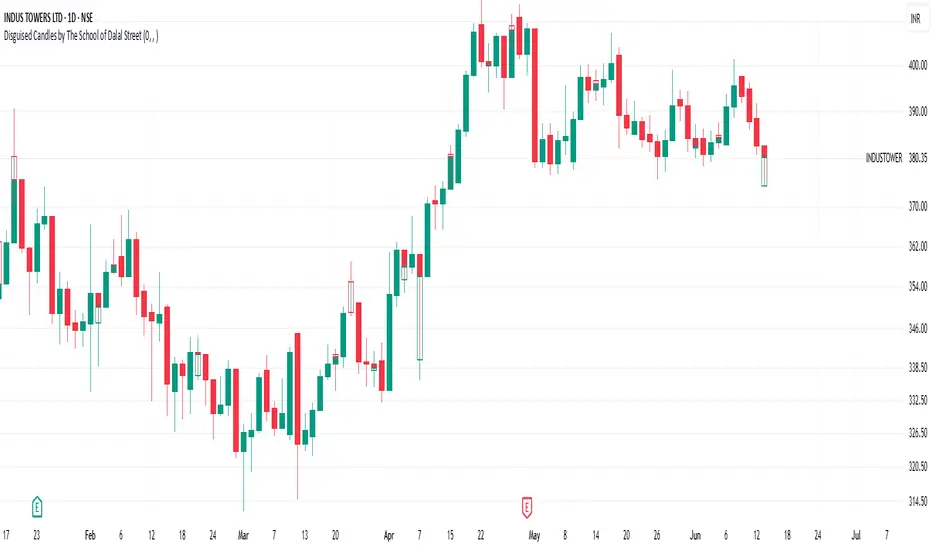
NVT Ratio Z-Score | [DeV]** DISCLAIMER: This indicator is not trend following, so it SHOULD NOT be a buy/sell signal or used as a stand alone indicator to tell you to buy or sell. It's simply giving insight into potential overbought or oversold market conditions, and should be used in conjunction with other market analysis tools to give you an idea of possible market reversals.**
The NVT Ratio Z-Score is a unique on-chain valuation tool that helps users assess whether Bitcoin is potentially overbought or oversold relative to its network fundamentals. This indicator calculates the Network Value to Transactions (NVT) ratio, which compares Bitcoin’s market capitalization (price × circulating supply) to the USD-denominated daily transaction volume on the network. To improve clarity and remove short-term noise, the NVT value is smoothed using a customizable moving average (NVT Smoothing Period). The smoothed value is then normalized using a Z-score over a rolling period (Normalization Lookback Period), allowing for easier comparison of extreme deviations over time. This normalization makes it possible to spot historically high or low valuation zones with consistency.
While the NVT Ratio Z-Score is not a price action or trend-following indicator, it excels as a valuation-based supplemental tool. By using this indicator alongside your existing technical setups—such as momentum oscillators (like RSI or MACD), moving averages, or volume profiles—you can gain a deeper perspective on whether the broader market is operating in an overheated or undervalued state.
Interpretation is straightforward: the lower the Z-score dips into negative territory, the more oversold the market may be, potentially indicating a bottoming process or future upward reversal. Conversely, higher Z-scores suggest the market is becoming overheated or overbought, which can precede pullbacks or broader downtrends. However, it’s crucial to remember: this is not a trend indicator. Overbought conditions don’t guarantee immediate downturns, and oversold conditions don’t guarantee immediate rallies. Markets can remain extended in either direction for prolonged periods.
Use the NVT Ratio Z-Score to contextualize price moves and strengthen conviction when your other tools show signals aligning with extreme valuation zones. This indicator is especially helpful for swing traders, long-term investors, and those analyzing Bitcoin through a macro-on-chain lens.
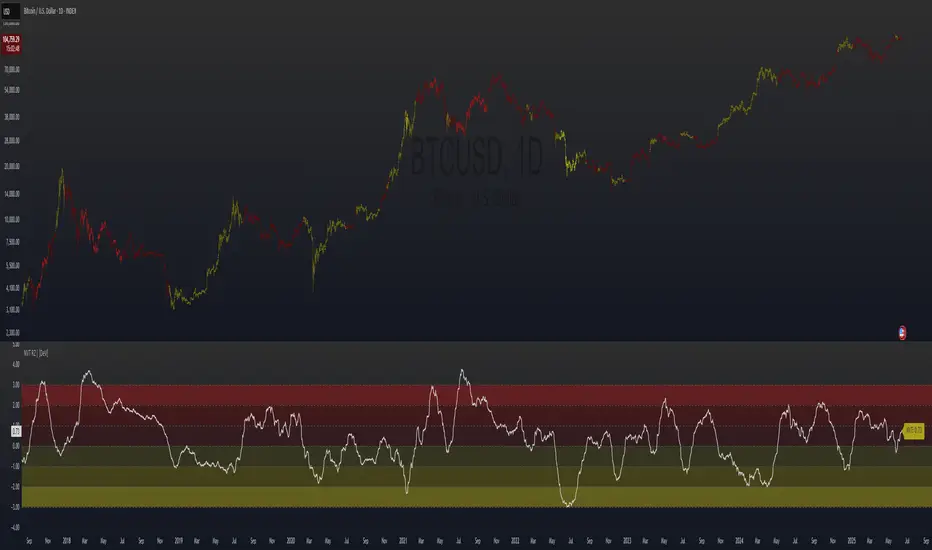
Magnificent 7 OscillatorThe Magnificent 7 Oscillator is a sophisticated momentum-based technical indicator designed to analyze the collective performance of the seven largest technology companies in the U.S. stock market (Apple, Microsoft, Alphabet, Amazon, NVIDIA, Tesla, and Meta). This indicator incorporates established momentum factor research and provides three distinct analytical modes: absolute momentum tracking, equal-weighted market comparison, and relative performance analysis. The tool integrates five different oscillator methodologies and includes advanced breadth analysis capabilities.
Theoretical Foundation
Momentum Factor Research
The indicator's foundation rests on seminal momentum research in financial markets. Jegadeesh and Titman (1993) demonstrated that stocks with strong price performance over 3-12 month periods tend to continue outperforming in subsequent periods¹. This momentum effect was later incorporated into formal factor models by Carhart (1997), who extended the Fama-French three-factor model to include a momentum factor (UMD - Up Minus Down)².
The momentum calculation methodology follows the academic standard:
Momentum(t) = / P(t-n) × 100
Where P(t) is the current price and n is the lookback period.
The focus on the "Magnificent 7" stocks reflects the increasing market concentration observed in recent years. Fama and French (2015) noted that a small number of large-cap stocks can drive significant market movements due to their substantial index weights³. The combined market capitalization of these seven companies often exceeds 25% of the total S&P 500, making their collective momentum a critical market indicator.
Indicator Architecture
Core Components
1. Data Collection and Processing
The indicator employs robust data collection with error handling for missing or invalid security data. Each stock's momentum is calculated independently using the specified lookback period (default: 14 periods).
2. Composite Oscillator Calculation
Following Fama-French factor construction methodology, the indicator offers two weighting schemes:
- Equal Weight: Each active stock receives identical weighting (1/n)
- Market Cap Weight: Reserved for future enhancement
3. Oscillator Transformation Functions
The indicator provides five distinct oscillator types, each with established technical analysis foundations:
a) Momentum Oscillator (Default)
- Pure rate-of-change calculation
- Centered around zero
- Direct implementation of Jegadeesh & Titman methodology
b) RSI (Relative Strength Index)
- Wilder's (1978) relative strength methodology
- Transformed to center around zero for consistency
- Scale: -50 to +50
c) Stochastic Oscillator
- George Lane's %K methodology
- Measures current position within recent range
- Transformed to center around zero
d) Williams %R
- Larry Williams' range-based oscillator
- Inverse stochastic calculation
- Adjusted for zero-centered display
e) CCI (Commodity Channel Index)
- Donald Lambert's mean reversion indicator
- Measures deviation from moving average
- Scaled for optimal visualization
Operational Modes
Mode 1: Magnificent 7 Analysis
Tracks the collective momentum of the seven constituent stocks. This mode is optimal for:
- Technology sector analysis
- Growth stock momentum assessment
- Large-cap performance tracking
Mode 2: S&P 500 Equal Weight Comparison
Analyzes momentum using an equal-weighted S&P 500 reference (typically RSP ETF). This mode provides:
- Broader market momentum context
- Size-neutral market analysis
- Comparison baseline for relative performance
Mode 3: Relative Performance Analysis
Calculates the momentum differential between Magnificent 7 and S&P 500 Equal Weight. This mode enables:
- Sector rotation analysis
- Style factor assessment (Growth vs. Value)
- Relative strength identification
Formula: Relative Performance = MAG7_Momentum - SP500EW_Momentum
Signal Generation and Thresholds
Signal Classification
The indicator generates three signal states:
- Bullish: Oscillator > Upper Threshold (default: +2.0%)
- Bearish: Oscillator < Lower Threshold (default: -2.0%)
- Neutral: Oscillator between thresholds
Relative Performance Signals
In relative performance mode, specialized thresholds apply:
- Outperformance: Relative momentum > +1.0%
- Underperformance: Relative momentum < -1.0%
Alert System
Comprehensive alert conditions include:
- Threshold crossovers (bullish/bearish signals)
- Zero-line crosses (momentum direction changes)
- Relative performance shifts
- Breadth Analysis Component
The indicator incorporates market breadth analysis, calculating the percentage of constituent stocks with positive momentum. This feature provides insights into:
- Strong Breadth (>60%): Broad-based momentum
- Weak Breadth (<40%): Narrow momentum leadership
- Mixed Breadth (40-60%): Neutral momentum distribution
Visual Design and User Interface
Theme-Adaptive Display
The indicator automatically adjusts color schemes for dark and light chart themes, ensuring optimal visibility across different user preferences.
Professional Data Table
A comprehensive data table displays:
- Current oscillator value and percentage
- Active mode and oscillator type
- Signal status and strength
- Component breakdowns (in relative performance mode)
- Breadth percentage
- Active threshold levels
Custom Color Options
Users can override default colors with custom selections for:
- Neutral conditions (default: Material Blue)
- Bullish signals (default: Material Green)
- Bearish signals (default: Material Red)
Practical Applications
Portfolio Management
- Sector Allocation: Use relative performance mode to time technology sector exposure
- Risk Management: Monitor breadth deterioration as early warning signal
- Entry/Exit Timing: Utilize threshold crossovers for position sizing decisions
Market Analysis
- Trend Identification: Zero-line crosses indicate momentum regime changes
- Divergence Analysis: Compare MAG7 performance against broader market
- Volatility Assessment: Oscillator range and frequency provide volatility insights
Strategy Development
- Factor Timing: Implement growth factor timing strategies
- Momentum Strategies: Develop systematic momentum-based approaches
- Risk Parity: Use breadth metrics for risk-adjusted portfolio construction
Configuration Guidelines
Parameter Selection
- Momentum Period (5-100): Shorter periods (5-20) for tactical analysis, longer periods (50-100) for strategic assessment
- Smoothing Period (1-50): Higher values reduce noise but increase lag
- Thresholds: Adjust based on historical volatility and strategy requirements
Timeframe Considerations
- Daily Charts: Optimal for swing trading and medium-term analysis
- Weekly Charts: Suitable for long-term trend analysis
- Intraday Charts: Useful for short-term tactical decisions
Limitations and Considerations
Market Concentration Risk
The indicator's focus on seven stocks creates concentration risk. During periods of significant rotation away from large-cap technology stocks, the indicator may not represent broader market conditions.
Momentum Persistence
While momentum effects are well-documented, they are not permanent. Jegadeesh and Titman (1993) noted momentum reversal effects over longer time horizons (2-5 years).
Correlation Dynamics
During market stress, correlations among the constituent stocks may increase, reducing the diversification benefits and potentially amplifying signal intensity.
Performance Metrics and Backtesting
The indicator includes hidden plots for comprehensive backtesting:
- Individual stock momentum values
- Composite breadth percentage
- S&P 500 Equal Weight momentum
- Relative performance calculations
These metrics enable quantitative strategy development and historical performance analysis.
References
¹Jegadeesh, N., & Titman, S. (1993). Returns to buying winners and selling losers: Implications for stock market efficiency. Journal of Finance, 48(1), 65-91.
Carhart, M. M. (1997). On persistence in mutual fund performance. Journal of Finance, 52(1), 57-82.
Fama, E. F., & French, K. R. (2015). A five-factor asset pricing model. Journal of Financial Economics, 116(1), 1-22.
Wilder, J. W. (1978). New concepts in technical trading systems. Trend Research.

Intraday Volume by Saurabh Maggoinspired by volume indicator by nitin
Key Features
Dynamic Volume Visualization: Features thicker volume bars with color-coded insights—grey for normal volume (0.5x-1.5x baseline), orange for low volume (<0.5x), blue for Intraday Pocket Pivots (IPP), green for high up volume, and red for high down volume.
Snort Signals: Identifies strong moves with green Bull Snorts (below bars) and red Bear Snorts (above bars), triggered by volume exceeding 2.0x the baseline with significant price action.
Highest/Lowest Volume Markers: Blue squares mark the highest volume bar, and a single orange square marks the first lowest volume bar, aiding trend identification.
Enhanced Table Metrics: A 2x3 table displays Trend Strength (TS, green >100%, red <100%), Buy/Sell Signal (BS, green "Buy", red "Sell", grey "Neutral"), and Net Pressure (NP, green >0%, red <0%), offering a comprehensive view of volume and price pressure, reset daily at 9:15 AM IST.

PKSE Buy/Sell Signals Table - Two Columns with VWAPndicator Description: PKSE Buy/Sell Signals Table - Two Columns with VWAP
Overview
The PKSE Buy/Sell Signals Table - Two Columns with VWAP is a robust Pine Script indicator for Pakistan Stock Exchange (PSX) traders. It generates buy and sell signals for 19 PSX stocks based on Simple Moving Average (SMA) crossovers, KSE100 Index trends, and daily Volume Weighted Average Price (VWAP) conditions, displayed in two compact, side-by-side tables optimized for monitor viewing.
Purpose
This indicator helps traders identify high-probability trading opportunities by filtering signals with VWAP to reduce noise, ideal for swing traders, day traders, and investors monitoring PSX stocks.
Key Features
Dual-Table Layout: Displays 19 stocks in two side-by-side tables (10 and 9 stocks) for a monitor-friendly view.
Enhanced Signal Logic: Combines three conditions:
KSE100 Trend: Signals depend on the KSE100 Index being above/below its SMA.
Stock SMA: Signals based on stock price crossing or being above/below its SMA.
Daily VWAP Filter: Buy signals require the stock to be above its daily VWAP; sell signals require it to be below.
Signal Types:
Buy NOW: Stock crosses above SMA, KSE100 is bullish, stock above VWAP.
Buy: Stock above SMA, KSE100 bullish, stock above VWAP.
Sell NOW: Stock crosses below SMA, KSE100 bearish, stock below VWAP.
Sell: Stock below SMA, KSE100 bearish, stock below VWAP.
Neutral: Conditions not fully met.
No Data: Invalid or missing data.
Customizable Inputs:
SMA length (default: 5).
Timeframe (5, 15, 30, 60 minutes, daily; default: 30 minutes).
KSE100 symbol (default: "PSX:KSE100").
Color-Coded Signals: Green (Buy), lime (Buy NOW), red (Sell), orange (Sell NOW), gray (No Data), white (Neutral).
Stock Coverage: Tracks 19 PSX stocks (e.g., FFC, OGDC, HUBC, UBL, MCB, LUCK).
Error Handling: Handles invalid symbols or missing data with "No Data" signals.
How It Works
Fetches KSE100 and stock prices in the selected timeframe (default: 30 minutes) and daily VWAP.
Calculates SMA for KSE100 and stocks; evaluates VWAP position.
Generates signals when all conditions align, based on the 30-minute candle close.
Displays results in two tables (Stock, Signal, Timeframe) at top-right and top-center.
Usage Instructions
Add the indicator to your TradingView chart.
Configure inputs: SMA length, timeframe, KSE100 symbol.
View tables showing signals for 19 PSX stocks.
Use signals to guide trading, combining with other analysis.
Adjust table positions if needed (modify position.top_right/top_center).
Ideal For
PSX traders using SMA and VWAP strategies.
Swing/day traders seeking filtered signals.
Investors tracking KSE100 and stock trends.
Limitations
Limited to 19 stocks due to TradingView’s 40-security-call limit.
Signals rely on SMA, VWAP, and KSE100; combine with other analysis.
Hardcoded stock list; contact the author for customizations.
Notes
Verify stock symbols are valid on your TradingView platform.
Best on 1920x1080+ resolution. Adjust chart scaling if tables overlap.
Published on June 12, 2025, at 11:50 AM PKT.
Disclaimer
Trading carries risk. This indicator is for informational purposes only and not financial advice. Conduct your own research before trading.

DVPOOverview
The DVPO (Dynamic Volume Profile Oscillator) Strategy is a comprehensive and highly customizable trading tool designed for precision and control. It is built around a unique, volume-driven oscillator that identifies potential market entries by analyzing the relationship between price, volume, and volatility.
This strategy is not just another signal generator; it's a complete framework that includes dynamic entry logic, adaptive risk management (ATR Stop Loss and R:R-based Take Profit), and a powerful dashboard of 10+ optional confirmation filters to help you tailor the strategy to your specific instrument, timeframe, and trading style.
The Core Concept: The DVPO Oscillator
The heart of this strategy is the DVPO oscillator. Unlike standard oscillators like RSI or Stochastics, the DVPO's primary goal is to quantify how far the current price has deviated from its recent volume-weighted "fair value."
Here’s how it works conceptually:
Micro Volume Profile: The indicator first analyzes a recent period of bars (defined by Lookback Period) to build a mini-profile of price and volume.
Volume-Weighted Mean: From this profile, it calculates a volume-weighted average price (VWAP) and the average deviation from that mean. This establishes the central point of value for the recent period.
Deviation Measurement: The oscillator's value is derived from how far the current price is from this calculated mean, scaled by the observed price deviation and a user-defined Sensitivity. A value above the midline suggests the price is trading at a premium, while a value below suggests it's at a discount.
Adaptive Volatility Zones: Instead of using fixed overbought/oversold levels (e.g., 70/30), the DVPO calculates dynamic upper and lower zones using the standard deviation of the oscillator itself. These zones expand and contract based on recent market volatility.
An entry signal is triggered not just when the oscillator is "overbought" or "oversold," but when it breaks out of these adaptive volatility zones, signaling that a statistically significant price movement is underway.
📈 Long Entry Condition : The oscillator crosses above the dynamic upper zone.
📉 Short Entry Condition : The oscillator crosses below the dynamic lower zone.
Integrated Risk & Trade Management
A signal is useless without proper risk management. This strategy has professional-grade risk management built directly into its logic.
Stop Loss (ATR-Based): The Stop Loss is not a fixed percentage. It is calculated using the Average True Range (ATR), allowing it to adapt automatically to the market's current volatility. In volatile periods, the stop will be wider; in quiet periods, it will be tighter.
Take Profit (Risk/Reward Ratio): The Take Profit level is calculated based on a user-defined Risk/Reward Ratio. If you set a ratio of 2.0, the Take Profit target will be placed at twice the distance of the Stop Loss from your entry price.
Dynamic Position Sizing: The strategy can automatically calculate the trade quantity for you. It determines the position size based on your specified Capital Size and the % Risk Per Trade you are willing to accept, ensuring disciplined risk control on every trade.
The Filter Dashboard : Enhance Your Signal Quality
To help reduce false signals and adapt to different market conditions, the strategy includes a comprehensive dashboard of optional confirmation filters. An entry signal will only be executed if it aligns with all the filters you have activated.
Trend & Momentum Filters :
T3, VMA, & VWAP Trend Filters: Utilize a suite of advanced moving averages (T3, Variable Moving Average, and a session-based VWAP) to ensure your trades are aligned with the dominant trend.
ADX Filter: Confirms that the market has sufficient directional strength for a trend-following trade, helping to avoid entries during choppy conditions.
Kaufman Efficiency Filter: Uses the Kaufman Efficiency Ratio to measure market noise. It only allows trades when the market is trending efficiently.
Volume & Market State Filters :
Volume Flow (VFI): A sophisticated volume-based filter that confirms whether volume is supporting the price move.
TDFI (Trader's Dynamic Index): A market state indicator designed to identify when the market is primed for a strong, directional move.
Flat Market Detector: A unique filter that identifies and avoids trading in sideways or ranging markets where trend strategies typically underperform.
Trade Condition Filters :
Min TP / Max SL %: Filter out trades where the risk/reward profile doesn't meet your minimum requirements (e.g., ignore a trade if the ATR-based stop loss is more than 10% away from the price).
Session Filters: Allows you to enable or disable trading on specific days of the week and to set a Cooldown Period (a set number of bars to wait after a trade closes before looking for a new entry).
How To Use This Strategy
Start with the Core: Begin by configuring the DVPO Oscillator settings (Lookback Period, Sensitivity, Zone Width) and your Risk Management parameters (ATR Multiplier, RR Ratio, % Risk Per Trade). These form the foundation of the strategy.
Backtest and Observe: Use TradingView's Strategy Tester to see how the core signals perform on your chosen asset and timeframe.
Layer Filters Intelligently: Enable the confirmation filters one by one and re-run your backtest. Observe how each filter impacts performance (e.g., does the T3 filter increase profitability but reduce the number of trades?). The goal is to find the optimal balance between signal quality and frequency.
Visualize and Analyze: Use the Show Risk/Reward Area option to plot your entry, stop loss, and take profit levels directly on the chart for every trade, providing a clear visual representation of your trade plan.
Disclaimer: This strategy is provided for educational and analytical purposes only. Past performance is not indicative of future results. All trading involves risk, and you should conduct your own thorough backtesting and analysis before deploying any strategy in a live market.

Zigzag Simple [SCL]🟩 OVERVIEW
Draws zigzag lines from pivot Highs to pivot Lows. You can choose between three different ways of calculating pivots:
• True Highs and Lows
• Williams pivots
• Oscillator pivots
🟩 HOW TO USE
This indicator can be used to understand market structure, which is arguably the primary thing you need to be aware of when trading. The zigzag by itself does not display a market structure bias, nor any information about prices of pivots, HH and HL labels, or anything like that. Nevertheless, a simple zigzag is perhaps the easiest and most intuitive way to understand what price is doing.
Choose a pivot style that you like, customise the colours and line style, and enjoy!
🟩 PIVOT TYPES EXPLAINED
True Highs and Lows
This is not an invention of mine (all credit to my humble mentor), but I haven't seen anyone else code them up. A true High is a close below the low of the candle with the highest high. A true Low is a close above the high of a candle with the lowest low. These are solid, price action-based pivots that can sometimes confirm quickly.
Williams pivots
This is how most people calculate pivots. They're simply the highest high for x bars back and x bars forwards. They're the vanilla of pivots IMO: serviceable but not very interesting. They're very convenient to code because there are built-in Pine functions for them: ta.pivothigh and ta.pivotlow . They confirm a predictable number of bars after they happen, which is great for coding but also makes the trader wait for confirmation.
Oscillator pivots
This is a completely different concept, which uses momentum in order to define pivots. For example, when you get a rise in momentum and momentum then drops a configurable amount, it confirms a pivot high, and vice versa for a pivot low. I don't know if anyone else does it –- although some indicators do mark pivots in momentum itself, and plenty do divergences, I wasn't able to find one that specifically marked *pivots in price* because of pivots in momentum 🤷♂️
Anyway, while this approach needs a whole investigation on its own, here we simply plot some pivots in a smoothed RSI. This indicator doesn't plot the actual momentum values -- for a more visual understanding of how this works, refer to the examples in the OscillatorPivots library.
🟩 UNIQUE ADVANTAGES
In contrast to other zigzag indicators available, this one lets you choose between the standard and some more unique methods of generating the zigzags. Additionally, because it's based on libraries, it is relatively easy for programmers to use as a basis for experimentation.
🟩 GEEK STUFF
Although there is considerable practical use for pivot-based zigzags in trading, this script is primarily a demonstration in coding -- specifically the power of libraries!
Most of the script consists of setup, especially defining inputs. The final section sacrifices some readability for conciseness, simply to emphasise how little code you need when the heavy lifting is done by libraries .
The actual calculations and drawing are achieved in just 8 lines.
The equivalent code in the libraries is ~250 lines long.
All libraries used are my own, public and open-source:
• MarketStructure
• DrawZigZag
• OscillatorPivots

Double Bottom Strategy (Long Only, ATR Trailing Stop + Alerts)This script implements a long-only breakout strategy based on the recognition of a Double Bottom price pattern, enhanced with a 50 EMA trend filter and a dynamic ATR-based trailing stop. It is suitable for traders looking to capture reversals in trending markets using a structured pattern-based entry system.
🧠 Key Features:
Double Bottom Detection: Identifies double bottom structures using pivot lows with configurable tolerance.
ATR-Based Trailing Stop: Manages exits using a trailing stop calculated from Average True Range (ATR), dynamically adjusting to market volatility.
EMA Filter (Optional): Filters trades to only go long when price is above the 50 EMA (trend confirmation).
Alerts: Real-time alerts on entry and exit, formatted in JSON for webhook compatibility.
Backtest Range Controls: Customize historical testing period with start and end dates.
✅ Recommended Markets:
Gold (XAUUSD)
S&P 500 (SPX, ES)
Nasdaq (NDX, NQ)
Stocks (Equities)
⚠️ Not recommended for Forex due to differing behavior and noise levels in currency markets.
🛠️ User Guidance:
Tune the pivot period, tolerance, and ATR settings for best performance on your chosen asset.
Backtest thoroughly over your selected date range to assess historical effectiveness.
Use small position sizes initially to test viability in live or simulated environments.
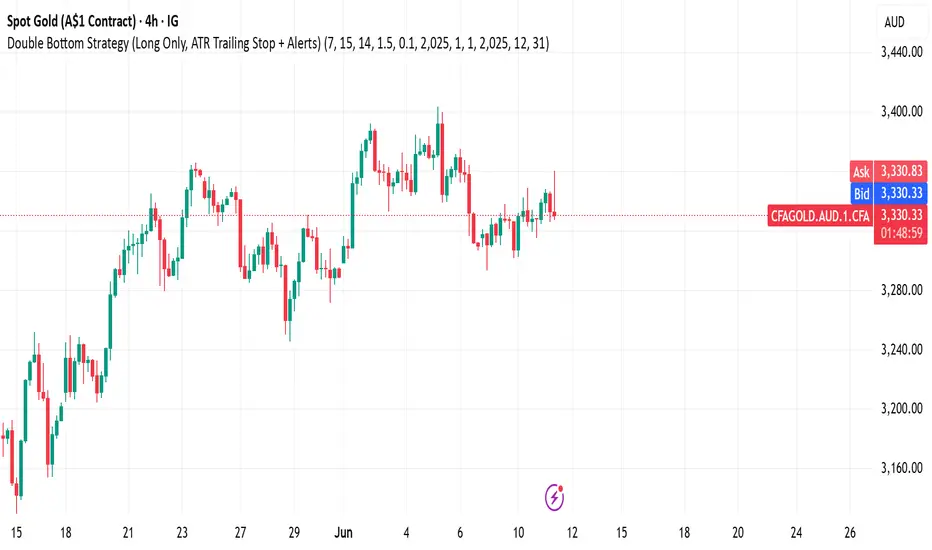
Technical Strength Index (TSI)📘 TSI with Dynamic Bands – Technical Strength Index
The TSI with Dynamic Bands is a multi-factor indicator designed to measure the statistical strength and structure of a trend. It combines several quantitative metrics into a single, normalized score between 0 and 1, allowing traders to assess the technical quality of market moves and detect overbought/oversold conditions with adaptive precision.
🧠 Core Components
This indicator draws from the StatMetrics library, blending:
📈 Trend Persistence: via the Hurst exponent, indicating whether price action is mean-reverting or trending.
📉 Risk-Adjusted Volatility: via the inverted , rewarding smoother, less erratic price movement.
🚀 Momentum Strength: using a combination of directional momentum and Z-score–normalized returns.
These components are normalized and averaged into the TSI line.
🎯 Features
TSI Line: Composite score of trend quality (0 = weak/noise, 1 = strong/structured).
Dynamic Bands: Mean ± 1 standard deviation envelopes provide adaptive context.
Overbought/Oversold Detection: Based on a rolling quantile (e.g. 90th/10th percentile of TSI history).
Signal Strength Bar (optional): Measures how statistically extreme the current TSI value is, helping validate confidence in trade setups.
Dynamic Color Cues: Background and bar gradients help visually identify statistically significant zones.
📈 How to Use
Look for overbought (red background) or oversold (green background) conditions as potential reversal zones.
Confirm trend strength with the optional signal strength bar — stronger values suggest higher signal confidence.
Use the TSI line and context bands to filter out noisy ranges and focus on structured price moves.
⚙️ Inputs
Lookback Period: Controls the smoothing and window size for statistical calculations.
Overbought/Oversold Quantiles: Adjust the thresholds for signal zones.
Plot Signal Strength: Enable or disable the signal confidence bar.
Overlay Signal Strength: Show signal strength in the same panel (compact) or not (cleaner TSI-only view).
🛠 Example Use Cases
Mean reversion traders identifying reversal zones with statistical backing
Momentum/Trend traders confirming structure before entries
Quantitative dashboards or multi-asset screening tools
⚠️ Disclaimer
This script is for educational and informational purposes only. It does not constitute financial advice or a recommendation to buy or sell any financial instrument.
This AI is not a financial advisor; please consult your financial advisor for personalized advice.
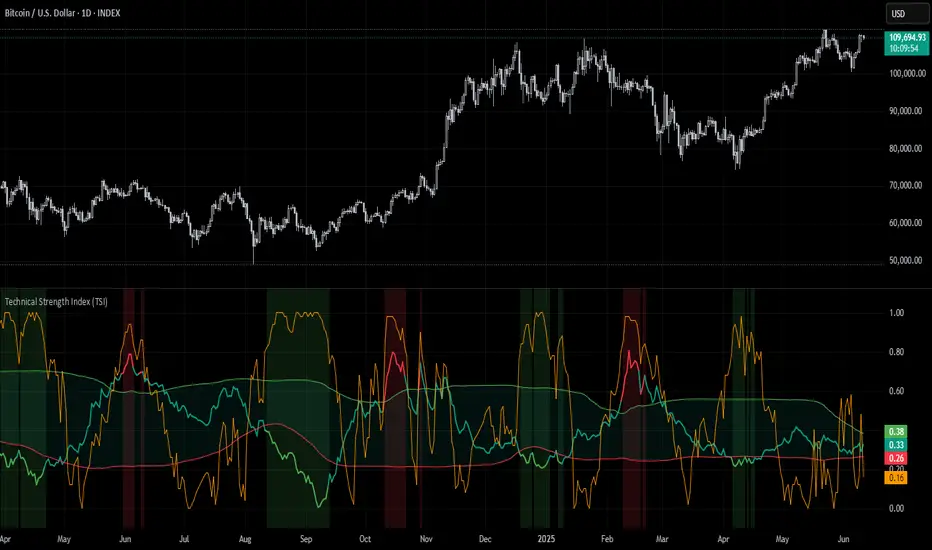
ADR by Saurabh MaggoADR levels for intraday
This Pine Script v5 indicator plots Average Daily Range (ADR) levels on a 5-minute NSE chart, ideal for intraday traders. It marks key price levels (L3+, L3-, L2+, L2-, L1+, L1-) at 9:15 AM IST each day, based on the daily open and a customizable ATR period.
Features:
Configurable Levels: Adjust ATR period (default 5) and multipliers (L3=0.5, L2=0.25, L1=0.125) to set price targets.
Today Only Option: Toggle Show Recent to display only the current day’s levels or all historical levels.
Visual Customization: Choose vibrant colors for each level via settings, with a glow effect
(toggleable, transparency=20) and adjustable circle size (default 2, range 1–5) for enhanced visibility, optimized for dark chart backgrounds.
Clean Design: Single-point plotting at 9:15 AM IST ensures a clutter-free chart, with dynamic points that move with the chart.
Usage: Perfect for NSE intraday trading, this indicator helps identify high-probability price targets. Customize levels, colors, and visuals to suit your strategy.

[GetSparx] Lacuna Pro⚡ Lacuna Pro – Institutional Liquidity Framework
This indicator is a premium Smart Money Concepts (SMC) trading toolkit designed to help traders identify high-probability entry and exit zones by visualizing real-time market inefficiencies. It combines Fair Value Gaps (FVGs), Break of Structure (BOS), Change of Character (CHoCH), and Supply & Demand Zones into a unified, configurable framework.
Unlike many public indicators that simply "overlay concepts", this indicator implements strict internal validation to filter out noise and provide only institutional-grade levels — making it a valuable execution layer for SMC-based strategies.
🧠 What the Script Does – and Why the Combination Matters
This is more than just a combination of known SMC tools — it's a complete workflow assistant:
-FVGs highlight where liquidity is likely resting due to institutional imbalance.
-BOS & CHoCH define structural context: whether the market is trending or shifting.
-Supply & Demand Zones show where institutions are likely to react.
-Each component works together to create a layered confluence system:
-FVG inside a Demand Zone after a Bullish CHoCH → High-probability Long Setup
-Bearish BOS into a Supply Zone + fresh Bearish FVG → High-probability Short Setup
📘 Core Concepts Explained
Fair Value Gap (FVG)
FVGs occur when price moves with strong momentum and leaves a gap between candles — suggesting inefficiency. Bullish FVGs lie below price; bearish ones above. Price often returns to these levels before continuing.
An FVG is detected when a three-candle sequence reveals a price imbalance:
- Bullish : Candle 2’s low is higher than Candle 1’s high
- Bearish : Candle 2’s high is lower than Candle 1’s low
These setups indicate a sudden burst of institutional momentum, often causing price to revisit the gap for rebalancing.
Break of Structure (BOS)
A BOS signals trend continuation when price breaks the previous swing high or low in the direction of the current trend.
The script uses a 3-bar pivot system to detect local swing highs and lows — a swing high forms when the highest candle is flanked by two lower highs on each side (and vice versa for swing lows).
A BOS is confirmed when price closes beyond the most recent swing point in alignment with the current trend direction.
Change of Character (CHoCH)
A CHoCH signals a potential trend reversal by breaking a structure level in the opposite direction of the prevailing trend.
It is detected when price breaks the most recent opposing swing and simultaneously flips the internal trend state.
CHoCH events always take precedence over BOS to avoid conflicting signals.
The internal trend engine ensures that these structural shifts are valid and not caused by random volatility.
Supply & Demand Zones
These zones mark institutional interest and are formed using precise price action rules — not arbitrary support/resistance.
A valid zone begins when a small-bodied base candle (such as a star or doji) appears at a local swing point. This candle must be followed by a strong impulse candle — either a bullish engulfing (for demand) or bearish breakout (for supply).
- Demand Zone : From the base candle's low to the impulse candle's high
- Supply Zone : From the base candle's high to the impulse candle's low
These zones represent likely institutional entries or exits, often acting as magnets or rejection areas. Once price decisively breaks through a zone, it is automatically removed — keeping the chart clean and relevant.
Zone Detection Logic – When a Zone Is Drawn or Skipped
Below are the precise rules used to determine whether a Supply or Demand Zone is valid and shown on the chart
A Supply or Demand Zone is only drawn if all of the following conditions are met:
-A small-bodied base candle forms at a local high or low (body size below threshold)
-The base candle is followed by a strong impulse candle (engulfing or breakout)
-The impulse direction matches the expected context (e.g., bearish impulse from swing high = Supply)
-The candle wicks do not invalidate the structure (e.g., no long opposing wick that retraces the move)
-The zone meets the minimum size threshold based on % or ATR filter
If any of these criteria are not satisfied, the zone is skipped to avoid false or weak levels.
This ensures only clean, institutional-grade Supply & Demand Zones are shown on the chart.
(e.g. small-bodied star + bullish engulfing at swing low = Demand Zone, or bearish breakout at swing high = Supply Zone).
🔍 Core Functionality & Original Features
1. 📉 Fair Value Gaps (FVGs) – Dynamic, Validated, and Clean
Unlike scripts that draw every gap, this script applies strict quality control to ensure only meaningful FVGs appear:
Minimum Threshold Filtering
Filters out small or noisy gaps by requiring each FVG to exceed a % or ATR-based size threshold. Prevents micro-gap clutter on lower timeframes.
Momentum Candle Verification
Requires a strong middle candle (candle 2) between two extremes. Large opposing wicks invalidate the setup.
Partial Fill Adjustment
When price partially fills a gap, the FVG box automatically shrinks to show only the remaining imbalance. If fully filled, the box is removed.
Multi-Timeframe Overlays
View institutional gaps from 15m, 1H, 4H, or Daily overlaid onto any chart for top-down analysis and entry refinement.
2. 🧱 Structural Shifts – BOS & CHoCH
Structural logic is built around pivot detection with real-time trend state awareness:
Pivot Logic (Customizable Strength)
Local highs/lows are detected using pivot length (default: 3 bars left/right). Breaks are only confirmed if they align with the internal trend state.
BOS = Continuation
Breaks a swing in trend direction (e.g., HL → HH → BOS at previous HH)
CHoCH = Reversal
Breaks a structure against trend (e.g., HH → HL → break of HL = Bearish CHoCH)
Conflict Resolution
If both BOS and CHoCH could trigger, CHoCH takes priority. This avoids false positives and ensures a single, clear structure signal per swing.
Styling & Visibility
All structure lines and labels are customizable — colors, line style (solid/dashed), and which signals to display (BOS/CHoCH/both).
3. 🧠 Supply & Demand Zones – Smart Detection & Maintenance
These zones are generated using strict price action logic, not arbitrary support/resistance lines:
-Formation Conditions
-Small-bodied "base candle" at a local high/low
-Followed by an impulse candle (bullish/bearish engulfing or breakout)
-Zone Bounds
- Demand : From base candle low to impulse high
- Supply : From base candle high to impulse low
Automatic Cleanup
Once price decisively pierces a zone, it’s automatically removed from the chart. This keeps the display relevant and clutter-free.
Multi-Timeframe Zones
Toggle zones from your current timeframe or overlay from 1H, 4H, and Daily — ideal for confluence stacking.
Zone Compression Filtering
Optional compression % ensures overlapping zones are combined logically to reduce redundancy.
🧩 How It Works Together – Practical Usage Flow
This indicator is designed to follow a structured workflow used by institutional-style traders:
Trend Structure
Identify trend using BOS and CHoCH on your timeframe.
Liquidity Zones
Look for supply/demand zones aligning with the structural bias.
Execution Areas
Wait for an unfilled FVG in confluence with the above conditions.
📸 Screenshot Captions
Screenshot 1: CHoCH + Demand Zone + Bullish FVG
📌 Reversal Setup with Confluence
A Bullish CHoCH confirms a structural shift. Price enters a Demand Zone and reacts from an unfilled Bullish FVG, creating a high-probability long opportunity.
Screenshot 2: Bearish BOS + FVG Fill
📌 Trend Continuation Confirmation
Price breaks a swing low, triggering a Bearish BOS. A Bearish FVG forms and price returns to fill it before continuing lower — validating the trend and the gap.
Screenshot 3: Multi-Timeframe Overlay (FVGs from 1H and 4H)
📌 Top-Down Liquidity Mapping
Overlaid 1H and 4H FVGs provide institutional-level insight on lower timeframes. Combined with structure signals, this supports precise entry alignment across timeframes.
As price partially fills a bullish gap, the FVG box auto-adjusts to show only the remaining imbalance. Fully filled zones are automatically removed, keeping the chart clean.
Screenshot 4: Supply Zone Rejection
📌 Institutional Supply in Action
Price enters a Supply Zone formed from a base candle + bearish impulse. A sharp rejection confirms active sell-side interest at this level. Zone opgevuld box verdwijnt
Screenshot 5: Bullish BOS + Internal Trend Logic
📌 Trend Continuation with Structure Awareness
A Higher Low forms, followed by a Higher High, triggering a Bullish BOS. The internal trend engine confirms direction and filters false reversals.
Screenshot 6: Zone Compression Logic
📌 Smart Zone Consolidation
Closely overlapping supply zones are merged using compression logic to prevent clutter. Only the strongest institutional levels remain visible.
⚙ Full Customization Panel
You can configure:
-FVG display per timeframe + color scheme
-BOS/CHoCH styling, label text, and detection toggles
-Zone settings: visibility, compression %, length
-Auto-cleanup behavior for FVGs and zones
🔐 Why Invite-Only?
This indicator contains original logic not available in public indicators, including:
-Momentum-candle verified FVGs
-Real-time partial fill trimming
-Auto-removal of invalidated structure/zones
-Conflict-aware BOS/CHoCH logic
-Multi-timeframe overlays with internal state tracking
-Proprietary compression-based zone filtering
This script is part of a private paid offering. It is not based on reused or repackaged educational code. The logic and structure management are exclusive to this implementation.
⚠ Disclaimer
This tool is for educational and analytical use only. It does not provide financial advice or trading signals. Always use proper risk management and do your own due diligence.
