Godfather of Support & Resistance Godfather of Support & Resistance
Overview
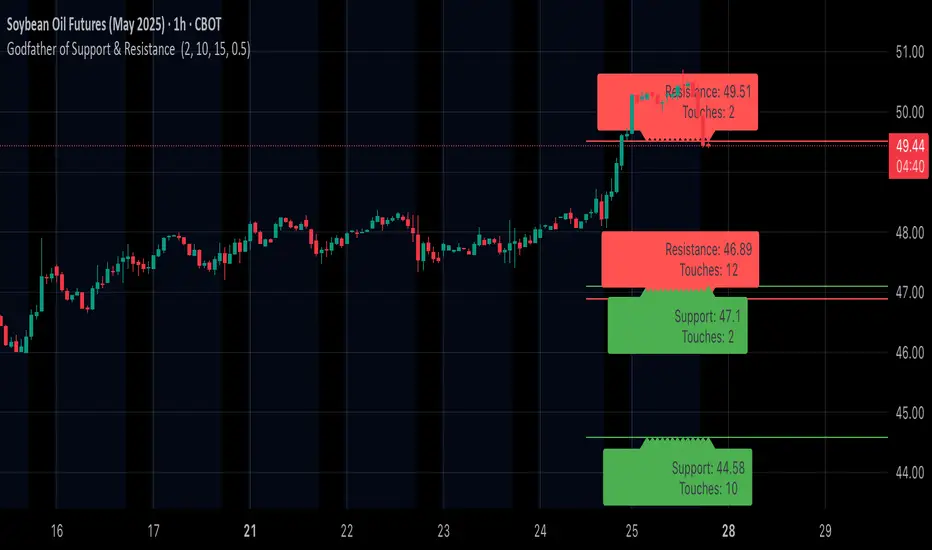
The Godfather of Support & Resistance script is a powerful tool designed to help traders identify critical support and resistance levels on their charts. These price levels are vital for understanding market behavior, as they often act as turning points where prices reverse, consolidate, or break through. By automating the detection of these levels, this script simplifies your trading decisions and enhances your technical analysis.
How It Works
Pivot Points for Level Detection:
The script uses pivot points to identify potential support (lows) and resistance (highs) levels:
A pivot high is a local peak (a high surrounded by lower highs).
A pivot low is a local trough (a low surrounded by higher lows).
You can adjust the Pivot Length (pivotLen) input to control the sensitivity of detection. Smaller values detect more levels, while larger values focus on major levels.
Dynamic Grouping with Tolerance:
The script dynamically groups nearby price levels using a tolerance percentage. This tolerance is based on the level's price, making it adaptive to all types of assets (low- and high-priced).
For example, if the tolerance is set to 1% and a level is at $100, levels within $1 are grouped together.
Touch Count for Significance:
The script tracks how many times the price interacts with each level (touch count). Only levels that meet or exceed the Minimum Touches (minTouches) input are displayed on the chart. This ensures only meaningful levels are highlighted.
Clear Visual Representation:
Resistance Levels (Red Lines): Represent areas where the price tends to reverse downward.
Support Levels (Green Lines): Represent areas where the price tends to reverse upward.
Labels are added to each level (optional) to display the price and the number of touches for better decision-making.
Inputs You Can Customize
Minimum Touches to Show Level:
Set the minimum number of price interactions required for a level to be displayed.
Maximum Lines to Keep:
Limit the number of support and resistance lines displayed to keep your chart clean and focused.
Pivot Length:
Customize the sensitivity of pivot point detection. Smaller values detect more levels, while larger values focus on key levels.
Tolerance for Touch Detection (%):
Adjust the grouping tolerance as a percentage of the price. For example, 1% groups levels that are within 1% of each other.
How to Use
Apply the Script:
Add the script to your TradingView chart, and it will automatically detect and plot support and resistance levels.
Analyze the Levels:
Use Resistance Levels (red lines) as potential sell zones or areas to place stop-loss orders above.
Use Support Levels (green lines) as potential buy zones or areas to place stop-loss orders below.
Customize for Your Trading Style:
Adjust the inputs to match your preferred strategy and the timeframe or asset you're analyzing.
Example Use Case
Imagine you're analyzing a stock:
Resistance Level: The script identifies resistance at $150 with 3 touches. This might be a potential sell zone if the price struggles to break through.
Support Level: The script identifies support at $130 with 4 touches. This might be a potential buy zone if the price shows signs of bouncing upward.
Key Features
Automatically detects and plots support and resistance levels.
Tracks the number of price touches to filter out weak levels.
Adapts dynamically to price ranges using a percentage-based tolerance.
Fully customizable to suit different trading styles and assets.
Clean and professional chart display with a limit on the number of lines.
Notes
This script is for educational purposes only and should not be considered financial advice.
Always perform your own analysis and manage risk before making trading decisions.
Why Use This Script?
The Godfather of Support & Resistance script simplifies your trading decisions by automating the detection of critical price levels. Whether you're a beginner or an experienced trader, this script is designed to save you time and help you focus on making informed trades.
Start using it today to master the art of support and resistance trading!
Let me know if you need further refinements for this description!
Educational
Micro Gaps DetectorSimple Micro Gap Indicator: A Technical Analysis Tool
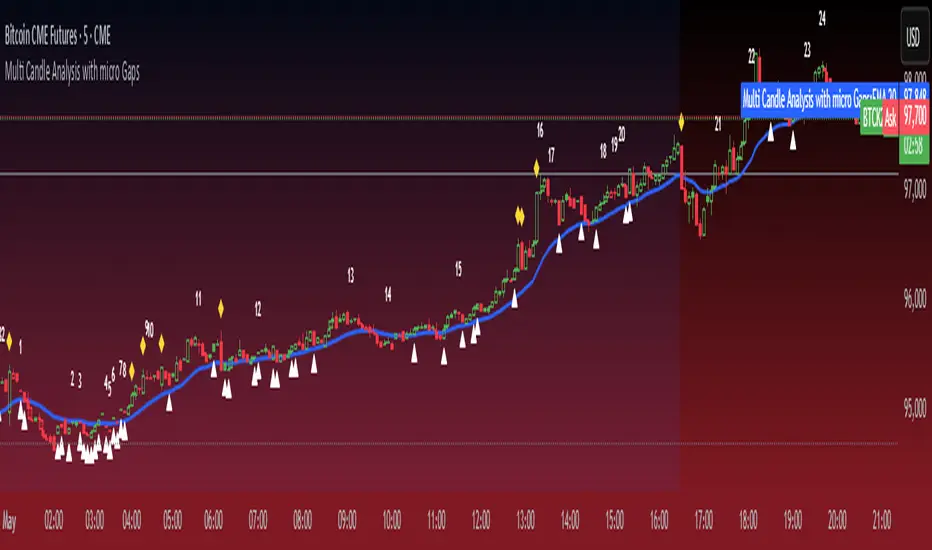
The Simple Micro Gap Indicator is a specialized momentum indicator designed to identify and analyze micro gaps between consecutive candlesticks in financial charts. Unlike traditional gap analysis that focuses on larger price gaps, this indicator specifically targets smaller, less noticeable spaces between candles.
Key Features:
Detects minimal price disparities between consecutive candlesticks
Helps identify potential short-term momentum shifts
Useful for high-frequency trading and scalping strategies
Functions as a momentum indicator for short-term price movements
Wyckoff Accumulation Distribution Wyckoff Accumulation & Distribution Indicator (RSI-Based)
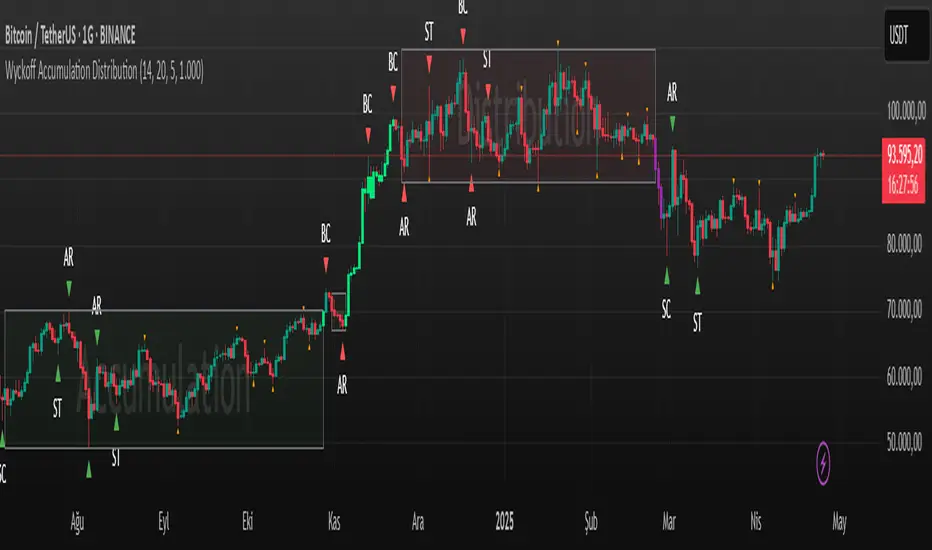
This Pine Script is a technical analysis indicator built around the Wyckoff Method, designed to detect accumulation and distribution phases using RSI (Relative Strength Index) and pivot points. It automatically marks key structural turning points on the chart and highlights relevant zones with colored boxes.
What Does It Do?
Draws accumulation and distribution boxes based on RSI behavior.
Automatically detects Wyckoff structural signals:
SC (Selling Climax)
AR (Automatic Rally)
ST (Secondary Test)
BC (Buying Climax)
DAR (Automatic Reaction)
DST (Secondary Test - Distribution)
Identifies trend transitions by detecting sideways RSI movement.
Attempts to detect spring and UTAD-like deviations based on RSI reversals.
Uses RSI extremes in conjunction with pivot points to generate Wyckoff signals.
How Does It Work?
RSI Zone: It identifies sideways markets when RSI stays within ±20 of the 50 level (this range is configurable).
Pivot Points: It detects pivot highs/lows that sync with RSI values (pivotLen is adjustable).
Trend Box Drawing:
When RSI exits the sideways zone, the script draws a gray box between the highest high and lowest low within that range.
If RSI breaks upward, the box becomes green (Accumulation); if downward, it becomes red (Distribution).
Wyckoff Structural Points:
SC/BC: Detected when a pivot occurs with RSI below/above a threshold.
AR/DAR: The next opposite pivot after SC or BC.
ST/DST: The next same-direction pivot after AR or DAR.
How to Use It
Works best on 4H or daily charts for more reliable signals. Shorter timeframes may generate noise.
Primarily used for interpreting RSI structures through the lens of Wyckoff methodology.
Box colors help quickly identify market phase:
Green box: Likely Accumulation
Red box: Likely Distribution
Triangular markers show key signals:
SC, AR, ST: Accumulation points
BC, DAR, DST: Distribution points
Use these signals alongside price action to manually interpret Wyckoff phases.
image.binance.vision
image.binance.vision
What Is the Wyckoff Method?
The Wyckoff Method, developed in the 1930s by Richard Wyckoff, is a market analysis approach that focuses on supply and demand dynamics behind price movements.
Wyckoff’s 5 Phases:
Accumulation: Smart money gradually buying at low prices.
Markup: Price begins trending upwards.
Distribution: Smart money selling to retail traders.
Markdown: Downtrend begins as supply outweighs demand.
Re-accumulation / Re-distribution: Trend-continuation phases with consolidations.
This indicator is specifically designed to detect phase 1 (Accumulation) and phase 3 (Distribution).
Extra Notes
Repainting is minimal, as pivots are confirmed using historical candles.
Labels use plotshape for a clean, minimalist visual style.
Other Wyckoff events (like SOS, LPS, UT, UTAD) could be added in future updates.
This script does not generate buy/sell signals; it is meant for structural interpretation.
Gold ORB Strategy (15-min Range, 5-min Entry)The Gold ORB (Opening Range Breakout) Strategy is designed for day traders looking to capitalize on the price action in the early part of the trading day, specifically using a 15-minute range for identifying the opening range and a 5-minute timeframe for breakout entries. The strategy trades the Gold market (XAU/USD) during the New York session.
Opening Range: The strategy defines the Opening Range (ORB) between 9:30 AM EST and 9:45 AM EST using the highest and lowest points during this 15-minute window.
Breakout Entries: The strategy enters trades when the price breaks above the ORB high for a long position or below the ORB low for a short position. It waits for a 5-minute candle close outside the range before entering a trade.
Stop Loss and Take Profit: The stop loss is placed at 50% of the ORB range, and the take profit is set at twice the ORB range (1:2 risk-reward ratio).
Time Window: The strategy only executes trades before 12:00 PM EST, avoiding late-day market fluctuations and consolidations.

Market Open & Pre-Open Linesversion 1.0 2025-04-23
Stated vertical line for market open and pre-market open. Market option include US, EU, UK, JP and AU. This line do auto-defined during daylight saving time. This help for those trade during market open and benefit for those doing backtest on it.
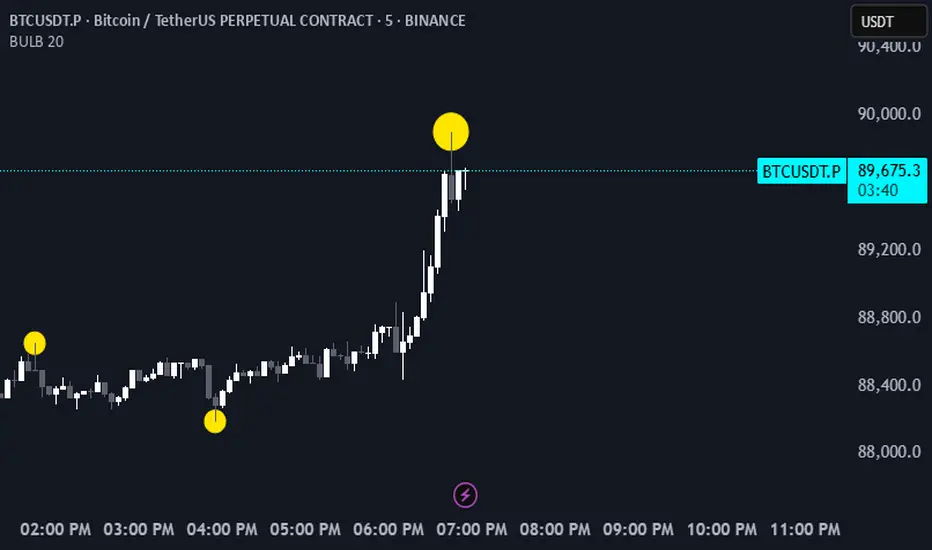
BULB 20Fractal Wave Marker Indicator
The Fractal Wave Marker is a technical analysis tool designed to visually highlight significant turning points in price action, offering clear signals of potential market reversals. By detecting fractal-like patterns, the indicator identifies high and low points within a specified period, helping traders pinpoint key market swings.
Key Features:
Fixed Period: The period is set to .., ensuring consistency in detecting turning points based on historical price data.
Swing Detection: The indicator detects both base (lower-degree) and fractal (higher-degree) swings, helping to visualize both short-term and long-term trend changes.
Color-coded Markers: High points are marked with a custom color to indicate bullish conditions, while low points are marked in another color for bearish conditions.
Wave Processing: The indicator processes swing highs and lows, dynamically updating to reflect the most relevant turning points on the chart.
Overlay on Chart: Markers are overlaid directly on the chart for quick, intuitive insights into price action, helping traders make better entry and exit decisions.
How It Works:
The indicator calculates the highest highs and lowest lows over a -bar period (fixed period).
When a new swing point is detected, the indicator marks it with a circle, color-coded based on whether it’s a high or low point.
The base swing and fractal wave directions are updated with each new turning point, allowing traders to follow price action and identify market trends.
Zen MIG Reversal V1**Zen MIG Reversal V1**
Zen MIG Reversal is a pattern-based indicator that highlights rare reversal setups.
It’s designed to support traders in visually identifying potential turning points, especially following strong momentum or gap-style moves.
**How it works:**
- **Bullish Reversal:**
Detects 3 consecutive bullish candles. The third bar must have a low above the high of the first bar and below the 20 EMA. When this occurs, a light blue box is drawn across the 3-bar range, from high to the current bar’s low. A blue arrow appears below the prior bar.
- **Bearish Reversal:**
Detects 3 consecutive bearish candles. The third bar must have a high below the low of the first bar and above the 20 EMA. A light red box is drawn from low to the current bar’s high. A red arrow appears above the prior bar.
- Optional settings allow you to:
- Show or hide the EMA line
- Toggle the arrows
- Adjust smoothing settings for context
**Purpose:**
It’s best used for discretionary analysis, journaling, or studying price behavior in momentum-driven environments.
**Disclaimer:**
This script is for educational and informational purposes only. It does not provide financial advice or trade recommendations. Always backtest and use proper risk management before applying any indicator to live trading.

Sessions OHLC - NY TimeThis Pine Script indicator, "Session OHLC Rays & Boxes - NY Time (Current Day)," visualizes trading sessions on a chart by marking the Open, High, Low, and Close (OHLC) levels for four predefined sessions—Asia, London, NY AM, and NY PM—based on New York time (EDT, UTC-4).
It draws the following for the current day:
Colored Boxes: Each session is enclosed in a semi-transparent box (e.g., green for Asia, blue for London) spanning the session’s duration, with the top and bottom at the session’s High and Low.
Horizontal Rays: Dashed lines extend rightward from the OHLC levels of each session, color-coded to match the session, if enabled via user inputs (e.g., "Show Asia Open").
OHLC Labels: Yellow labels display the OHLC prices at the start of each session box, updated dynamically: Open at session start, High and Low during the session, and Close at session end or during the session if active.
Additionally, users can display up to four previous days’ sessions (boxes and labels) by adjusting the "Show Previous Days" input. The indicator is customizable, allowing users to toggle OHLC labels and rays for each session and adjust session times and colors.

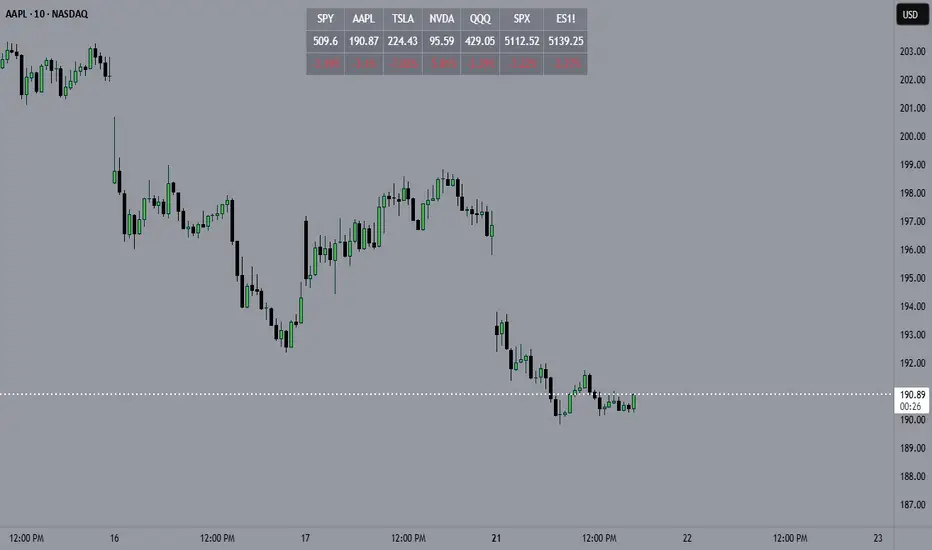
Horizontal Price TableOverview:
This script displays a dynamic price table on your chart, showing real-time prices and daily percentage changes for up to 7 user-defined tickers. You can customize both which tickers are shown and how many are visible, all through the settings panel.
How it works (Step-by-Step):
User-Defined Tickers:
The script provides input fields for up to 7 tickers using input.symbol(). You can track stocks, indexes, ETFs, crypto, or futures — anything supported by TradingView.
Choose How Many to Display:
An additional dropdown lets you choose how many of the 7 tickers to actually display (between 1 and 7). This gives you control over screen space and focus.
Market Data Fetching:
For each displayed ticker, the script fetches:
The current day’s closing price (close)
The previous day’s closing price (close )
This data is pulled using request.security() on the daily timeframe (1D).
% Change Calculation:
The script calculates the daily percentage change using:
(Current Price−Previous Close)/Previous Close×100(Current Price−Previous Close)/Previous Close×100
Cleaned Ticker Names:
Ticker symbols often include an exchange prefix like NASDAQ:AAPL. The script automatically removes anything before the colon (:), so only the clean symbol (e.g., AAPL) is shown in the table.
Table Display:
A visual table appears at the top-center of your chart, showing:
Row 1: Ticker symbol (cleaned)
Row 2: Current price (rounded to 2 decimals)
Row 3: Daily % change (green for gains, red for losses)
Customization:
You can choose the background color of the table.
Ticker names appear in white text with a gray background.
% change is color-coded: green for positive, red for negative.
Why Use This Script?
Track multiple tickers at once without leaving your chart.
Clean, customizable layout.
Useful for monitoring watchlists, portfolios, or related markets.
Tips:
Combine this with your favorite indicators for a personalized dashboard.
Works great on any chart or timeframe.
Ensure the tickers entered are valid on TradingView (e.g., SPY, BTCUSD, NQ1!, etc.).
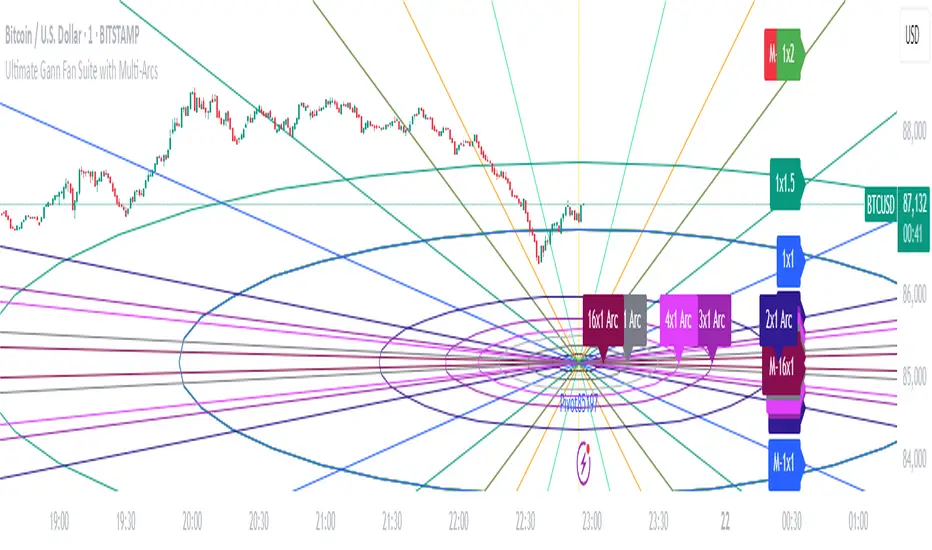
Ultimate Gann Fan Suite with Multi-ArcsUltimate Gann Fan Suite with Multi-Arcs
This open-source indicator plots Gann Fan angles, arcs, and levels to analyze price and time relationships based on a user-selected pivot point.
What It Does:
- Draws Gann Fan angles (1x16 to 16x1) from a pivot, with optional mirrored lines.
- Plots a base Gann arc and multi-arcs scaled by Gann ratios.
- Displays a Square of 9 grid and Gann Square levels for price projections.
- Supports custom timeframes and price types for pivot selection.
How to Use:
- Pivot: Enable manual pivot picking and select a price type (e.g., Close, High).
- Timeframe: Choose a timeframe (e.g., Daily) for pivot data.
- Angles and Arcs: Show/hide specific Gann angles, arcs, or levels; adjust colors and line styles.
- Scaling: Set price scale (e.g., 9.0) and arc radius (e.g., 36) for visual clarity.
- Labels: Enable labels to identify angles and levels.
- Best for stocks, forex, or crypto on daily or weekly charts.
Notes:
- Ensure enough chart history for the selected timeframe.
- Use on assets with clear trends or cycles for best results.
- Adjust settings to balance chart readability.
JOYZONE.04JOYZONE signal for TradingView
The JOYZONE Breakout Indicator is a sophisticated tool designed for traders seeking to identify potential trend reversals and breakouts in financial markets. Built for TradingView’s Pine Script v6, this indicator leverages pivot points to detect significant price levels, offering a clear visual representation of bullish and bearish market shifts. By focusing on key price action patterns, it aims to provide traders with actionable insights for both trend-following and reversal strategies.
Core Functionality
The JOYZONE Breakout Indicator identifies critical pivot highs and lows using a fixed 5-period lookback, which simplifies the detection of potential reversal zones without requiring user adjustments. These pivot points are used to establish "JOYZONE" levels—price thresholds that, when broken with confirmation, signal a change in market trend. The indicator employs a robust confirmation mechanism within fixed bar window, reducing false signals and enhancing reliability.
Upon detecting a breakout, the indicator plots horizontal lines at the JOYZONE levels, extending until a new signal emerges or the trend shifts. Labels accompany these lines, marking bullish (+JOYZONE) and bearish (-JOYZONE) breakouts with customizable colors (default: green for bullish, red for bearish) and sizes (tiny to large). This visual clarity helps traders quickly assess market direction and key price levels.
Key Features
Simplified Inputs: The indicator minimizes user configuration by hardcoding critical parameters like the fixed-period directional detection system. Traders can toggle JOYZONE level visibility, adjust label sizes, and customize colors, ensuring flexibility without overwhelming complexity.
Efficient Signal Management: With a default cap of 86 signals, the indicator prevents chart clutter by automatically removing older lines and labels when the limit is exceeded. This feature is particularly useful for long-term chart analysis.
Dynamic Alerts: The script includes alert triggers for bullish and bearish JOYZONE breakouts, delivering real-time notifications with price details. This enables traders to act swiftly on confirmed signals, whether trading manually or integrating with automated systems.
ATR-Based Label Positioning: Labels are offset using the 50-period Average True Range (ATR), ensuring they remain visible and uncluttered regardless of market volatility.
How It Works
The indicator tracks pivot highs and lows to establish JOYZONE levels during uptrends (bearish levels) and downtrends (bullish levels). When the price crosses a JOYZONE level and satisfies the confirmation criteria, the trend updates, and a breakout signal is plotted. For example, a bullish JOYZONE breakout occurs when the price crosses above a pivot high during a downtrend, confirmed by a close above the threshold. The script then draws a green line and a “+JOYZONE” label, alerting the trader to a potential uptrend.
Use Cases
This indicator is versatile, catering to various trading styles:
Swing Traders: Use JOYZONE breakouts to enter trades at the onset of new trends, with clear entry and stop-loss levels based on plotted lines.
Day Traders: Leverage real-time alerts to capitalize on intraday reversals in volatile markets.
Position Traders: Monitor higher timeframes to identify long-term trend shifts with high-probability setups.
Customization and Performance
Traders can adjust the visibility of JOYZONE levels, label sizes, and colors to suit their chart preferences. The hardcoded 5-period lookback and 0.015% confirmation ensure consistency across assets, but users may need to test performance on specific markets (e.g., forex, stocks, crypto) to align with their strategies. The indicator’s reliance on ATR for label placement adapts to varying volatility, making it effective across different instruments.
Limitations and Considerations
While the JOYZONE Breakout Indicator excels in trending markets, it may produce delayed signals in choppy or sideways conditions due to its confirmation mechanism. Traders should combine it with other tools, such as moving averages or volume indicators, to filter signals. Additionally, the fixed period may not suit all timeframes, so testing on historical data is recommended.
Conclusion
The JOYZONE Breakout Indicator offers a streamlined, visually intuitive approach to detecting trend reversals and breakouts. Its automated signal management, dynamic alerts, and customizable display make it a valuable addition to any trader’s toolkit. By focusing on confirmed price action, it empowers traders to make informed decisions with confidence. Whether you’re a novice or seasoned trader, this indicator provides a reliable framework for navigating dynamic markets.
Disclaimer: This code does not guarantee of profit/return, please analyze with other factors, it is shared only for knowledge and educational purpose.

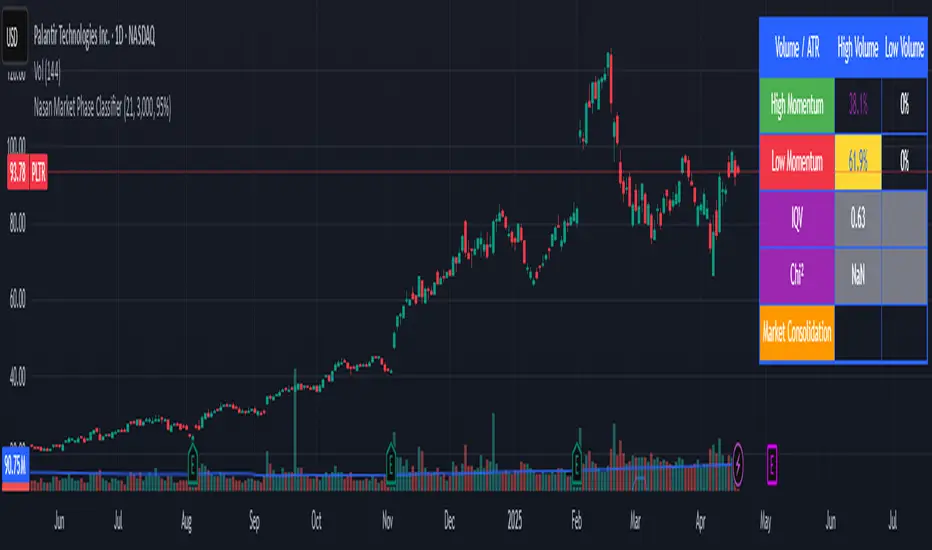
Nasan Market Phase ClassifierThe Nasan Market Phase Classifier indicator designed to classify market phases using volume, volatility (or momentum), and statistical analysis. Here's a summary of how it works and what it does:
🔍 Core Concept
This indicator classifies the market into four phases based on volume and ATR (or optionally momentum):
High Volume / High ATR or Momentum (HV/HATR): Strong Trend
Low Volume / High ATR or Momentum (LV/HATR): False Breakout / Exhaustion
High Volume / Low ATR or Momentum (HV/LATR): Consolidation
Low Volume / Low ATR or Momentum (LV/LATR): Stagnation
⚙️ Key Settings
Short-Term Length: Used for the active market phase.
Long-Term Length: Used as the expected/benchmark distribution.
Use Momentum: Replaces volatility (ATR) with momentum (custom ROC-based formula).
Use Fixed Alpha: Toggles adaptive vs. fixed weighting in scoring (this is based on variation of the volatility - standard deviation of true range).
📊 How It Works
Volatility or Momentum Scoring:
Uses ATR-based or Momentum-based score depending on the setting.
Applies weighing (alpha) which is based on variability of the volatility itself.
Market Phase Count:
Measures how often each of the 4 volume/volatility combinations occur in:
Short-term window (observed phase)
Long-term window (expected distribution)
Category Proportions:
Calculates percentage share of each category (e.g., % time in HV/HATR).
Plots these on chart to visually see market phase dominance (can be used for screening of pine screener).
Statistical Testing:
IQV (Index of Qualitative Variation): Measures phase diversity (0 = focused, 1 = mixed).
Chi-Squared Test: Compares current vs. historical phase distribution.
Z-Test: Tests if current phase dominance is statistically significant.
📋 Outputs
On-Chart Plots and Tabels:
Strong Trend, False Breakout/Exhaustion, Consolidation, Stagnation
Strength Quality Plot: Trend strength normalized by IQV.
Dynamic Table (Top Right):
Shows each phase’s proportion (the current phase cell is highlighted in yellow), IQV, Chi² value, and current dominant phase. The current candle classification (text) is in purple.
Highlights the dominant phase classification and color-codes significance (the cell highlighted in green highly confident about the classification, orange intermediate confidence and red low confidence). This color coding is not just based on statistical significance it is based on IQV which takes into account how spread the proportions are.
🧠 Interpretation
A dominant HV/HATR phase with low IQV and high Z-Score indicates a strong and statistically significant trend.
High IQV suggests uncertainty or mixed market behavior.
Chi² spike indicates a shift from historical behavior can be used to see is the market behavior changing by changing the long term length say to 252 and short term length to 21 this will tell if the short term behavior is different from the past 252 day behavior.
Open - CSC Bars - 33 CSC Bars – Early Session Price Action Filter
This script detects when the first three bars of the RTH (Regular Trading Hours) session all move in the same direction — either all bullish or all bearish.
It’s a tool for price action traders who want to develop structured opening strategies by observing clean directional agreement at the session start. The indicator highlights the third bar when the sequence confirms directional bias.
🔍 How It Works:
Monitors the first three bars after the RTH session begins.
If all three bars are bullish, it highlights the third bar (same for bearish sequences).
No projections, signals, or entries—purely a visual tool to observe and study opening behavior.
🎯 Use Case:
This script is designed to help traders build and test opening-based frameworks by identifying potential trend bias early in the day.
Note: This is an open-source utility script with a simple function. It does not generate signals or predictions and is intended to assist with observation and discretionary strategy building.

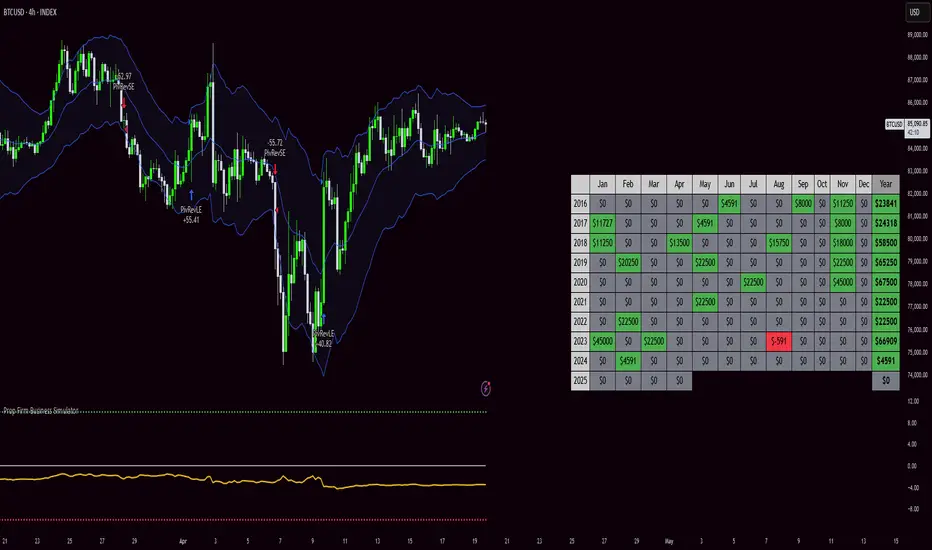
Prop Firm Business SimulatorThe prop firm business simulator is exactly what it sounds like. It's a plug and play tool to test out any tradingview strategy and simulate hypothetical performance on CFD Prop Firms.
Now what is a modern day CFD Prop Firm?
These companies sell simulated trading challenges for a challenge fee. If you complete the challenge you get access to simulated capital and you get a portion of the profits you make on those accounts payed out.
I've included some popular firms in the code as presets so it's easy to simulate them. Take into account that this info will likely be out of date soon as these prices and challenge conditions change.
Also, this tool will never be able to 100% simulate prop firm conditions and all their rules. All I aim to do with this tool is provide estimations.
Now why is this tool helpful?
Most traders on here want to turn their passion into their full-time career, prop firms have lately been the buzz in the trading community and market themselves as a faster way to reach that goal.
While this all sounds great on paper, it is sometimes hard to estimate how much money you will have to burn on challenge fees and set realistic monthly payout expectations for yourself and your trading. This is where this tool comes in.
I've specifically developed this for traders that want to treat prop firms as a business. And as a business you want to know your monthly costs and income depending on the trading strategy and prop firm challenge you are using.
How to use this tool
It's quite simple you remove the top part of the script and replace it with your own strategy. Make sure it's written in same version of pinescript before you do that.
//--$$$$$$$$$$$$$$$$$$$$$$$$$$$$$$$$$$$$$$$$$$$$$$$$--//--------------------------------------------------------------------------------------------------------------------------$$$$$$
//--$$$$$--Strategy-- --$$$$$$--// ******************************************************************************************************************************
//--$$$$$$$$$$$$$$$$$$$$$$$$$$$$$$$$$$$$$$$$$$$$$$$$--//--------------------------------------------------------------------------------------------------------------------------$$$$$$
length = input.int(20, minval=1, group="Keltner Channel Breakout")
mult = input(2.0, "Multiplier", group="Keltner Channel Breakout")
src = input(close, title="Source", group="Keltner Channel Breakout")
exp = input(true, "Use Exponential MA", display = display.data_window, group="Keltner Channel Breakout")
BandsStyle = input.string("Average True Range", options = , title="Bands Style", display = display.data_window, group="Keltner Channel Breakout")
atrlength = input(10, "ATR Length", display = display.data_window, group="Keltner Channel Breakout")
esma(source, length)=>
s = ta.sma(source, length)
e = ta.ema(source, length)
exp ? e : s
ma = esma(src, length)
rangema = BandsStyle == "True Range" ? ta.tr(true) : BandsStyle == "Average True Range" ? ta.atr(atrlength) : ta.rma(high - low, length)
upper = ma + rangema * mult
lower = ma - rangema * mult
//--Graphical Display--// *-*-*-*-*-*-*-*-*-*-*-*-*-*-*-*-*-*-*-*-*-*-*-*-*-*-*-*-*-*-*-*-*-*-*-*-*-*-*-*-*-*-*-*-*-*-*-*-*-*-*-*-*-*-*-*-*-*-*-*-*-*-*-*-*-*-*-*-*-*-*-*-*-$$$$$$
u = plot(upper, color=#2962FF, title="Upper", force_overlay=true)
plot(ma, color=#2962FF, title="Basis", force_overlay=true)
l = plot(lower, color=#2962FF, title="Lower", force_overlay=true)
fill(u, l, color=color.rgb(33, 150, 243, 95), title="Background")
//--Risk Management--// *-*-*-*-*-*-*-*-*-*-*-*-*-*-*-*-*-*-*-*-*-*-*-*-*-*-*-*-*-*-*-*-*-*-*-*-*-*-*-*-*-*-*-*-*-*-*-*-*-*-*-*-*-*-*-*-*-*-*-*-*-*-*-*-*-*-*-*-*-*-*-*-*-*-$$$$$$
riskPerTradePerc = input.float(1, title="Risk per trade (%)", group="Keltner Channel Breakout")
le = high>upper ? false : true
se = lowlower
strategy.entry('PivRevLE', strategy.long, comment = 'PivRevLE', stop = upper, qty=riskToLots)
if se and upper>lower
strategy.entry('PivRevSE', strategy.short, comment = 'PivRevSE', stop = lower, qty=riskToLots)
The tool will then use the strategy equity of your own strategy and use this to simulat prop firms. Since these CFD prop firms work with different phases and payouts the indicator will simulate the gains until target or max drawdown / daily drawdown limit gets reached. If it reaches target it will go to the next phase and keep on doing that until it fails a challenge.
If in one of the phases there is a reward for completing, like a payout, refund, extra it will add this to the gains.
If you fail the challenge by reaching max drawdown or daily drawdown limit it will substract the challenge fee from the gains.
These gains are then visualised in the calendar so you can get an idea of yearly / monthly gains of the backtest. Remember, it is just a backtest so no guarantees of future income.
The bottom pane (non-overlay) is visualising the performance of the backtest during the phases. This way u can check if it is realistic. For instance if it only takes 1 bar on chart to reach target you are probably risking more than the firm wants you to risk. Also, it becomes much less clear if daily drawdown got hit in those high risk strategies, the results will be less accurate.
The daily drawdown limit get's reset every time there is a new dayofweek on chart.
If you set your prop firm preset setting to "'custom" the settings below that are applied as your prop firm settings. Otherwise it will use one of the template by default it's FTMO 100K.
The strategy I'm using as an example in this script is a simple Keltner Channel breakout strategy. I'm using a 0.05% commission per trade as that is what I found most common on crypto exchanges and it's close to the commissions+spread you get on a cfd prop firm. I'm targeting a 1% risk per trade in the backtest to try and stay within prop firm boundaries of max 1% risk per trade.
Lastly, the original yearly and monthly performance table was developed by Quantnomad and I've build ontop of that code. Here's a link to the original publication:
That's everything for now, hope this indicator helps people visualise the potential of prop firms better or to understand that they are not a good fit for their current financial situation.
Bitcoin NUPL IndicatorThe Bitcoin NUPL (Net Unrealized Profit/Loss) Indicator is a powerful metric that shows the difference between Bitcoin's market cap and realized cap as a percentage of market cap. This indicator helps identify different market cycle phases, from capitulation to euphoria.
// How It Works
NUPL measures the aggregate profit or loss held by Bitcoin investors, calculated as:
```
NUPL = ((Market Cap - Realized Cap) / Market Cap) * 100
```
// Market Cycle Phases
The indicator automatically color-codes different market phases:
• **Deep Red (< 0%)**: Capitulation Phase - Most coins held at a loss, historically excellent buying opportunities
• **Orange (0-25%)**: Hope & Fear Phase - Early accumulation, price uncertainty and consolidation
• **Yellow (25-50%)**: Optimism & Anxiety Phase - Emerging bull market, increasing confidence
• **Light Green (50-75%)**: Belief & Denial Phase - Strong bull market, high conviction
• **Bright Green (> 75%)**: Euphoria & Greed Phase - Potential market top, historically good profit-taking zone
// Features
• Real-time NUPL calculation with customizable smoothing
• RSI indicator for additional momentum confirmation
• Color-coded background reflecting current market phase
• Reference lines marking key transition zones
• Detailed metrics table showing NUPL value, market sentiment, market cap, realized cap, and RSI
// Strategy Applications
• **Long-term investors**: Use extreme negative NUPL values (deep red) to identify potential bottoms for accumulation
• **Swing traders**: Look for transitions between phases for potential trend changes
• **Risk management**: Consider taking profits when entering the "Euphoria & Greed" phase (bright green)
• **Mean reversion**: Watch for overbought/oversold conditions when NUPL reaches historical extremes
// Settings
• **RSI Length**: Adjusts the period for RSI calculation
• **NUPL Smoothing Length**: Applies moving average smoothing to reduce noise
// Notes
• Premium TradingView subscription required for Glassnode and Coin Metrics data
• Best viewed on daily timeframes for macro analysis
• Historical NUPL extremes have often marked cycle bottoms and tops
• Use in conjunction with other indicators for confirmation

Cyclical CALL/PUT StrategyThis script identifies optimal CALL (long) and PUT (short) entries using a cyclical price wave modeled from a sine function and confirmed with trend direction via a 200 EMA.
Strategy Highlights:
Cycle-Based Signal: Detects market rhythm with a smoothed sinusoidal wave.
Trend Confirmation: Filters entries using a customizable EMA (default: 200).
Auto-Scaling: Wave height adjusts dynamically to price action volatility.
Risk Parameters:
Take Profit: Default 5% (customizable)
Stop Loss: Default 2% (customizable)
Signal Triggers:
CALL Entry: Price crosses above the scaled wave and in an uptrend
PUT Entry: Price crosses below the scaled wave and in a downtrend
Inputs:
Cycle Length
Smoothing
Wave Height
EMA Trend Length
Take Profit %
Stop Loss %
Visuals:
Gray line = Scaled Cycle Wave
Orange line = 200 EMA Trend Filter
Best For: Traders looking to make 1–2 high-probability trades per week on SPY or other highly liquid assets.
Timeframes: Works well on 2-min, 15-min, and daily charts.

Directional Bias | FractalystNote: This indicator is specifically designed to integrate with the Quantify suite, automating bias detection through input.source(). While other scripts may provide similar functionality, this indicator uniquely connects with Quantify by outputting precise bias values: bullish (1), bearish (-1), or neutral (0).
What is the Directional Bias indicator?
The Directional Bias indicator is a powerful tool designed to automatically identify market bias (bullish, bearish, or neutral) using a sophisticated system of moving averages and filters. It serves as the perfect companion to the Quantify suite, allowing traders to objectively determine market direction without relying on subjective analysis or emotional decision-making.
How does the Directional Bias indicator work?
The indicator utilizes up to four customizable moving averages (MA) with various types (SMA, EMA, HMA, VWMA, etc.) and timeframes to determine market direction. It analyzes price action relative to these moving averages and applies user-defined filters to calculate whether the current market condition is bullish, bearish, or neutral.
What makes this indicator different from other trend indicators?
- Unlike traditional trend indicators that rely on a single moving average or oscillator, the Directional Bias indicator offers:
- Multi-moving average analysis with up to 4 different MAs
- Customizable MA types (SMA, EMA, WMA, VWMA, RMA, HMA, DEMA, TEMA, etc.)
- Multi-timeframe functionality for each MA
- Configurable filters to eliminate false signals
- Clear visual representation of bias directly on your charts
How does this indicator integrate with the Quantify?
- The Directional Bias indicator serves as the automated "bias detection engine" for the Quantify suite. While the original Quantify model required manual bias selection, this integration allows Quantify to automatically detect market bias and adjust its calculations accordingly. This creates a more streamlined workflow where Quantify can focus on identifying high-probability setups aligned with the objectively determined market direction.
Who is this indicator designed for?
This indicator is perfect for:
- Traders who use the Quantify suite and want to automate bias detection
- Technical analysts seeking objective trend confirmation
- Systematic traders who need clear rules for market direction
- Any trader looking to remove subjectivity from their directional analysis
What are the key benefits of using the Directional Bias indicator?
- Objective Analysis: Removes emotion and subjectivity from market direction determination
- Customizable: Adapt to your preferred timeframes and moving average types
- Visual Clarity: Instantly see market bias directly on your charts
- Seamless Quantify Integration: Automates what was previously a manual step in the Quantify workflow
- Enhanced Decision-Making: Provides clear signals for when to look for long vs. short opportunities
How can I optimize the Directional Bias indicator for my trading style?
You can customize:
- MA types for different market conditions (trending vs. ranging)
- MA lengths for sensitivity adjustment (shorter for quick signals, longer for reduced noise)
- Timeframes for each MA to incorporate multi-timeframe analysis
- Filter conditions to refine signals based on your risk tolerance
How does this indicator fit into a complete trading system?
The Directional Bias indicator serves as the first essential component in a complete system:
- Step 1: Use Directional Bias to determine market direction
- Step 2: Let Quantify identify high-probability entry setups aligned with that direction
- Step 3: Implement proper risk management using Quantify's Kelly Criterion calculations
- Step 4: Manage your trades with Quantify's trailing stop mechanisms
What technical innovations does this indicator offer?
- The indicator leverages advanced Pine Script functionality to deliver:
- Real-time bias calculation across multiple timeframes
- Non-repainting signals that provide reliable analysis
- Optimized code for smooth performance
- Visual color-coding for instant bias recognition
- Seamless integration with the broader Quantify ecosystem
To implement: Add both indicators to your chart, select Directional Bias as Quantify's external input source, and the system will automatically adjust calculations based on the detected market bias.

Rolling Beta against SPY📈 Pine Script Showcase: Rolling Beta Against SPY
Understanding how your favorite stock or ETF moves in relation to a benchmark like the S&P 500 can offer powerful insights into risk and exposure. This script calculates and visualizes the rolling beta of any asset versus the SPY ETF (which tracks the S&P 500).
🧠 What Is Beta?
Beta measures the sensitivity of an asset's returns to movements in the broader market. A beta of:
- 1.0 means the asset moves in lockstep with SPY,
- >1.0 indicates higher volatility than the market,
- <1.0 implies lower volatility or possible defensive behavior,
- <0 suggests inverse correlation (e.g., hedging instruments).
🧮 How It Works
This script computes rolling beta over a user-defined window (default = 60 periods) using classic linear regression math:
- Calculates daily returns for both the asset and SPY.
- Computes covariance between the two return streams.
- Divides by the variance of SPY returns to get beta.
⚙️ Customization
You can adjust the window size to control the smoothing:
- Shorter windows capture recent volatility changes,
- Longer windows give more stable, long-term estimates.
📊 Visual Output
The script plots the beta series dynamically, allowing you to observe how your asset’s correlation to SPY evolves over time. This is especially useful in regime-change environments or during major macroeconomic shifts.
💡 Use Cases
- Portfolio construction: Understand how your assets co-move with the market.
- Risk management: Detect when beta spikes—potentially signaling higher market sensitivity.
- Market timing: Use beta shifts to infer changing investor sentiment or market structure.
📌 Pro Tip: Combine this rolling beta with volatility, Sharpe ratio, or correlation tracking for a more robust factor-based analysis.
Ready to add a layer of quantitative insight to your chart? Add the script to your watchlist and start analyzing your favorite tickers against SPY today!

HTF FibonacciThis indicator displays Fibonacci lines for the selected previous HTF candle.
You can set its Fibs levels and colors.
HTF options: 15 minutes, 30 minutes, 1 hour, 2 hours, 4 hours and 1 day

ADX with Shaded ZoneThe ADX with Shaded Zone indicator is a momentum-based tool that visualizes trend strength using the Average Directional Index (ADX) along with the +DI and -DI lines. This indicator enhances the traditional ADX setup by adding a shaded zone between ADX levels 20 and 25, helping traders easily identify the transition area between non-trending and trending market conditions.
It plots:
+DI (Green): Positive Directional Indicator
−DI (Red): Negative Directional Indicator
ADX (Blue): Measures the strength of the trend
Shaded Zone: Highlights the indecisive range where ADX is below 25 (gray background between levels 20 and 25)
⚙️ How to Use:
✅ Trend Identification:
ADX < 20: Weak or no trend. Avoid trend-following strategies.
ADX 20–25 (Shaded Zone): Transition zone. Potential trend forming — stay cautious.
ADX > 25: Stronger trend. Favor trend-following strategies.
✅ Direction Confirmation:
If +DI > -DI and ADX > 25 → Uptrend confirmation.
If -DI > +DI and ADX > 25 → Downtrend confirmation.
Crossovers between +DI and -DI can be used as early signals.
✅ Shaded Zone Use:
The gray shaded area helps visually filter out low-trend strength conditions.
Useful for trend traders to wait before entering until ADX breaks above 25.

Collatz Conjecture - DolphinTradeBot1️⃣ Overview
Every positive number follows its own unique path to reach 1 according to the Collatz rule.
Some numbers reach the end quickly and directly.
Others rise significantly before crashing down sharply.
Some get stuck within a certain range for a while before finally reaching 1.
Each number follows a different pattern — the number of steps it takes, how high it climbs, or which values it passes through cannot be predicted in advance.
This is a structure that appears chaotic but ultimately leads to order:
Every number reaches 1, but the way it gets there is entirely uncertain.
2️⃣ How Is It Work?
The rule is simple:
▪️ If the number is even → divide it by two.
▪️ If it’s odd → multiply it by three and add one.
Repeat this process at each step.
Example :
Let’s say the starting number is 7:
7 → 22 → 11 → 34 → 17 → 52 → 26 → 13 → 40 → 20 → 10 → 5 → 16 → 8 → 4 → 2 → 1
It reaches 1 in 17 steps.
And from there, it always enters the same cycle:
4 → 2 → 1 → 4 → 2 → 1...
3️⃣ Why Is It Worth Learning?
🎯 This indicator isn’t just mathematical fun—it’s a thought experiment for those who dare to question market behavior.
▪️ It’s fun.
Watching numbers behave in unpredictable ways from a simple rule set is surprisingly enjoyable.
▪️ It shows how hard it is to teach a computer what randomness really is .
The Collatz process can be used to simulate chaotic behavior and may even inspire creative ways to introduce complexity into your code.
▪️ It makes you think — especially in financial markets.
The patternless, yet rule-based structure of Collatz can help train your mind to recognize that not all unpredictability is random. It’s a great mental model for navigating complex systems like price action.
▪️ Just like price movements in financial markets, this ancient problem remains unsolved.
Despite its simplicity, the Collatz conjecture has resisted proof for decades — a reminder that even the most basic-looking systems can hide deep complexity.
4️⃣ How To Use?
Super easy — in the indicator’s settings, there’s just one input field.
Enter any positive number, and you’ll see the pattern it follows on its way to 1.
You can also observe how many steps it takes and which values it visits in the info box at the top center of the chart.
5️⃣ Some Examples
You Can Observe the Chaos in the Following Examples⤵️
For Input Number → 12
For Input Number → 13
For Input Number → 14
For Input Number → 32768
For Input Number → 47

HG StdDevThe HG StdDev indicator provides a dynamic view of market volatility by calculating the standard deviation of a selected price source over a customizable period. Additionally, it plots a threshold line representing the highest standard deviation over a secondary lookback window.
Red Line: Current standard deviation (volatility) of the price.
Gray Line: Highest standard deviation value within the lookback range, serving as a reference for recent peak volatility.
Use this tool to identify periods of increasing or extreme volatility, potential breakout zones, or to filter signals based on volatility thresholds.

TuxTune - Dynamic Vertical LineVisual aid. The vertical line moves dynamically with the last candle of the selected time frame.
The middle of the line moves with the latest price.
The line range (height) can be set to any value to aid in quickly gauging the size of the candles without having to keep looking at the numbers on the vertical axis to determine how big the candles are.
Line width, color, and distance from the last candle can also be set.
The label can be turned off/on.
