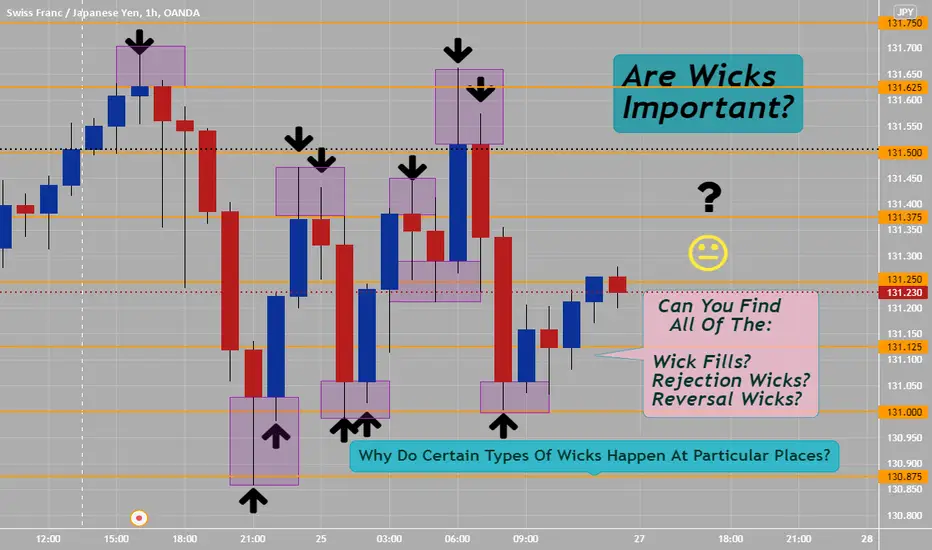
Are Wicks Important? Types Of Wicks: Fill, Rejection & ReversalPlease look at your own charts:
Do you see all of the following?
Wick Fills? These type of wicks happen going with the trend and get filled with further price action on chart.
Rejection Wicks? Mostly happen at key support and resistance zones or key quarter theory psychological numbers, a lot of traders have orders there.
Reversal Wicks? Happen at key areas mostly on 1 hour, 4 hr, daily, weekly and even monthly charts- these are areas with large wicks in past which once price action comes into these areas at key resistance and support areas- will accumulate orders and reverse directions.
See attached 1 hour charts----
How many different types of wicks can you see and/or spot.... you need to see quarter theory psychological numbers in actually real live time when trading Forex. Always start with monthly charts and keep going lower until you are trading with the chart of your choosing. Higher time frames will give you better risk to reward opportunities then under 1 hour...
If you truly understand wicks- you will be a better trader and know if you scalp trade, day trade or position trade when to look for quick wick fill candles to catch some quick pips. These are the easy Forex trades to do, make sure you are trading during high liquidity and volume time periods only.
Candlestick Analysis
Elements Of Candlesticks (You Need To Know)Each Candlestick consists of four important elements:
1) The Body- Large bodies equals more liquidity and more volume involved in candlestick, smaller is other side which is smaller liquidity and volume.
2) The Length Of The Wicks- Larger wicks equals higher or lower rejection of price action, from the other side. Example: Pin bar candlestick at top of a bullish run up equals bulls are losing their strength and bears are starting to get control over current price action.
3) The Ratio Between The Body And The Wicks- Example: Doji or indecision candlestick generally has around same length of upper and lower wicks and bodies are small- so both bears and bulls are at a stand off with each one not winning at the moment... sideways price action.
4) The Position Of The Body- Look to left, what do you see? Where are the quarter theory lines on charts- you can plot all xxx000, xxx250, xxx500 and xxx750 lines which are the standard ones to either highlight or be aware of on any chart you trade from. Did current body make either a pin bar candlestick pattern, harami candlestick pattern or an engulfing candlestick pattern?
You need to know that 12 hours a day in Forex is high liquidity and high volume times: End of Tokyo to End of London, this is when most big moves happen.
You can google or YouTube more on Quarters theory which I strongly advise you implement in all of your trading, specially in this choppy price action. Do not be greedy and protection your profits- risk management is always #1. Understand each pairs ATR, lot size , pip value so you can only use 1% to 2% of account per trade, if you slowly grow account using compounding in Forex trading and be a successful trader. Good luck and Good trading.

USDJPY, (240) SQUEEZE INDICATOR Hello, this indicator is called Squeeze momentum indicator (Lazy bear) you can check on the indicator search engine. This indicator is simply to use and highly effective, when there is a change in color , and smaller bars that signifies change of trend while the small black crosses within he momentum squeeze bars signifies incoming trend reversal.
Share with me your ideas.
Jesus loves you ❤️

Engulfing-Harami-Pin bar (only setups you need to trade)Only Three Candlestick setup you need to totally understand to trade Forex - Successfully!!!
1) Engulfing-
An engulfing pattern is a 2-bar reversal candlestick pattern. The first candle is contained with the 2nd candle. A bullish engulfing pattern has a red candle engulfed within a green candle. A bearish engulfing pattern has a green candle engulfed within a red candle
2) Harami-
The Harami candlestick is a Japanese candlestick pattern that comprises of two candles which indicates a potential reversal or continuation in the market. The word ‘Harami’ is derived from the Japanese word for ‘pregnant’ which is representative of the Harami candlestick pattern. The Harami candlestick pattern can signal both bullish and bearish indications as charts notes.
3) Pin Bar-
The pin bar is a candlestick pattern that has a long tail up or down and represents the price rejection at support or resistance level in Forex trading. The pin bar is the most powerful and effective candlestick pattern in technical analysis. It gives a reversal signal but there are many other ways too to use pin bar in technical analysis like it is also used to draw SR flip level.
If you thoroughly understand how to trade Engulfing, Harami and Pin Bar candlestick setups on 1 hour or higher is better- you will succeed in Forex. Always trade Price Action (just chart price) and maintain proper 1% to 2% risk management per trade (use total of trading account)- then you can set stops, lot sizes and targets of trade. Good Luck!!! Keep trading Forex trading as simple as possible- no need to complicate this endeavor. Look at quarter levels on charts or ex: 000, 250, 500 and 750, as noted on chart 000, 0000 and 500 were great levels of these candlestick patterns and reversals. Have Plan & Trade Plan.

Japanese Candlesticks: learning to read and understand🕯
✅Japanese candlesticks are the most popular way to read the price movement on charts. They are visual, easy to learn and the main thing is that they work.
✅The first mention of candle patterns can be found in the Japanese rice trader Homma Munehisa in the 1700s. Almost 300 years later, candles were rediscovered by Steve Neeson in his book titled "Japanese Candles. Graphical analysis of financial markets".
✅Candlestick charts provide much more information compared to linear charts and are currently the preferred market analysis tool for traders and investors.
What are Japanese candles?
🟢Each of the candles tells us four facts about itself: the opening price, the maximum price movement, the closing price, and the minimum price movement.
⏺A bullish candle is formed when the price rises. In financial markets, the term bullish means a long position or a buy.
⏺A bearish candle is formed when the price falls. In financial markets, the term bearish refers to a short position or sale.
❗️The body of the candle is the space between the opening and closing of the candle. If the body is green, it means that the closing price of the candle is higher than the opening price. If the color is red, it means the closing price is lower than the opening price of the candle.
❗️Candle wicks represent the highest or lowest points that the candle has reached.
🟢Each candle represents a selected time frame or time interval during which it opens and closes. For example, on a 4-hour chart, candlesticks open and close every 4 hours.
🟢If we line up several candlesticks, we can compare them with a linear chart. Candle wicks also show price fluctuations. Thus, we immediately get the maximum information that we need for effective market analysis.
⚠️A trader who knows how to analyze and interpret candlestick patterns or patterns already understands the actions of financial market participants a little better.
❤️ Please, support our work with like & comment! ❤️

How to Accurately Read My Schiff PitchforkAnother link to the Schiff Pitchfork idea is also below in "Related Ideas" :
I realized that sharing my Schiff Pitchfork idea may not have been sufficient enough to allow others to be able to use it efficiently and accurately. I wanted to make a video that shows people how I use the Schiff Pitchfork to trade and analyze; Along with some extra tips.
The video is 20 minutes, but well worth it and shows my analysis for BTC since I have came back to charting this January 13th.
In related links, you can also find the idea "BTC End above 41,700 potential". That idea shows some of the analysis on the movements during those times.
Thank you for watching the video. I hope you enjoyed it. Stay Healthy and Stay Safe.

ICT Market Maker Sell ModelFirst you must have a clean consolidation which you are anticipating that it will be taken once market come up.
Secondly you must have an old low Significant OB which market is chasing it(magnetic) and you know that after market taken out that old low then it will reverse quickly to come up to attack your consolidation.
And finally you will investigate if you have any bearish SMT divergence that will give you a confidence that market will chase that old low

FB waited Long positionFB stock repeating July 2018 pattern. Expect price to further decrease until it increases. The difference here is that MACD has already crossed over into bearish territory. Stochastics has moved into oversold territory and weakness in the trend shown by the RSI is looking oversold. RSI signal line of 41 is still in range between 50 and 20. This shows that there is room for the stock to further dip. Either wait for 6 months to get a bullish candle with confirmation candles to enter the trade (approximately July 2022). If taking a long-term position (greater than 1 year) and it's ok to take a temporary drawdown or to dollar cost average, it is a good buy right now. Otherwise, it's better to wait till July and see if the price starts appreciating again as an entry trade.
Risk Disclaimer
*Futures, stocks, exchange traded funds and spot currency trading have large potential rewards, but also large potential risk. You must be aware of the risks and be willing to accept them in order to invest in the futures , stocks, and forex markets.

Engulfing Candlestick PatternEngulfing candlestick is formed when it completely engulfs the previous more than one candle but be considered an engulfing candlestick pattern because in Engulfing at least one candle must fully engulf.
Types of Engulfing Candlestick Pattern
Bullish Engulfing Pattern
Bearish Engulfing Pattern
#1 Bullish Engulfing Pattern
Bullish Engulfing pattern consists of two candle formations, the first candle is the small body and the second candle is the bigger. The second big candle should be fully engulfed than the previous small candle. This is called the bullish engulfing pattern.
#2 Bearish Engulfing Pattern
Bearish Engulfing pattern consists of two candle formations, the first candle is a small Bullish candle and the second is the bigger bearish Candle than the previous bullish candle. The Second big bearish candle should fully engulf the previous one or more small candles. This is called a bearish engulfing pattern.

How to be a trader and a single parent
I am recently a single parent of 7 kids, ten years ago i invested in stocks and shares on the trading market,
I got locked out of that email address
Finally ten years later, i found my trades,
Our future is brighter now,

Reversal candlestick patterns in crypto you only needHello, everyone!
While Bitcoin is playing out our long signal it’s time for educational content. Today I wanna show you the candlestick formations which predict the reversals in crypto. I know that in the books we can find more formations with different names, but in practice only these patterns does matter in reversals. All these formations play out with the best performance on the 4h+ timeframes.
Bullish Formations
1. This is the strongest bullish formation. When we observe the downtrend and the bullish hammer candle with the increased volume appears at the end, it is almost 100% sign of reversal, the huge bounce or the new uptrend is anticipated when you see this pattern.
2. This formation does not mean that the downtrend is finished, but the big bounce can be anticipated.
3. This formation is the weakest. If it appeared we can wait just for the local bounce.
Bearish Formations
4. The strongest bearish formation which appears at the uptrend end with the increased volume at the bearish hammer candle.
5. The big correction can be anticipated if you see this formation but not the new downtrend.
6. Local correction can play out in case of this bearish formation.
Please, remember that the candlestick formation without conformation can’t be the long or short signal. Exception are 1 and 4 formations. For other patterns we have to see the divergence to confirm the trend reverse.
DISCLAMER: Information is provided only for educational purposes. Do your own study before taking any actions or decisions at the real market.

Trade With The TrendIdentify a trend. Draw horizontal key level. Wait for a pin bar to form in a pull back to the horizontal key level. Enter at close price of pin bar.
Trend: Up
Level: Horizontal, EMA 10, EMA 20
Signal: Pin Bar
Charts

TRADING WITH SIMPLICITY ALWAYS GIVES YOU COOL STATE OF MIND .In the starting days of my trading I was also searching for the holy grails and trust me , I blow my 80% of account to using all these holy grails and when I started to keep trading simple with only 3 points that are -
1) TREND
2) MARKET STRUCTURE
3) PRICE ACTION
then it become so easier to be a successful trader and will only suggest you to work on it either you are a intraday trader or a swing this is the best and easiest method of trading .
We will understand this process by the above example.
In this chart there's a trendline coming from upside which I used as a parallel channel , when the price broke the L-1 line then I was only thinking to go short as the upper trendline channel has been tested 2 times so this could be the 3rd time may be a rejection could happen there's but as I said I'm a very conservative trader and looking for multiple confirmations so I didn't take the trade at 3rd POINT.
But at the 4th time rejection I did it. Reason to trade there -
1) downtrend
2)bearish pattern of HEAD AND SHOULDER
3) price break the neckline as well as the major support level
4) with huge bearish engulfing candle
Trade simple and captured a 25.7% move downside.
I hope you all will understand what I want to say pure price action based trading is as simple as nothing to do with the indicators(I also used some indicators but that's a different kind of story and will tell in the next tutorial ).
HAPPY TRADING
NITIN (INDIA)

CANDLESTICK PATTERN TRADING | Engulfing Candle 📚
Hey traders,
In this post, we will discuss a classic candlestick pattern formation each trader must know - the engulfing candle.
Key properties of this pattern:
🔑 Engulfing candle is a reversal pattern.
🔑 Engulfing candle can be bullish or bearish.
❗️Also, remember that this candle demonstrates the highest accuracy when it is formed on a key level (support or resistance).
⬆️Bullish Engulfing Candle usually forms after a strong bearish impulse.
Weakening, the market keeps going lower forming bearish candles.
However, at some moment, instead of forming a new bearish candle the market reverses. The price forms a bullish candle that engulfs the range of the previous bearish candle and closes above its opening price.
Such a candle we call a bullish engulfing candle.
The main feature of this pattern is the fact that its total range (distance from the wick high to wick low) & body range (distance from body open to body close) exceed the ranges of a previous bearish candle.
Being formed on a key support level or within a demand zone it signifies a highly probable pullback or even a trend reversal.
⬇️Bearish Engulfing Candle usually forms after a strong bullish move.
Reaching an overbought condition, the market keeps going higher forming bullish candles.
However, at some moment, instead of forming a new bullish candle the market goes in the opposite direction. The price forms a bearish candle that engulfs the range of the previous bullish candle and closes below its opening price.
Such a candle we call a bearish engulfing candle.
The main feature of this pattern is the fact that its total range (distance from the wick high to wick low) & body range (distance from body open to body close) exceed the ranges of a previous bullish candle.
Being formed on a key resistance level or within a supply zone it signifies a highly probable pullback or even a trend reversal.
📝Engulfing candle can be applied for scalping lower time frames, for intraday trading, or even for swing trading.
Personally, I apply this candle on daily/4h time frames as one of the confirmations of the strength of the structure level that I spotted.
Do you trade engulfing candle?
❤️Please, support this idea with like and comment!❤️

Inverted HammerThe inverted hammer is a type of candlestick pattern found after a downtrend and its a trend-reversal signal.

The Power of DojiA Doji is created when the open and close for a price are virtually the same. Doji tend to look like a cross or plus sign and have small or nonexistent bodies. From an auction theory perspective, Doji represent indecision on the side of both buyers and sellers. Everyone is equally matched, so the price goes nowhere; buyers and sellers are in a standoff.
When it comes in a downtrend it act as a reversal pattern so we know that the bears power is weak, and bulls start to take control thus the price will go up and the trend will be up , when it comes in an uptrend the bull power is weak , bears starts to take control and price will eventually go down . But in technical analysis you cant enter a trade only from one sign so you should know you Support and Resistance area, draw your trend lines, use some indicators, and when you see the Doji know you know its the perfect time to execute the trade.

📚#e04 : A Journey Of Inversion ♋ Bond Masters💰Of Us All ⚖️💫An Education🎓
Series Continuation
Prior Episodes Found
In The Content Below
❔ What Are Bonds
Bonds Are The Foundation
Of A Debt Based Monetary
System
Bonds Define The Cost Of
Money Over Time
Put Simply Bonds Are
Future Dollars
Read That Again🔂
US Treasury Bonds Are
Future US Dollars Deliverable
At A Specified Time
In The Future I.e
30 Years Henceforth
By Purchasing A
US Treasury Bond
You Enter Into A
Legal Contract With
The Treasury Wherein
You Will Receive
The Principle Or
"Face Value" Of The
Bond Plus The Rate
Of Interest Specified
At The Time Of Purchase
❔ A Traders Role
To Make Money I Hear You Say
Well Yes Of Course
But What Exactly As Bond Traders
Are We Getting Paid For ?
To Provide A Service
Our Collective Actions
Expressed Through The
Trading Of Bond Instruments
Determine The Cost Of Money
Yes This Is True
Bet You Didn't Know That
Regardless Of Your Trading
Size We Are All Interacting
With The Free Market
Our Role Is To Correctly
Price The Cost Of Money
When We Trade Bonds
Profitably
Our Roles Are Fulfilled
❔ Why Else Ultra Bonds
Low Operation Costs
Only Pay Spread Fee
Regardless Of Trade Size
As Futures Contracts
Zero Overnight
Cost To Carry
Operation Costs Will
Kill A Trader Over Time
Same As Any Business
d-MR96nBa
nvrBrkagn
ℹ️ CME Group Official
Ultra Bond Trader Site
www.cmegroup.com
Starblazers 🌠
Dreamscapers 🧙🏼♂️
Rebellion 🧗🏻♀️
Join Me On A Journey Of Mastery
Utilising The Instruments
Symbolising Our Servitude
Slaves Will Topple Masters
Behold.. The
Ultra Bond Future 🗽
US 30 Year Yields📊
📚#e03 :
📚#e02 :
📚#e01 :
CBOT:UB1!
TVC:US30Y

Candlesticks PatternsMost simply, candlestick charts are used by traders to represent the price evolution of an asset. While candlesticks may be harder to understand initially, they offer far more information than a simple line chart.
How to read a candle?
There are two colors: red and green. When a candle is red, its closing price was lower than the opening price: the price of the asset decreased during that trading period. When a candle turns green, the closing price was higher than the opening price as the asset's price increased.
Beyond color, let's break down the rest of the visual above:
Body: The body indicates the open-to-close range. In other words, it indicates the difference between the closing and the opening price.
Wicks: These are also called tails or shadows. They reveal the highest and lowest price of an asset within the candlestick period. If there is no wick, the opening and closing prices are the lowest/highest price.
Highest Price: The top of the upper wick indicates the highest price traded during the period.
Lowest Price: The lowest price traded during the period is indicated by the bottom of the lower wick.
Opening price: This is the price at which the first trade happened during the new candlestick time period. If the price goes up, the candle turns green and conversely turns red on a price decrease.
Closing price: The closing price is the last price traded during the period of the candle formation. If this price is above the opening price, the candle will be green, otherwise, it will be red.
Types of Candlestick Patterns:
The candlestick patterns can be divided into:
1.Continuation Patterns
2.Bullish Reversal Patterns
3.Bearish Reversal Patterns
We may further divide the above categories into further 35 sub-categories.
1. Hammer: Hammer is a single candlestick pattern that is formed at the end of a downtrend and signals bullish reversal. The psychology behind this candle formation is that the prices opened and sellers pushed down the prices.
2. Piercing Pattern: Piercing pattern is multiple candlestick chart pattern that is formed after a downtrend indicating a bullish reversal. It is formed by two candles, the first candle being a bearish candle which indicates the continuation of the downtrend.
3. Bullish Engulfing: It is formed by two candles, the second candlestick engulfing the first candlestick. The first candle is a bearish candle that indicates the continuation of the downtrend.
4. The Morning Star: It is made of 3 candlesticks, first being a bearish candle, second a Doji and the third being a bullish candle.
5. Three White Soldiers: These candlestick charts are made of three long bullish bodies which do not have long shadows and are open within the real body of the previous candle in the pattern.
6. White Marubozu: This candlestick has a long bullish body with no upper or lower shadows which shows that the bulls are exerting buying pressure and the markets may turn bullish. At the formation of this candle, the sellers should be caution and close their shorting position.
7. Three Inside Up: It consists of three candlesticks, the first being a long bearish candle, the second candlestick being a small bullish candle which should be in the range the first candlestick. The third candlestick should be a long bullish candlestick confirming the bullish reversal.
8. Bullish Harami: It consists of two candlestick charts, the first candlestick being a tall bearish candle and second being a small bullish candle which should be in the range of the first candlestick. The first bearish candle shows the continuation of the bearish trend and the second candle shows that the bulls are back in the market.
9. Tweezer Bottom: It consists of two candlesticks, the first one being bearish and the second one being bullish candlestick.
10. Inverted Hammer: In this candlestick, the real body is located at the end and there is a long upper shadow. It is the inverse of the Hammer Candlestick pattern.
11. Three Outside Up: It consists of three candlesticks, the first being a short bearish candle, the second candlestick being a large bullish candle which should cover the first candlestick.
12. On-Neck Pattern: The on neck pattern occurs after a downtrend when a long real bodied bearish candle is followed by a smaller real bodied bullish candle which gaps down on the open but then closes near the prior candle’s close.
13. Bullish Counterattack- This candlestick pattern is a two-bar pattern that appears during a downtrend in the market.
Bearish Candlestick Pattern:
14. Hanging man: The real body of this candle is small and is located at the top with a lower shadow which should be more than the twice of the real body. This candlestick pattern has no or little upper shadow. The psychology behind this candle formation is that the prices opened and seller pushed down the prices.
15. Dark cloud cover: It is formed by two candles, the first candle being a bullish candle which indicates the continuation of the uptrend. The second candle is a bearish candle which opens gap up but closes more than 50% of the real body of the previous candle which shows that the bears are back in the market and bearish reversal is going to take place.
16. Bearish Engulfing: It is formed by two candles, the second candlestick engulfing the first candlestick. The first candle being a bullish candle indicates the continuation of the uptrend. The second candlestick chart is a long bearish candle that completely engulfs the first candle and shows that the bears are back in the market.
17. The Evening Star: It is made of 3 candlesticks, first being a bullish candle, second a doji and third being a bearish candle.
18. Three Black Crows: These candlesticks are made of three long bearish bodies which do not have long shadows and open within the real body of the previous candle in the pattern.
19. Black Marubozu: This candlestick chart has a long bearish body with no upper or lower shadows which shows that the bears are exerting selling pressure and the markets may turn bearish. At the formation of this candle, the buyers should take caution and close their buying position.
20. Three Inside Down: It consists of three candlesticks, the first being a long bullish candle, the second candlestick being a small bearish which should be in the range the first candlestick. The third candlestick chart should be a long bearish candlestick confirming the bearish reversal. The relationship of the first and second candlestick should be of the bearish Harami candlestick pattern.
21. Bearish Harami: It consists of two candlesticks, the first candlestick being a tall bullish candle and second being a small bearish candle which should be in the range of the first candlestick chart.
22. Shooting Star: Shooting Star is formed at the end of the uptrend and gives bearish reversal signal. In this candlestick chart the real body is located at the end and there is long upper shadow. It is the inverse of the Hanging Man Candlestick pattern.
23. Tweezer Top: It consists of two candlesticks, the first one being bullish and the second one being bearish candlestick. Both the tweezer candlestick make almost or the same high. When the Tweezer Top candlestick pattern is formed the prior trend is an uptrend. A bullish candlestick is formed which looks like the continuation of the ongoing uptrend. On the next day, the high of the second day’s bearish candle’s high indicates a resistance level. Bulls seem to raise the price upward, but now they are not willing to buy at higher prices.
24. Three Outside Down: It consists of three candlesticks, the first being a short bullish candle, the second candlestick being a large bearish candle which should cover the first candlestick. The third candlestick should be a long bearish candlestick confirming the bearish reversal.
25. Bearish Counterattack– The bearish counterattack candlestick pattern is a bearish reversal pattern that appears during an uptrend in the market. It predicts that the current uptrend in the market will make and the new downtrend will take over the market.
Continuation Candlestick Patterns:
26. Doji: It is formed when both the bulls and bears are fighting to control prices but nobody succeeds in gaining full control of the prices.
27. Spinning Top: The only difference between spinning top and doji is in their formation, the real body of the spinning is larger as compared to Doji.
28. Falling Three Methods: The “falling three methods” is a bearish, five candle continuation pattern which signals an interruption, but not a reversal, of the ongoing downtrend.
29. Rising Three Methods: The “rising three methods” is a bullish, five candle continuation pattern which signals an interruption, but not a reversal, of the ongoing uptrend.
30. Upside Tasuki Gap: This candlestick pattern consists of three candles, the first candlestick is a long-bodied bullish candlestick, and the second candlestick is also a bullish candlestick chart formed after a gap up. The third candlestick is a bearish candle that closes in the gap formed between these first two bullish candles.
31. Downside Tasuki Gap: This candlestick pattern consists of three candles, the first candlestick is a long-bodied bearish candlestick, and the second candlestick is also a bearish candlestick formed after a gap down. The third candlestick is a bullish candle that closes in the gap formed between these first two bearish candles.
32. Mat-Hold-There can be either bearish or bullish mat hold patterns. A bullish pattern begins with a large bullish candle followed by a gap higher and three smaller candles which move lower.
33. Rising Window-The rising window is a candlestick pattern consisting of two bullish candlesticks with a gap between them. The gap is a space between the high and low of two candlesticks that occurs due to high trading volatility. It is a trend continuation candlestick pattern indicating strong strength of buyers in the market.
34. Falling Window-The falling window is a candlestick pattern that consists of two bearish candlesticks with a gap between them. The gap is a space between the high and low of two candlesticks. it occurs due to high trading volatility. It is a trend continuation candlestick pattern and it is an indication of the strong strength of sellers in the market.
35. High Wave-The high wave candlestick pattern is an indecision pattern that shows the market is neither bullish nor bearish. It mostly occurs at support and resistance levels.

DYDX - About To Breakout Trend LineSee previous thread for more detailed TA on finding this breakout

How to use swing trading indicatorThis is tutorial on "How to use swing trading indicator " developed by me. Do use and benefit from it.

How to use Volume Bar Breakout and Breakdown IndicatorThis tutorial provides guidance on how to use "Volume bar breakout & breakdown Indicator" Indicator. It explains
When not to take entries
How to setup Stoploss and Target
what timeframe to use for equities and commodities but you can decide as per convenience

ENGULFING CANDLE. Powerful reversal candlestick pattern🕯
✅Candlestick patterns trading is one of the oldest but most effective ways to analyze the foreign exchange market. The trader needs to find certain patterns, and based on them, decide where the price will go. Today we will talk about one of these candlesticks, which is called the "engulfing candle". There are two types of it: bullish and bearish. The appearance of such a model on the chart with a high probability indicates a possible reversal of the trend and is a signal to enter the market.
Types of engulfing and their features
⚠️So, we realized that there are two types of this candle:
🟢Bullish. It indicates that the trend is turning towards an increase in the value of an asset or currency pair. The candle must engulf the range of the previous bearish candle to be valid.
🟢Bearish. The same as with bullish, only the opposite. It indicates that the trend is turning towards a decrease in the value of the asset. In this case, the candle must engulf the range of the previous bullish candle.
✅The formation of the "Bullish engulfing" candle says that buyers have sat on the throne, and "Bearish" - sellers. Let's discuss the theoretical foundations of the pattern. In the case of the "bullish engulfing" pattern, everything will be the same, just the opposite.
Rules for the formation of the "bearish engulfing" pattern:
There should be a bullish trend in the market, and the price should be on a key level.
❗️A long-bodied bullish candle appears (that is, directed towards the trend). The opening of the second candle should be carried out with a gap relative to the closing of the first, and its body should be larger than that of the previous one. It seems to engulf the trend with its dimensions, and therefore it is necessary to sell (a bearish candle indicates the beginning of a downward trend).
❤️ Please, support our work with like & comment! ❤️

EMA 10 EMA 20 Pin Bar (Rejection Candlestick) StrategyEntry is 4013.39
Exit at 4065.64
Reward:Risk is 2.6R
Reward = 5225 USD
Risk = 2009 USD
Strategy is to enter at closing price of a pin bar (rejection candlestick) when the pin bar wick intersects the EMA 10 and EMA 20 in an uptrend.
