The Best & Most Reliable Candlestick Patterns To UseIn this video I explain my favourite candlestick patterns and how to use them in your own trading.
Here we describe:
Engulfing Candles
Doji Candles
Hammer Candles
And I explain how to use them with confluence & context of where on the chart they occur.
Candlestick Analysis

Inside Bar Candlestick PatternInside bar refers to a candlestick pattern that consists of two candlesticks in which the most recent candlestick will form within the range of the previous candle.
It is the most widely used candlestick pattern and there is a clear logic behind this pattern. It can make you a profitable trader if you will use it in the correct way.

SIMPLE PRICE ACTION STRATEGY! PART 1RULE NO 1:
Use S&R Levels As Well As The SUPPLY & DEMAND ZONES.
RULE NO 2:
Look For BULLISH ENGULFINGS In The UP TREND TREND
2: PIN BAR CANDLE
3: BULLISH HAMMER
AND
Look For BEARISH ENGULFING In The DOWN TREND
2: SHOOTING STAR
3: BEARISH PIN BAR
NOTE: Use These Patterns on S&R , Supply And Demand Zones Break Of Structure Etc.
3RD RULE USE 4H TIMEFRAME IF YOU WANT TO LEARN IT FROM ME ASK ME IN COMMENTS I WILL TELL YOU HOW TO UNDERSTAND MARKET STRUCTURE EASILY !
USING TOO MUCH INDICATORS CAN LEAD YOU TO A HUGE LOSS.
This Is Not An Investment Advice.
HOPE YOU CAN UNDERSTAND!
HAVE A NICE TRADING JOURNEY !

The Breakthrough StrategyGreetings, traders! Welcome to this short, 7-step strategy lesson.
Are you new to trading? Don't worry: we're dedicated toward providing the most high-quality, easy-to-understand, and straight-to-the-point investing education to the TradingView community. This strategy lesson is beginner-friendly (we have pictures!), as we've inserted helpful links into each and every term, just in case you don't know them yet. Anyways, let's get right into the steps of this effective trading method , which we've named " The Breakthrough Strategy ":
• STEP 1, The Breakthrough:
Identify a breakout (or "breakthrough") at the most recent Support/Resistance (S&R) zone. With the horizontal line tool, if you haven't already, mark the level at which price broke: this will be your potential Entry Point (EP).
• STEP 2, The Turnaround:
Immediately following the breakout, you'll wanna see two or more consecutive candlesticks, going in the same direction of the breakout. After the streak, when you spot the first completely-formed candle, going in the opposite direction, you've found your "turnaround" point! Mark it up with a S&R line: this will be your potential Take Profit (TP) level.
• STEP 3, The Other Side:
Now, identify the most recent S&R zone, on the opposite side of the breakout zone: this will be your potential Stop Loss (SL) level.
• STEP 4, The Average:
Make sure that you have your Exponential Moving Average (EMA, 50) installed on TradingView. Is the end of it between the EP and the SL? Perfect! You're ready for the next step.
• STEP 5, The Order:
Place a Limit Order (TP, SL, and EP levels are mentioned in the previous steps). If, before price hits the Entry Point, things start to get choppy, close the pending order: it is now invalid.
• STEP 6, The Execution:
Did price hit your Entry Point? The order has been triggered —we're in! Good job, good luck, and hope for some profits.
• STEP 7, The Final Step:
"Practice makes perfect," so make sure that you backtest this method, to test it out before using it on the live market. Be sure to follow us, for future lessons which will help you significantly increase the power of this strategy!
We hoped that this helped you! We ask that you pay it forward, and share this lesson with a friend, a fellow trader, or... heck... share it with your grandmother.
“My mission is to help you see forex for what it is: it’s not ‘rocket science,’ but a simple strategy game. Get on the ‘good side’ of probability, develop the proper mindset, and you will prosper.”
— Nio Pomilia, Forex Free Press

How To Trade Quality Pin BarsAfter the Pin Bar Formed At The EMA 10 EMA 20, Do The Following Actions
Draw Your Fibonacci Retracement Levels
Draw Horizontal Support Levels
Enter At Pin Bar Close Price
Exit At The Previous Swing Low Level
The attributes that made this a quality Pin Bar:
Pin Bar Close Price is in the Fibonacci Retracement 50% and 38.2% Range Area
Pin Bar Close Price is in the EMA 10 EMA 20 Range Area
Pin Bar at Lower High
Downtrend
Technical Chart Of How To Trade The Pin Bar. Before and After Charts. Click on Charts.

How To Trade The Pin Bar With Support Resistance Levels 08-16-21This pin bar is in a pull back. The horizontal level was broken and the horizontal level was retested with a pin bar candlestick. In this case, the pin bar tail intersects the EMA 10 and horizontal support level. Price closed above the horizontal level. Entry for this strategy is at the pin bar close. The Target is the previous swing high.
Breakout & Return Strategy (#1 Setup)Example is on CADJPY 15 minute example chart. This is #1 best risk to reward setup for retail traders- scalpers and/or day trading. The noted risk to reward on chart example was 1:2 or 20 pips stop to 40 profit or target. Use this with engulfing, harami or pinbar candlestick(s) setups. good luck.

Trade Review: How I Scalped $MARA+ Reviewing Stream Set ups!In this video I will reviewing trades I took on the first week of August 9, 2021 going full in depth explaining how I traded these tickers with a new strategy I been testing with Inside Candles Credit: TW for his indicator and his strategy! Covered $MARA for a nice 10% scalp, then reviewing the set ups from Sundays Stream, then giving out some set ups for this week! Traded these tickers using my knowledge of technical Analysis , sharing my levels: Support & Resistance , my trendlines , Fibs, Waves, Price Action, Channels , Emma's, and prior experienced , while providing both bullish & bearish scenarios for you to be able to understand my analysis and wait for confirmation as always!
Want to see more content like this? Make sure to Like and Subscribe!

Best Candlestick Patterns
Long Wick (Shadow) Candle: Buyers or sellers tried to push the price further but failed
The inside bar: After a long wick could mean price change
Also engulfing is a reversal signal.
Momentum candle:
Multiple rejections: Good resistance and sign of price rejection and reversal
Shrinking candles: Loss of momentum
3 consecutive candles in the same colour: indicate the start of a new trend.
Big red candle: bearish
Doji: Open and close are similar and we have shadows on both sides. Can be a signal for reversal if the next candle shapes in a different colour from the previous one.
Hammer: bullish
Inverted hammer: bearish

Trade Review: How I been making consistent 80% returns W/ PROOF!In this video I will reviewing trades I took on the first week of August. going full in depth explaining how I traded these tickers with a new strategy i been testing with Inside Candles Credit: TW for his indicator and his strategy! Traded these tickers using my knowledge of technical Analysis , sharing my levels: Support & Resistance , my trendlines , Fibs, Waves, Price Action, Channels , Emma's, and prior experienced , while providing both bullish & bearish scenarios for you to be able to understand my analysis and wait for confirmation as always!
Want to see more content like this? Make sure to Like and Subscribe!

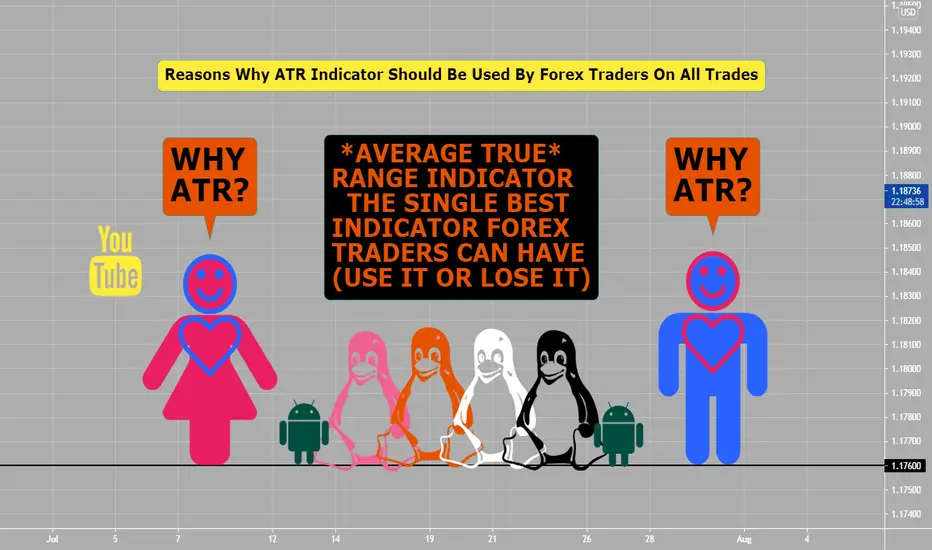
ATR indicator (Always Use This)The ATR (average true range) indicator is the single best indicator that all FOREX traders should be using for all trades (use it or lose it).
You can put ATR indicator on your chart always and/or just glance at number (in upper left) and take it off your chart, just have it handy always.
What is the ATR: (Default setting (14) works fine for me in FX trading.
It tells you how many pips the currency pair has moved, on average, in the past X amount of candles.
Why you should be using ATR 100% of the time on every trade:
1) The ATR is crucial for Money Management
2) Money Management is crucial to winning
*Know that money management is what will separate you from the losing traders.
How To Use ATR In Setting Up Trades: (Never Trade Without It)
1) To know how far back from entry price away your stop loss, which is either ATR x 1.5 (works mostly) or ATR x 2.0 (if you want larger stop loss)
2) To know where to place profit targets and/or targets, 1st target is same as risk or stop loss is and 2nd target is double what the stop loss is.
When you are describing Forex RISK, instead of saying unit size or dollar amounts, instead say How much are you trading per pip?
Using the ATR will prevent you from getting stopped out of more trades, will keep in more trades. The professionals use ATR for stop losses and targets. ATR can be used on any time frames, but look for other evidence like price action at support and resistance areas, fib ret (golden zone) 50%-61.8%, pivot points, doji candles, harami setups, and engulfing setups to use ATR indicator for possible trades.
What Is A Bankers Candle? How To TradeBanker candles happen on all time frames, with Forex trading- banker candles are stronger and more reliable on higher time frames.
Happen a lot at support and resistance, demand or supply and or bearish or bullish order block areas, Fib areas (50%-61.8%), zone areas, etc...
What Are Banker Candles:
They are the opposite move, before large move into other direction. Bullish daily trend, last RED candles before move upwards.
- see Doji candlestick (1st candle- happens during London session)
- see Engulfing two candlestick setup (2nd candle setup- during London/NY overlapping session)
Only people that have capital and can move Forex markets are: hedge funds and big banks
This is mostly called the manipulation phase or fakey area (going into wrong direction of trend of day) if you are scalping or day trading.
Look for big swing moves on 1 hour, 4 hour or daily going wrong direction of major trend on chart, last candle going against trend is bankers candle.
How To Trade: Make this part of your trading edge, strategy and/or plan
1) Set new trade on open of bankers candle excepting next candle to reverse back into major trend direction.
2) Set stop and targets (via ATR x 1.5)<- you can you tube video this concept for information. This is so that you do things same way over and over.

Significant Candles (Find Them)This is where and when big banks and institutions, during large significant candles. They give you a lot of valuable information- that will help you in your trading. Per chart: yellow lines are high psychological price actions where large candles either range, with large bodies or price reacts when it hits them.
I personally do not day trade outside of the times of Tokyo end to London end (12 hours), which is highest daily liquidity and volume times of Forex- other times scalp for 12.5 to 25 pips related to low liquidity and volume. Also, Monday and Fridays have lower liquidity and volume then Tuesday thru Thursday, so might do more scalping or short trades.
Significant Candles happen:
During The Right Pair
During The Right Session
At The Right Price
At The Right Time
+ Large Ranging candles, With Large bodies and Price reacts to candle once it reaches it.

Gold: Did You Know?In order to move gold by only 1 pip... you need a 10,000 lot size position. So retail traders always need to be trading with big banks not against big banks.

Impact of Fed Unchanged Interest Rate and Gold PricesHere I tried to show the movement of the day when Fed announces its unchanged Interest Rate decisions during the last 6 times. As you can see, the gold prices had been quite volatile during the last Fed decision on June the 16th and shed 1.45%. Since then, the yellow metal has not been able to overcome the loss and is in the downward trend.
Please note that this is shared for educational and informational purposes only and is not intended for financial decisions.
If you like the idea, please like and comment :)

Use ATR for Stop LossWhy is ATR indicator useful?
1) If we know volatility we know where to set stops and targets
2) Higher volatility = higher stops/targets
3) Lower volatility = lower stops/targets
4) This can be easily done using a calculator
Yes, there are websites with the volatility of all Forex pairs--you should confer with prior to taking any trades.
Please try using ATR indicator: ATR x 1.5 = Total Pips (for Stop Loss)

Profits & Stop Loss - Using ATR indicatorOn all pairs you trade you should know the daily ATR volatility and if scalping or day trading that time frames ATR too. The higher the daily ATR is the more volatile the pair, but easier I think to scalp or day trade with.
Rules to use ATR indicator for stop loss are:
1) Find the candlestick or setup that you would like to trade from, (example: 1 hour candle bullish pin bar on GBPCHF chart)- ATR is 12 pips
2) then times it by 1.5, so total would be 18 pips for stop loss
3) this will cover both most volatility of price action and spread ( low or very little getting stopped out on trades)
rules to use ATR indicator for profits are:
1) 1:1 risk reward would be 18 pips
2) 1:1.5 risk reward would be 27 pips
3) 1:2 risk reward world be 36 pips
Note: All three profit targets are noted (by black ARROWS) on 1 hour example chart of GBPCHF
I do not keep ATR on my charts, but just glance at it to set up both stop loss and profit targets and then delete it, this is so my other indicators can assist me after entering any new trades. This is one of the best indicators to use for stop losses and take profit targets, just manage your risk management and lot sizes.
Note: I always let price action come to me and chase price action, so after one hour red candlestick (used for ATR), I let price action reverse into my buy order above price action at open of red pin bar candlestick used to get ATR. Please put into your trading using ATR for both stop loss and profit targets.

Pivot Point StrategyIf you are scalping or day trading and use time frames under 4 hour, 1 hour, 15 minutes- then try this all pivot point strategy for one week.
Example chart is on a one hour time frame of GBPCAD.
Add:
Daily pivot points (RED line on chart)
Weekly pivot points (WHITE line on chart)
& Monthly pivot points (BLUE line on chart)
on your charts only (three sets of pivot points).
You can add trend lines, Elliot waves, fib ret etc... as needed overlaying charts when you are trading.
You could have had an easy three trades (two sells and one buy) on Fridays price action related to this pivot point strategy. Rules: if price action has stopped by one of these pivot points, set up either a breakout trade, or reversal of trend trade if an Harami, Engulfing or Pinbar pattern presents its self. Trading the pivot point strategy is great in-between Tokyo end of session to London end of session (12 hours). If two pivot point lines are close: like daily and weekly this area is stronger and harder for price action to break thru, if a weekly and monthly are close together this area is very strong and hard for PA to get thru.
Look what happened on chart example with price action around daily, weekly and monthly pivot points--- you can trade only these when scalping or day trading, please do some back testing on this... you will be very surprised by the positive results.

Smart Money- Pair,Price,Session & TimeIf you are a scalper trader or day trader you need to know always:
What pair are you trading (ADR, day of week, etc...)
What price is right now
What session(s) is open/closed now- start of session, middle or end
What is time- lunch in Tokyo, London or NY.
Smart Money- Where is the money- right now?
From example one hour chart of Friday (what do you see?)
You need to know support or resistance areas (bearish or bullish order blocks)
When price action could breakout or reverse from a manipulation phase- anticipation and catching these moves are early will give your set ups less risk and lower stop loss, especially if you scalp or day trade.

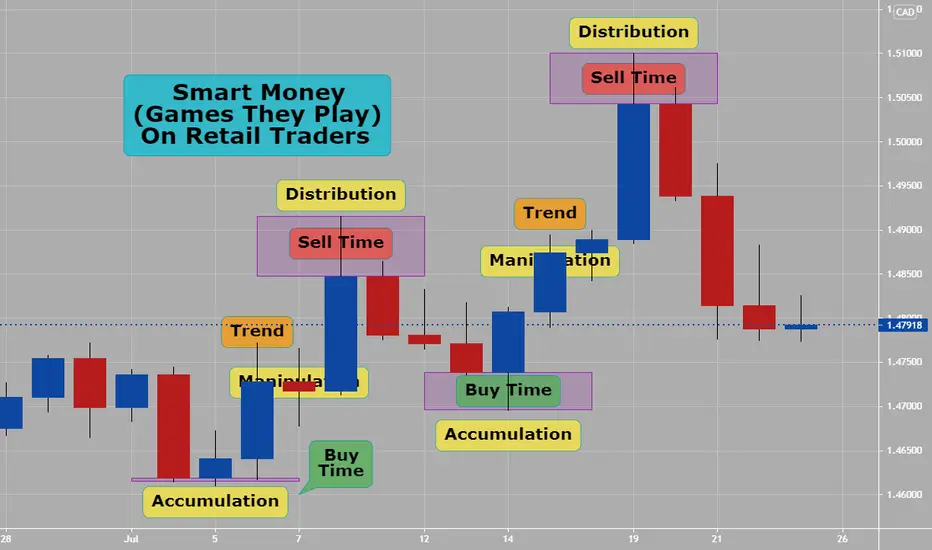
Smart Money- (Accumulation-Manipulation-Distribution)This is applicable to any time frames but example attached chart is daily.
You could be able to do this on any charts and will keep you trading with big banks or smart money.
Please practice this on charts- retail traders should never fight big banks but get on the trade ride with them.
On charts you need to be able to see and block in the following areas look like:
Accumulation (Buying) looks like in bull and bear conditions
Manipulation (Trend) looks like in bull and bear conditions
Distribution (Selling) looks like in bull and bear conditions.
Trading Forex is half trading edge, plan, risk management and other 1/2 is knowing what smart money is doing and how to trade to exploit it and win.
Let's talk about Candlestick Chart PatternsThe candlestick chart patterns are used by traders to set up their trades, and predicting the future direction of the price movements. There are many candlestick chart patterns. I will be discussing a few of those.
✅ Morning Star is formed after a downtrend indicating a bullish reversal. Generally made of 3 candlesticks, first being a bearish candle, second a Doji, and third being a bullish candle. The first candle shows the continuation of the downtrend, the second being a Doji shows indecision in the market and the third bullish candle shows that bulls are back in action.
✅ Bullish Hammer is a single candlestick pattern, which is formed at the end of the downtrend and shows bullish reversal. The real body of this candle is small with a long lower wick which should be more than twice the real body. This candle is formed when the seller pushes the price downwards but at the same time buyers arrive and push the prices up.
✅ Bullish Engulfing is formed after a downtrend, indicating a bullish reversal. It is formed when a bearish candle is fully engulfed by a bullish candle which shows that the bulls are back in the market.
✅ Three White Soldiers is a multiple candlestick pattern that is formed after a downtrend indicating a bullish reversal. It is formed when three consecutive bullish candles appear one after the other. These three candles show a strong bullish trend.
✅ Hanging Man is generally formed at the end of an uptrend and signals bearish reversal. The real body of this candle is small and is located at the top with a lower shadow which should be more than twice the real body. This candlestick pattern has no or little upper shadow.
✅ Dark Cloud Cover is formed by two candles, the first candle being a bullish candle which indicates the continuation of the uptrend. The second candle is a bearish candle that opens the gap up but closes more than 50% of the real body of the previous candle which shows that the bears are back in the market and a bearish reversal is going to take place.
✅ Bearish Engulfing is formed by two candles, after an uptrend indicating a bearish reversal. It is formed by two candles, the second candlestick engulfing the first candlestick. The first candle being a bullish candle indicates the continuation of the uptrend. The second candlestick chart is a long bearish candle that completely engulfs the first candle and shows that the bears are back in the market.
✅ Evening Star is made of 3 candlesticks, first being a bullish candle, second a Doji, and third being a bearish candle. The first candle shows the continuation of the uptrend, the second candle being a doji indicates indecision in the market, and the third bearish candle shows that the bears are back in the market and reversal is going to take place.
Thanks for reading and hope you like it.
Please comment and let us know your thoughts on it.
Happy Trading

End Of Tokyo 2 End Of London (12 hours)During these 12 hours per day are the highest liquidity and volume during the day, trading Forex. Why? Encompassing Tokyo/London overlap session then only London session then finally London/NY session overlap.
If you are day trading or scalping, these 12 hours are best for doing both. Use highest ADR pairs with either Gbp or Eur pairs, you should be able to with right risk management and set ups make piece of pip pie (or make a profit), on one to five trades depending on your strategy and trading edge.
On attached 15 minute chart you see up to 70 pips in bullish move during this high liquidity and volume move. Times noted are PST/USA times so please convert to local times. Keeping trading simple with price action always #1, then using maybe daily pivot points, session indicator and alligator- will lead to success.
Yellow lines are 4 hour divide lines and peach lines are noting the 9 pm to 9 am (12 hour) period which has high of both liquidity and volume.
If you do day trade, think about trading from main daily pivot point or (PP) to either S1 or R1 every day only, this will give you a very high win rate %, please back check. (noted on chart is main (P) pivot point (RED line) to resistance R1 (WHITE line)- would give you a 1:3 or more risk reward set up with 20 pip stop vs 70 pip target... with right risk management on this one trade and with trailing stop.

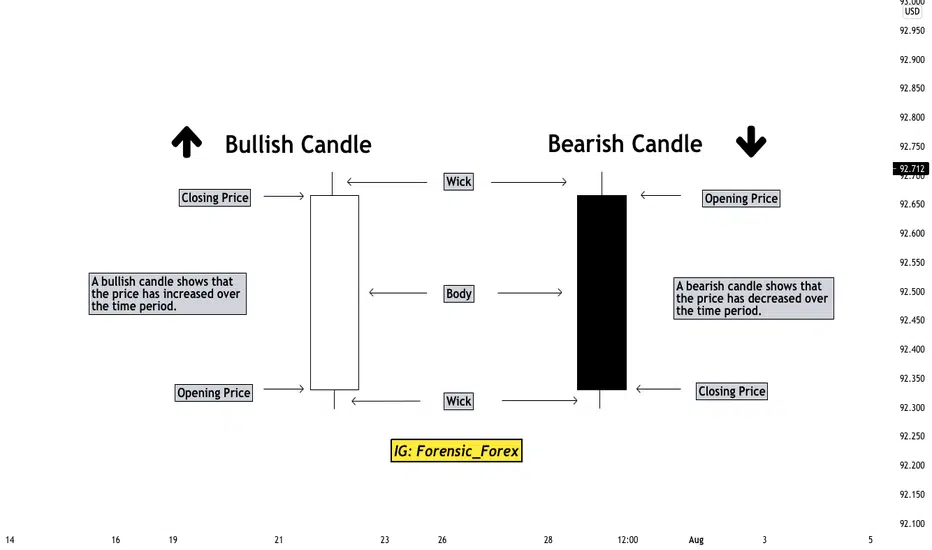
Candle Basics In forex you have two candles.
You have Bullish and Bearish candles.
Bullish candles are candles that show price movement upward.
Bearish candles are candles that show price movement downward.
Every candle has an Open, High, Low, and Close.
The meat and bones of the candle is consist of the candles "body"
You will also see many candles have wicks at each end.
This shows the highest point or lowest point that candle has
traveled to.
You can pick the colors you want to represent bullish or bearish candles.
For me I stick to white for bullish and black for bearish.
Candles do differ in size and wicks and can represent certain patterns.