Trend Key Points Guide And Best PracticesTrend Key Points indicator is a side tool for traders to specify the pivot points and key levels in trends. You can use this indicator in different ways, but I will tell you my own way. I got excellent results by going this way; I hope it will be useful for you as well.
Each trend has its high and low key points that are important in the next prices. Sometimes it’s hard to find out the points with a naked eye, this indicator marks these points and draws support and resistance lines from previous critical pivot points .
The indicator draws the last two support and resistances of the price by default but you can adjust it in the options. The best practice would be to include the levels drawn in the upper time frames in small timeframes.
I’ll explain it with an example. Let’s say I’m trading in the 4h timeframe. Starting from the above timeframe, I specify the key levels to the target timeframe I mean 4h. Assuming that the monthly levels are important in weekly, daily, and 4h timeframes. The weekly levels are important in daily and 4h timeframes and the daily levels are important in 4h timeframe.
Notice that I don't just settle for the levels drawn by the indicator, and I draw the flat and oblique trends I see myself.
If the key levels do not exist or are far away from the current price in the above timeframes you can rely on an important key point near or a level you think it's important. (w1 and w2 level drawn by myself from a key point)
If the level of higher timeframe overlapped the lower one, the level gains more importance.
After drawing multi-timeframe levels and trend lines, I’m going back to the 4h timeframe and I am looking forward to important price movements to be made at the drawn levels.
Which moves are important to me?
- If a new pivot high or a new pivot low appeared in the key levels or important trendline, I expect a return from there.
- If a new pivot high or a new pivot low appeared in the key level or important trendline and the volume confirmed the pivot, I expect a return from there. What I mean by volume confirm is that volume is greater than the volume itself. Volume confirmation means that the volume is bigger than the volume MA (20 in my case).
- If a candlestick pattern appears at the key level, the pattern will gain more importance. I use Abnormal Pin Bar and Common Candlestick Patterns Indicators for this.
Also, the indicator measures the length of each trend and calculates the average length of recent trends (15 by default). I named it movement step length (MSL). I use this info to predict the possible length of the current unfinished trend .
Usually, the length of the next trend is greater than the average length of the last trend specified by the indicator. Knowing this prevents me from exiting the unfinished trend early, which is quite possible when I'm nervous and have suspicions about the position.
I think the best part is that you can set an alert for the new key point crossing a price level. so you will not have to wait in front of the chart all day.
I am open to any improvement. If you have an idea or a suggestion, don't forget to leave a comment. Any feedback will be appreciated 😊
Candlestick Analysis

What are the candlesticks?Candlesticks are a way to express visually the size of the price movement.
There are different colors used for the candlesticks, but in pairs of 2: one color for an uptrend (usually marked in green) and one for a downtrend (usually marked in red).
Candlesticks are placed in graphics and by their movements create patterns. Starting from those patterns traders decide on a possible future pattern: where will/can the price go from now, based on the previous movements of the price.
On any chart, you can use more ways to see the price of an asset:
1. Candles - full candles (usually red or green)
2. Hollow candles - a full candle for a candle that show a downtrend (usually red) and an empty one for an uptrend (usually green and used only on the edges)
3. Bar
4. Line
5. Mountain
The main advantage of the candles is that they are more visual. In other words, you can see faster what is going on in your chart.
Why usually red or green?
The candles are said to show the emotions, so:
Red when something is not good
Green when something is loved/liked
Why do most people use the candles system?
The main advantage is that in any time frame you can see these prices:
1. Open price
2. Close price
3. High price
4. Low price
What are time frames?
There are many time frames: 1, 5, 10, 30 minutes / 1, 4 hours / 1 day / 1 week.
For any time frame chosen by the trader the pattern of the candles changes.
Depending on what you want to do (invest short, medium or long term) you look at different patterns/timeframes that the candles made.
The body of the candle represents the price range between a determined timeframe.
If the candle is red - the price is lower than 5 minutes ago (where 5 minutes is the selected timeframe)
If the candle is green - the price is higher than 5 minutes ago (where 5 minutes is the selected timeframe)
Sometimes the candle looks like a cross (the body for the candle is missing). That means that the opening and close prices are the same.
Any candle has 2 wicks or “shadows”:
1. Up - representing the maximum price
2. Down - representing the minimum price
There are bigger and smaller candles. Why?
The bigger the candle the bigger the price movement.
The smaller the candle the smaller the price movement.
If the up wicks are smaller it shows that the price closed near the maximum price of that timeframe. The same is valid for a down wick.
If the down wicks are bigger it shows that the price closed far from the minimum price of that time frame. The same is valid for an upper wick.

EDUCATION - Candlestick Cheat Sheet ⚡⚡One of the most powerful tools in your trading arsenal should be candlestick patterns. Various candlestick patterns can tell us where the market is heading.
These patterns can be found on all timeframes, however the Daily candlestick patterns appear to be the most reliable.
Once you see these patterns, you can ready yourself for the next move and use other tools to enter the market such as flag patterns, MA strategy - which we've covered before (See linked charts).

Know your escape plan. It's important to pay yourself!I've annotated my charts for your convenience. Enjoy

The Hammer (How To Trade)The hammer:
Puts in its appearance after prolonged downtrend. On the day of the hammer candle, there is strong selling, often beginning at the 3rd/4 hour candle of session. As the session goes on, however, the market recovers and closed near the unchanged mark, or in some cases even higher. In these cases the market potentially is "hammering" out a bottom.
In order for the Hammer signal to be valid, the following conditions must exist:
The FX pair must have been in a definite downtrend before this signal occurs. This can be visually seen on the chart.
The lower shadow must be at least twice the size of the body.
The 4 hour (example candle, see chart) after the Hammer is formed, one should witness continued buying
There should be no upper shadow or a very small upper shadow. The color of the body does not matter, but a blue/green body would be more positive than a red body.
Make sure pattern on 4 hour time frames happen during Tokyo session, can be on 1 hour time frame if they happen during London or NY session. (fyi)

Dragonfly Doji (How to Use It)A "Dragonfly" doji:
Depicts a time period on which prices opened high, sold off, and then returned to the opening price.
Dragonflies are fairly infrequent, but when seen on hourly, 4 hour or higher would consider trading them to the bullish side.
When they do occur, however, they often resolve bullishly (provided the Forex pair is not already overbought as shown by Bollinger bands and indicators such as stochastic).
Things to look for:
1) Dragonfly doji to happen in 1st 8 hours of a new session.
2) First 8 hours of new session is low liquidity and volume (during Tokyo session).
3) For scalping or day trading, I would make sure right pair, right price, right session and right time- for trading any FX pairs.
4) If you catch a pattern within the 1st 8 hours- you may be able to ride the trade thru the end of London session (this is end of all of my trades or earlier).
Example chart trade was set up on 4 hour session with a 1:1.5 risk/reward setup with is great if you are day trading a trade for 8-10 hours. Are you patience?

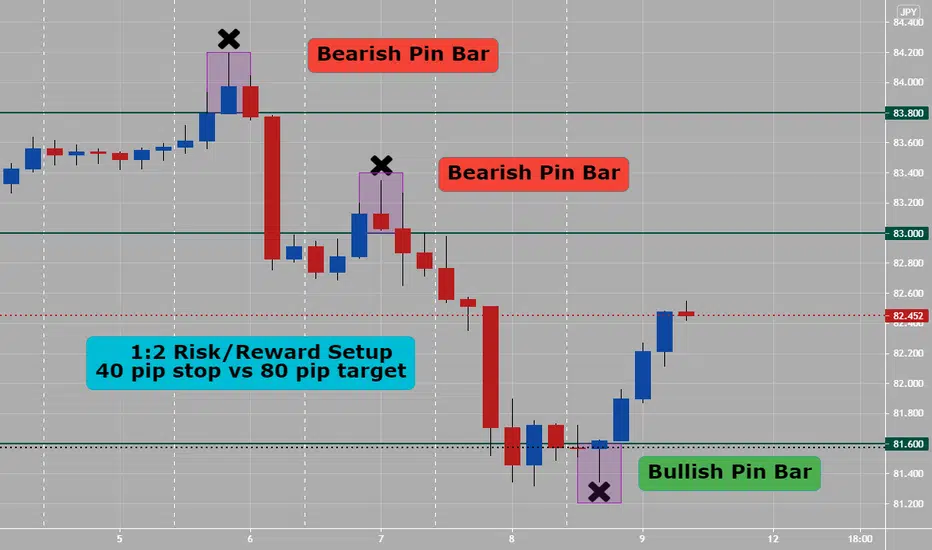
Breakouts (Keep Trading Simple)Breakouts
Violation of Trend Line, Support or Resistance, or previous reversal point.
It signifies that a change in buyer and seller behavior and signals the beginning or end of a trend.
See chart for more visual clues on how to trade this: 1:4 risk reward would have worked on this trade or 20 pip stop vs 80 pip target+.

AudJpy (Day Trade- How To Manage It)Patience is a must in trading Forex. Take a deep breath. Let trade work out. This AudJpy trade was an example of risking 25 pips vs target of 25 pips on the initial setup and then bring stop loss to lock in break even when New York opens for 25 pips vs 50 pip target. Let trade play out..

Sydney-Tokyo Overlap Session Do you trade AUD pairs? If yes, look for trends to start during the overlapping session with Tokyo: around 6 hr overlap time.
What To Look For:
1) Look on hourly charts for trends with AUDxxx or xxxAUD pairs to start during Sydney-Tokyo overlapping session (slow but great risk/reward setups)
2) See AUDJPY 1 hour chart example- excellent Harami two candle pattern to set up a bullish trade with. (placed in purple box on chart)
3) 81.500 price level is a highly psychological price level for big banks and realtor traders ( both, love price numbers ending with 000,250,500 or 750)
4) On chart is three indicators (that I use either alone or together) to get confluence with to enter a new trade: Yes, price action only with naked charts work.
A- Ichimoku Cloud- price action is above gold line or conversion line (so bullish sign)
B- Pivot Points- price action is above weekly pivot point or red line (so bullish sign)
C- Bollinger Band- price action is on or above 20 ema or middle yellow line and BB squeeze is starting (so bullish sign)
Note: With Aud pairs- look for trends to start during the Sydney session and both Sydney-Tokyo overlapping session- this AUDJPY bullish trade on hourly chart on Friday could have let you ride it for most of the daily session. Do not be greedy when scalping or day trading- get your pip piece of pie and close trade.
With all trading price action and risk management are both #1 (set entry, stop and targets for all trades)-

How to use Candlestick Patterns ..Hello Traders , Have a nice weekend.
it's good to learn something even if you knew it before,Seriously some of you know all these patterns but don't know how to use them.
First we have to draw our support and resistance area in higher time frames , then we switch to lower time frames to see a candlestick pattern and now you can enter the trade after a little price rest to have a better RR ratio guys.
Good Luck on that , As easy as you see

Harami/Inside Bar (3 of 3)Harami/Inside Bar
This pattern is a two-candlestick pattern in which the first candlestick vertically encompasses the one that follows it. This signal is interpreted in two ways:
1. An indication that an increase in volatility is imminent. This affords traders the opportunity to create trades that speculate not so much on direction,
but rather on an increase in volatility on a breakout in any specific direction.
2. In the context of a trend, a harami/inside bar can be indicative of exhaustion and the onset of a reversal. In this manner, it is similar to long wick patterns
and evening star/morning star patterns examined earlier in this guide.
Note: All three patterns in this series (Pin-bar, Harami and Engulfing) should be traded with a confluence of things like:
1) Support and Resistance
2) Trend lines
3) Fib Retracement levels (50% to 61.8%) golden zone
4) Remember: Pair you trade, Price right now, Session(s) open & Time it is. All of these are highly important in Forex trading.
5) Patterns at pivot points (daily, weekly or monthly)

Engulfing Candlesticks (2 of 3)Engulfing Candlesticks
The other important candlestick pattern I think price action traders need to have knowledge on is the engulfing candlestick. Like pin bar the engulfing candle is a reversal pattern, which means that a reversal is supposed to take place immediately after you see one form in the market. Unlike the pin bar the engulfing candlestick is a two bar reversal pattern, a pattern which requires there to be two candlesticks present in order for it's formation to be complete.
The formation of a bearish engulf is always a signal that a reversal to the downside is about to take place. The pattern itself consists of two candlesticks.
The bearish engulfing candlestick itself, which I've marked with an arrow, and the bullish candlestick that formed an hour before. The bullish candle is first candle required in the bearish engulf setup. This is the candlestick which the market will always engulf with a bearish candle immediately after it's formation.
In order for a bearish engulfing candle to form, a bullish candle must have formed immediately prior. You can't have a bearish candlestick engulfing another
bearish candle, it has to be a bullish candle in order for it to be a bearish engulf.
Bullish engulfing candlesticks are of course the opposite to bearish engulfing candles, which means their appearance is a sign the market is going to reverse
to the upside. Like the bearish engulfing candle they are also a two bar pattern, but instead of the first candle in the pattern being a bullish candlestick, like we see with the bearish engulfing formation, the first candle in a bullish engulfing setup will always engulf a bearish candle. A bullish engulfing candle cannot engulf another bullish candle, it can only engulf bearish candles.
Engulfing candlesticks are best used as signals to enter trades at pre-existing points where you expect the market to reverse, such as support and resistance
levels or supply and demand zones. They can be traded on their own without any other confirming factors being present, but in my opinion they don't tend to work out as well as pin bars do.

Pin Bar/Hammer Candlestick (Part 1 of 3)The pin bar is a single candle pattern which can be found forming across all currencies and all time-frames in the market. It falls into the category of price
action reversal patterns due the fact it's appearance is supposed to be a signal a reversal is going to occur. Although it must be said that very few pin bars actually cause large reversals to take place in the market, (I'll explain why in a minute).
Like most price action patterns the pin bar comes in two varieties:
The bullish pin bar, which signals a reversal to the upside may be about to take place, and the bearish pin bar, which is a sign a reversal to the downside is
probably going to occur. You can see that the vast majority of these bullish pins did cause the market to reverse once they had formed, but they didn't all cause it to reverse for the same duration of time. Some caused large upswings to take place whilst others only created small retracements.
Again, you can see that the pin bars which formed on here also caused reversals of varying sizes to take place. The reason why pin bars cause different sized reversals to occur, is because of the action that caused the pin bar to form in the first place. Pin bars and all the other candlesticks you see forming on your charts, form as a result of traders making decisions in regards to the market price. Pin bars happen to form exclusively from the bank traders either placing trades because they want to make the market reverse, or from taking profits off trades which they've already got placed.
The reversal created by the pin bar which has formed as a result of the bank traders taking profits off their trades, is naturally much smaller than the reversal caused by the pin which has formed from the bank traders placing trades to make the market reverse. It's obvious why this is, I mean if you took some profits off a trade you would want the market to continue moving in the direction to which your trade had been placed so you could make more money from the trade. The bank traders want the same to happen when they cause a pin bar to form from taking profits off their own trades, which is why the reversal caused by some pin bars forming are much smaller than the reversals caused by other pins forming.
Bullish and bearish pin bars are really good reversal patterns to watch out for if you're a price action trader, but they must be traded in the right way and you must understand why they form in the market. Most of the books and guides out there on pin bars do not teach traders what causes them to form, when it's knowing what causes them to form that will allow you to determine which pins have a high probability of working out successfully.
Head & Should Pattern (How To Trade)The Head And Shoulders Pattern
The first price action reversal pattern we're going to look at is the head and shoulders pattern. Without doubt one of the most popular and well known price
action patterns in the market, the head and shoulders formation is one which all price action traders need to memorize and understand if they want to become
good at spotting reversals using price action. As you've probably already guessed, the head and shoulders pattern is a reversal pattern which has a swing
structure very similar to that of person's head and shoulders.
You can see from the image the structure of the pattern does bear a striking resemblance to somebody standing up with their head straight and their
shoulders level with one another. Most head and shoulders patterns are supposed to look like the one you can see in the image above, but a large
percentage of them will actually have features which are a little different from one another. For example, you might see a pattern form with one of the shoulders being a little bit higher than the other, or the distance of two shoulders from the head will be smaller or bigger than what you can see in the pattern above. These small differences do not alter the pattern in any meaningful way. So long as the head is always found in the middle and the two shoulders are found to be either side, it's a head and shoulder pattern.
If the high of the right shoulder is found to be below the swing low of the move up which created the head, then it's not a head and shoulders pattern and should not be treated as such.
Rules:
1) measure from top of head to neckline for excepted target goal, once price action breaks neckline.
2) These patterns are infrequent, but powerful on 1 hour or higher time frames.

Alert-Confirm-Enter StrategyThe A.C.E. strategy is one of the easier ones to do if you scalp or day trade in Forex.
A- Alert Candle 1st one
C- Confirm Candle 2nd one
E- Enter Candle 3rd on
This can be done on bearish an bullish set ups:
1) ALERT- Look for the last trend ending candlestick. 1st candlestick (which is part of three bar pattern)
2) CONFIRM- Look for a longest trend ending candlestick (doji, pin bar, harami etc... (2nd candlestick)- top of this in bullish reversal is enter price and bottom of this in bearish reversal is enter price.
3) ENTER- Look for 3rd candlestick to go into new direction breaking top (bullish) or bottom (bearish) of 2nd candlestick to Enter trade.
4) Put stop loss above top of bearish trade or below bullish trade. For trade on 1 hour chart, I like 20 pips, with a 1:2 or higher risk reward setup.
Please look at example chart and look for many more on other one hour charts for pairs you trade. Keep trading as simple as possible. GbpAud.

MACD Divergence by MADO and how i use it to predict breakoutsFirst I want to give mad props to MADO for his/her Divergence MACD Indicator. I found this last night and this is what I have found while using it. Although it doesn't preplot every divergence I would like to see and there are a lot of other things I wish it did...maybe some programmer or Mado themselves would like to help put what I see all together into one indicator. That Said while using the indicator I found that not only can you predict when it will break out but also what it will do when it does, and how far it could go. I have only tested this on a few stocks as I just found this out and wanted to post it while I was discovering it. So its not polished and its not withheld in any way its exactly as I am discovering it. I will make a video again as the first 2 errored out due to my poor internet. lol
@MaDo if you are viewing this I want to give you mad props on this indicator. By far the best one I found and yes im using it not as intendid but thats how i use all indicators. If you are interested in helping me make a version of this with my twist to it I would gladly help you see it the way I see it so that you could. Feel free to reach out anytime.. That goes for any programmers that come across this. I see a lot of things most people dont due to my acquired savant syndrome and would like to share that with the world.
by iCantw84it
07.09.2021

3 FX Candlestick Patterns (To Increase Profits)Understanding the hidden meaning behind FX candlesticks is paramount if you intend to become consistently profitable.
1) The Pin Bar (reversal or continuation candlestick pattern)- The pin bar is my favorite of the three. These patterns consist of the following characteristics.
*Tail, which should be at least two-thirds of the entire candle
*The body, which is the space between the open and close (the color is irrelevant when distinguishing between bullish and bearish patterns)
*The nose, which is the much smaller wick on the opposite side as the tail
While pin bars can form anywhere on a chart, the best and most effective formations occur at key support or resistance.
2) The Inside Bar (continuation candlestick pattern)- Although a bit trickier to trade than the pin bar, the inside bar can be an excellent continuation signal if it forms within the right context.
*Hence its name, the range (low to high) should be completely inside of the mother bar, which is the larger of the two candles
*What makes the inside bar bullish or bearish is not how it forms but rather where it forms with respect to the current trend
*The color of the inside bar (bullish or bearish) does not matter
The bullishness or bearishness of the inside bar comes from direction of the established trend, not whether the inside bar itself is bullish or bearish.
3) The Engulfing Bar (reversal candlestick pattern)- Last but not least are the bullish and bearish engulfing patterns. Here's what you need to know:
*The range (high to low) of the engulfing bar must completely surround or engulf the range of the previous candle to be deemed valid
*To be effective, a bullish engulfing bar must form at a swing low while the bearish engulfing bar must occur at a swing high
Always remember that the bullish and bearish engulfing patterns must form at a swing low or swing high respectively or pattern should not be traded.

Last Two Hours Of London Session StrategyThis is how to go about trading this last two hours of London session strategy: Works on all Gbp and Eur pairs (and all Major pairs with USD).
This is either a scalp or day trading that will reverse mostly direction of current trade (sometimes continue) daily trend for 20 to 40 pips, during last two hours of London session.
1) First look at 4 hour time frame charts ( for trend, momentum and if pair is on support or resistance, etc..)
2) Then enter and exit of either the 5 minute time frame for best entries or 15 minute time frame.
3) I use 10 to 12.5 pip stop loss with targets 20 to 40 pips away depending on ADR (average daily range) of pair and where price is currently at in master Forex cycle of day or week.
4) With right stop, entry and targets this will give you a high winning rate (mostly reversal of daily trend) quick or around two hour profitable strategy, with right risk management. Please back-test.
The example chart is on a 15 minute chart related to Trading view not being able to post for public 5 minute charts, but mostly you want to enter and exit all trades via 5 minute frame for this two hour before London close strategy.
Would have been a 1:3 risk reward and or 10 pip stop vs 30 pip target- that is great within two hours. On the current example GBPCAD chart.

Shooting Star (How To Trade)Bearish Shooting Star
When it occurs, it will be at the height of a current uptrend
— typically an extended trend. It’s a lot like a shooting star falling from the heights of the heavens. At the end of that trend, the stock experiences one last
effort to push higher, only to reverse on itself. Hence the name, shooting star. It goes up, only to fall back.
Entry
Where would you enter?
More aggressive traders may anticipate the reversal as the candle is forming. Otherwise, you can wait until the close of the shooting star, enter, and set your stop at the high of the shooting star candle.

Trend lines (How To Use Them) Trend lines
General way of describing the behavior of price over time is the “trend.” A trend is simply the primary direction of price movement in the pertinent window of time. A number of “legs,” smaller-scale price trends that necessarily alternate between uptrend and downtrends – bullish and bearish legs, respectively.
When price remains closely within a diagonal range bounded by two parallel lines, this small price range is often delimited with “trend channels,” indicating
the upper and lower boundaries of the trend. When price moves within a horizontal range without moving in a clear directional trend, the price’s action is said to be in the “trading range.”
There are a few basic rules to bear in mind when drawing trend lines:
1. Tentative trend line - A diagonal line the market bounces off of twice. This trend line is indicative of a potential trend, but is not confirmed and actionable just yet. Two points touching the line, suggests the possibility of a trend in the making, though conventional analysis will not regarding the trend as established until there are three points on the line.
2. Confirmed trend line - The market has bounced off this trend line three times. Conventional analysis regards this as a sign that the trend line is real, and that the market will react around it.
It is easiest to trade from a trend when its highs or lows hew closely to a recognizable diagonal line, since this line may be used to predict future highs or lows. Opinions vary on whether trend lines should be drawn from the highs and lows of candles or from the body of the candle, the open and close prices; successful traders can be found employing either approach.

Tempted to short USD, but...Any counter-trend trader and the active trader will be tempted to short this candle formation. However, a matured trader will hold his horses and check if there's any upcoming Economic Data Release. You will see that there's one that's going to happen in less than 45mins time.
Remember, you are a trader, not a gambler.

Dow Theory, AppliedDow Theory is a foundational set of principles that underlies modern technical analysis. One of the main tenants of the theory involves trend confirmation by comparing similarities between equity indices' price behavior. Originally, the Dow Transportation Index was used to confirm trend direction in the Dow Industrial Index. Now things are a bit more complicated, with multiple indices covering a wide array of sectors and ever-evolving niche technologies.
To get a confluence of direction across the four major American indices (DJI, SPX, IXIC, RUT) to close the week has not been a simple task. I believe this is one of the reasons why a systemic selloff has been delayed in spite of the increasingly opaque economic picture. There are just too many cross-correlates that offset each other on the basis of what each sector "should" do in such-and-such situation. For example, the notion of fleeing to technology as a safety measure may have manifested as a "real" reaction in the middle of 2020, but it was the media's promulgation of such an idea that popularized it into today's common market wisdom. In any case, I would argue that fleeing into tech will work until it doesn't - and that day is looking closer by the hour. Literally.
Just take a look at the four charts displayed above - each of the four indices mentioned sports a bearish hourly candle to close the week. While this is subtle information, I was able to see the price action from a tape reader's point of view, and I will tell you that the price movement during this last hour was categorically different than any I have seen in months. This was real selling; institutional selling en masse. Each of the four underlying ETFs were seemingly stuck in quicksand for an hour and in order to confirm this back=end observation, I turned to the charts after the close.
The results depicted above depict consistent heavy selling across all four indices, in the form of nasty looking candles to close the session. Charles Dow and his then-clever, and now-accepted theory, would point to this as a prime example, were he still trying to convince the world of its validity.
While nothing is certain in markets, this is some pretty compelling data suggesting that, at the very least, there will be some serious volatility for the first time in a long time.
I'm short, but it's not so simple with the other side being a hysterical bubble and all. My suggestion is to get creative and take advantage of the four-way confirm.
-ConfirmPig
TVC:IXIC
CURRENCYCOM:US100
TVC:SPX
CURRENCYCOM:US500
TVC:DJI
CURRENCYCOM:US30
AMEX:IWM
TVC:RUT
