Order Types (How To Set Up)Order Types:
Market Order- Placed at market price
Limit Order- Entry or exit order placed above or below market
Stop Order- Entry or exit order placed above or below market.
Rules for Placing Forward Orders:
above current price:
BAS: Buy Above is a Stop Order
SAL: Sell Above is a Limit Order
below current price:
BBL: Buy Below is a Limit Order
SBS: Sell Below is a Stop Order
*YOU need to know this prior to trading Forex- always use a entry, stop and target order when entering any new trades. Risk management.
Candlestick Analysis

Top 10 Patterns (Engulfing) #10 BestBullish Engulfing and Bearish Engulfing Candlestick Patterns: Chart example is a bearish one hour that happened on GbpChf.
Engulfing Patterns are the strongest and most effective candlestick patterns.
The reason is that when they are strong enough, the market usually follows them strongly. They can be the beginning of the strong trends and reversals.
There are two kinds of Engulfing Patterns:
1. Bullish Engulfing Pattern- A Bullish Engulfing Pattern forms when a strong bullish candlestick opens below the close price of the previous candlestick.
Previous candlestick has to be a bearish candlestick. Then the bullish candlestick goes up and covers the whole body of the bearish candlestick. Finally, it closes above the open price of the bearish candlestick. This pattern which forms on a downtrend, is a reversal pattern and causes the downtrend to reverse and goes up. The formation of this pattern means that bulls have taken the control. It means they have been able to take the price up and close it above the open price of the previous bearish candlestick. The more the bullish candlestick engulfs the previous bearish candlestick, the stronger the reversal signal is:
2. Bearish Engulfing Pattern- Bearish Engulfing Pattern forms by a bearish candlestick that engulfs the previous bullish candlestick.This patterns forms at the end of an uptrend or a bull market:the bearish candlestick has a very strong body that has engulfed the body of two previous candlesticks:
That was just the general information about the Bullish Engulfing and Bearish Engulfing candlestick patterns. Indeed, you can locate many of these patterns on all charts and time frames.However, it doesn't mean that each of them can be known as strong reversal patterns that you can take and enter the market.
Therefore, you should know how to evaluate and gauge these patterns and choose the strongest ones to enter.

Top 10 Patterns (Harami) #9Harami and Harami Cross Candlestick Patterns. This reversal pattern is on my top 3 best, on 1 hour or higher time frames.
Harami in Japanese language means pregnant. This pattern forms by two candlesticks, the first one is bigger and the other one is smaller. The smaller candlestick is completely engulfed by the body of the first candlestick. It looks like a pregnant woman looking from the side:
There are two kinds of Harami. The one that forms at the bottom of a bearish market is a Bullish Harami. And the pattern that forms at the top of an uptrend is a Bearish Harami. Harami is a reversal pattern.
Although Harami is known as a reversal pattern, you have to be careful not to take any positions as soon as you see a Harami pattern forms on the chart, because this pattern is not that strong. Only on the longer time frames like weekly and monthly it can be considered as a reliable reversal pattern.
I do not trust it on the smaller time frames at all. Even if you trade this pattern on the longer time frame, having a reasonable stop loss is a must.
Only under one condition the Harami Pattern can be known as a strong reversal pattern. It is when it crosses Bollinger Upper or Lower Band. Some traders know this pattern as Inside Day Candlestick while its combination with Bollinger Bands makes it a profitable and strong reversal candlestick pattern.
Chart example is a Bearish Harami on a one hour chart that broke the upper band of the Bollinger band- that is why you could take the trade with confidence.

Top 10 Patterns (Pin Bar) #8Pin Bar patterns are in the top three patterns to know: Example is bearish pin bar with nose which happens at a high liquidity time and volume too.
Three types of pin bars are: Standard pin bar, Pin bar with nose and Pin bar with no real body.
In general, Pin Bars are two types. The bullish pin bar, and the Bearish Pin bar. Bullish Pin Bar signals Long or Buy trade entry, and a Bearish Pin Bar signals the Short or Sell trade entry. Use 1 hour, 4 hour or daily pin bars at major support or resistance for better results. Fib Ret tool helps & pullbacks work.
Every pin bar consists of a real body or a head. And a tail or long shadow.The real body is the difference between the opening price and closing price of a
candle. So, if the closing price is higher than the opening price of a pin bar, then this types of pin bars are called the bullish pin bar. And if the closing price is lesser than the opening price, then this types of pin bars are called the bearish pin bar. A bullish pin bar is the sign of buyer’s strength and a bearish pin bar signals the strong selling pressure of a certain security.
Based on the formation of pin bar, you will find 3 types of valid pin bars in a price action chart.
1- Standard Pin Bar: The first type of pin bar is the standard pin bar, this types of pin bars contains a real body and a long tail. They are the strongest than other two pin bars. You will see no extra shadow or wicks attached to the real body of this types of pin bars.
2- Pin Bar with extra shadow: The second types of the pin bar, is the pin bar with a nose or extra wick attached to the real body. These pin bars are also called as the hanging man. This types of pin bars shows less strong market momentum than the standard pin bars. The nose above or below the real body indicates the opposite directional force and hence shows weakness of the pin bar.
3- Pin Bar with no real body: This type has no real body but a tail. That means the opening price and closing price of the pin bar is same. The signal strength of this types of pin bar is very week. If you can find a strong bullish or bearish candle after these types of pin bars, then this patterns gives a very strong trading signal.

Top 10 Patterns (Wolfe Wave) #7Wolfe Waves:Example of a bullish Wolfe wave on 15 mn GbpChf chart. Can be both bearish or bullish and on any time frames.
The key to recognizing the setup is symmetry. Ideally, waves 1-3-5 are established with very regular timing intervals between moves.
The other key ingredient is that the wave 4 should revisit the price range established by waves 1-2 for the best results.
Another way to describe the pattern is that it comes as a rising wedge / channel in an uptrend, or falling wedge / channel in a downtrend. Wave 5 is often a false breakout move beyond the bounds of the pattern.
Unlike either bull or bear flags, the movement is in the same direction as the overall trend, with the overlapping waves giving signals that an impending reversal is taking shape.
This pattern has different names, depending on the source - Larry Pesavento describes the pattern as "3 pushes to a top/bottom" and uses Fibonacci relationships to confirm the setup (waves 3 and 5 are 127% or 162% extensions of the previous pullback.) Jeff Cooper uses "Cooper 1-2-3 swing" nomenclature, and Linda Raschke likes to call this setup "3 indians".
The unique quality about Wolfe waves, however, is the objective target projection from waves 1 -> 4. Despite the great explanation and examples provided on Bill Wolfe's site, I continue to get questions about how much I trust this setup. Very much so.

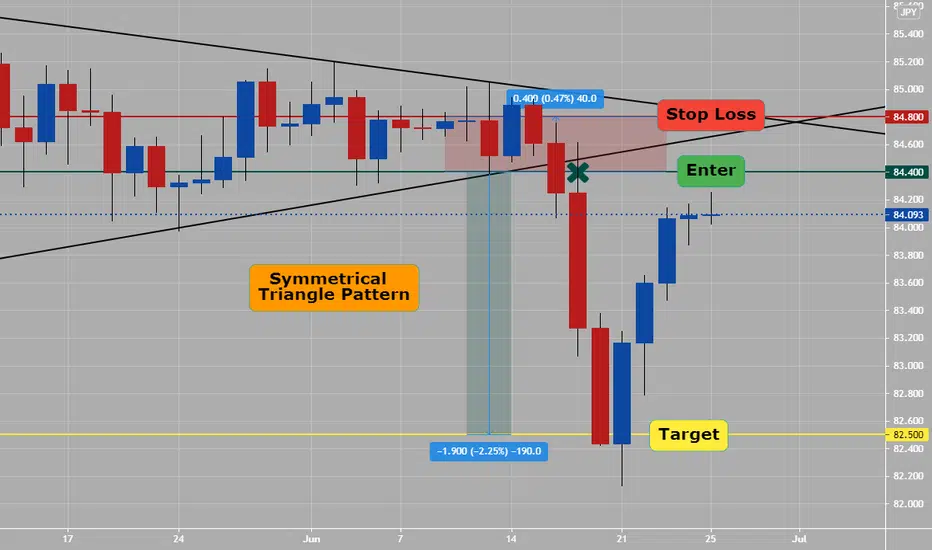
Top 10 Patterns (Triangles) #6Triangles: Example of bearish triangle on daily AudJpy chart
Triangles are also continuation signals like rectangle patterns and flags. Triangle patterns are three types: ascending, descending, and the symmetrical triangle, which is the most common of the three.
Ascending and descending patterns are similar to each other. The only difference is that the ascending triangle has a flat upper trend line. In contrast, the descending triangle has a flat lower trend line.
The symmetrical triangle has the unique ability to form during both up trends and downtrends of the market, and it appears with converging trend lines.
Confirming a continuation is also very simple with the symmetrical triangle as breakout points of the lower trend line during a downward trend is enough indication for the continuation of that downward trend.
Similarly, a breakout of the upper trend line during an upward trend is enough indication for the continuation of that upward trend.
Top 10 Patterns (Flags) #5Example of a bullish flag on 1 hour GbpAud chart: Any time frame and can be bearish too.
These are almost similar to wedges in characteristics. The only significant difference between the two of them is the trend line. Trend lines in flags are said to be parallel and not converging like the wedges.
Flags can be both bullish or bearish, depending on the circumstances. Bullish flags can be found during an upward market trend with the trend lines running paralleled above and below the price action. To get the confirmation for the continuation of the trend, look for a breakout just above the flag.
Similarly, you look for bearish flags during downtrends. They will be easy to spot since they form an upward slope.

Top 10 Patterns (Ranges or Rectangle) #4On 1 hour GbpChf example- sideways, rectangle, box or ranging price action- do not trade this. This is where a lot of money is lost by retail traders.
Now the rectangle is not a reversal pattern like the previous entries on this list. Instead, it is a continuation pattern, which means that it is generally used by traders to confirm whether or not a particular trend should go on.
You can either find a bullish rectangle or a bearish rectangle depending on the circumstances that create them. For example, you will find a bullish rectangle during an upward trend and a bearish rectangle during a downward trend.
It essentially depicts a trading area where the bulls and the bears compete with each other where they bulls push the price up when the price nears support. The bears move the price down when the price approaches resistance.
Look to trade either:
Breakouts or Breakouts and then pullbacks to enter any new trades.
Chart example showed a 1:2 or 1:3 risk reward setup. Be picky and be patience in the FX trading world.

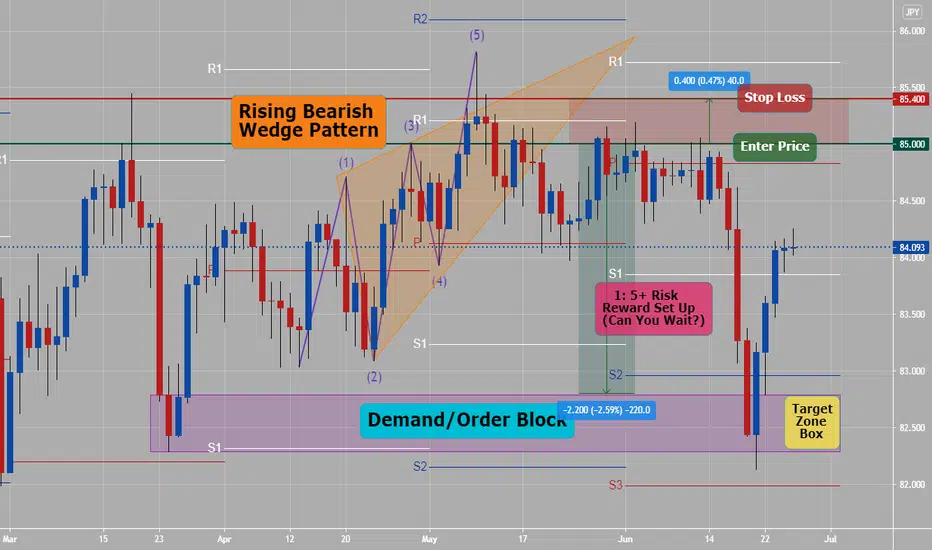
Top 10 Patterns ( Wedge Patterns ) #3Example on daily Aud/Jpy pair of a Wedge Pattern ( can be falling wedges and on any time frames):
Wedge patterns are of two types, falling wedge as well as the rising wedge. While the falling wedge is associated with bullish reversals, the rising wedge is seen as a bearish reversal indicator.
The wedge pattern has over three properties that a trader needs to look for if hunting for it on their charts.
Converging trend lines.
Decline in volume while the price is progressing through the pattern.
A breakout from any of the trend lines.
You can spot the rising wedge, usually when a currency's price has been climbing over a reasonable period. However, they have been known to form during a currency price's downward trend as well.
As for the falling wedge, it has been observed to form correctly when a currency's price has been on a decline for a while. The pattern's hot spot is just when the market trend is in its final plunge.
Of the two, the falling wedge has been noted to be more reliable than the rising wedge in terms of predicting the market's price trend.
How to be careful from misleading Indicators | XRPUSD reversalAny feedback and suggestions would help in further improving the analysis! If you find the analysis useful, please like and share our ideas with the community. Keep supporting :)
Quick glance: In our previous analysis on XRPUSD , we discussed about Ripple losing a massive market cap. Right now, XRPUSD had a massive reversal. It has taken support from the lower Bollinger bands.
Market in the last 24hrs
The last 24 hours were quite a roller coaster. All major cryptos witnessed a huge selloff including ETH, BTC, DOT and others. Trading volumes also spiked up tremendously.
Today’s Trend analysis
XRPUSD seems to be having a massive reversal. At the end of the downtrend on the 4H chart, there appeared to be a 'Hammer' formation. However, the patter could not be confirmed as the 2 following candles were red, thereby negating the reversal after the 'Hammer'. Stop losses would have been triggered for traders taking long positions after the hammer. Therefore, it is always crucial to wait for the confirmation candle, even if it eats into some of the potential gains. It hedges against fake-outs!
The reversal happened after XRP took support from the lower band of the Bollinger Bands. The volume profile shows the demand zone at $0.8688, which is 40% higher than current levels.
Price volatility remained extremely high at approximately 24.53%, with the day's range between $0.5231 — $.6514.
Price at the time of publishing: $0.6315
XRP's market cap: $29.04 Billion
Out of 11 Oscillator indicators, 9 are neutral,1 is bearish, and 1 is bullish.
Out of 15 Moving average indicators, 11 are bearish , 3 are bullish and 1 is neutral .
Indicator summary is bearish for XRPUSD in the shorter timeframe.
Volumes have spiked up tremendously in the past 24 hours.
----------------------------------------------------------------------------------------
The analysis is based on signals from 26 technical indicators, out of which 15 are moving averages and the remaining 11 are oscillators. These indicator values are calculated using 4Hr candles.
Note: Above analysis would hold true if we do not encounter a sudden jump in trade volume .
----------------------------------------------------------------------------------------
Any feedback and suggestions would help in further improving the analysis! If you find the analysis useful, please like and share our ideas with the community. Keep supporting :)

Tweezer Tops and why they're reversal indicatorsHey there. Highlighting one of my favorite candlestick patters, Tweezers.
Identifying:
Green bar. Red bar. Approximately same size bodies. Wicks are the same height. Ezpz.
The story:
During an uptrend, everyone is confident prices will continue to rise, so they continue paying more. "Bulls are in control" but really, it's just the average sentiment; prices are going up so everyone wants a piece before it stops. At some point, early entrants take their profits, prices stop rising, and drop a little bit. Some people get nervous and overall confidence drops a little. It retests the price level again, but more people sell so it fails again, and this repeat price-level failure lowers confidence even more. If the price falls back to where this whole thing started, "bears are now in control" but really people have just lost their confidence that price will rise; everyone thinks that the double-tested price level is the max, whereas before they though it would go to the moon. Positive momentum has shifted to negative momentum.
Different time frames
The fun thing is that this story is the same as that of a double-top reversal pattern, because that's what tweezers are: zoomed-out double tops.
Depending on the first bar's open and the second bar's close, it could also be an ascending triangle. So, you don't know if it's going up or down, but you know buyers are more nervous than before the pattern started.
If you were to zoom out from the double top, and then zoom out again from the tweezer top, the whole thing would look like a gravestone doji.
It would have the same open and close with a long upper wick (not the best example picture since this also has a long bottom tail, but hopefully you get the idea). But not every gravestone doji is a double tests, so tweezers tell the story of the markets a little bit better. At the end of the day though, they all say that prices ran up hard, got rejected, and fell back down hard. Not enough for a buy or sell signal, but if you identify a tweezer top, you now know important price levels and can make slightly better decisions about what will happen in the future if it rises above or falls under them.
Good luck!

DOGEUSD Target Price 0.16500000 Pin Bar DOGEUSD closed below 0.21380000 price level and retested that level in the form of a Pin Bar. Pin formed on the horizontal support resistance line and exponential moving average period 10 exponential moving average period 20.
Three factors for this trade strategy is Trend Level Signal. 1 Downtrend 2 Horizontal Level 3 Pin Bar.
The target is the previous swing low.


📚SPOT A MARKET REVERSAL WITH CANDLESTICK PATTERNS📚
Candlestick patterns are frequently applied for the identification of early trend reversal signs .
Here are the three most common reversal formations that you may encounter trading different markets:
1️⃣ - Equal inside bar formation
Once the price reaches some important pivot point quite often it tends to form a weak candle with a long rejection wick (long in comparison to the buddy of the candle).
In case if the consequent candle's body has the same range, we call that the equal inside bar .
It can be treated as the reversal formation ONLY with additional confirmation.
Without an additional trigger, chances will be high that the market will start a sideways movement instead .
2️⃣ - Engulfing candle
Once the price reaches some important pivot point quite often it tends to form a weak candle with a long rejection wick (long in comparison to the buddy of the candle).
In case if the consequent candle's body engulfs (has a bigger range) the previous candle, we call that the engulfing candle .
By itself, it is a quite strong reversal signal and can be applied as a trigger for opening a trading position.
3️⃣ - Engulfing candle (2X)
Sometimes, the engulfing candle engulfs not only the previous candle but also one more preceding one .
We also can call such a candle a high momentum candle .
It is considered to be the strongest reversal formation (among these 3) and can be applied as a signal for a trade entry.
❗️ Remember that candlestick patterns work only on strong pivots/structure levels. Being formed on random levels, the performance of these formations is relatively low.
❤️Please, support this idea with a like and comment!❤️

Bearish Wolfe Wave Day Trade SetupNice bearish wolfe wave day trading setup..look for them on 15 minute charts, with breakout at start of London session going to end of London session.

Why? Candlestick AnalysisCandlestick Analysis is the trading language used to understand trading Forex:
Cutting Through The Candlestick Hype-
The use of indicators will not increase the reliability of candles.
There are no advanced candlestick patterns, but there is a deeper understanding of price movements.
Why Use Candlesticks?
Provides a visual picture of what is occurring.
Gives visual insights into others’thoughts and expectations.
Gives visual confirmation signals of support and resistance.
Can visually align your thoughts with the market.
Can visually point to potential reversal points.
Candle Language Produces Thoughts-
Proper trading is said to be proper thinking, but how do we know what to think?
Pattern recognition is a recurring arrangement of price bars that suggests the future movement of prices, which guides our thoughts.
These patterns communicate how traders have acted and what their beliefs (expectations) are in that time frame, at the moment.
Candles provide a picture of those expectations on an ongoing basis.
Those pictures speak to us in “Candle Language”and are the basis for our continuous thoughts and trading decisions.
Miscellaneous Thoughts on Candlesticks: Attempting to define accuracy of candle names or patterns without considering the trend, support and resistance is useless.There are a least 50 different candle patterns, bullish and bearish. Some memorize them, but you will see this is completely unnecessary. While candles are very good at visually showing reversal signals, the signals that do Not work are often the most powerful! All that is needed is a chart of price bars --all else is secondary. While other analysis tools may add additional information, they can only follow existing price action.

How To Breakdown Charts? Learn everydayOn attached one hour EURCHF chart- what do you see? Make scalping or day trading easier by understanding candlestick language. What they are telling you.
1) Large momentum candles are sell or red
2) Two Head & Shoulder patterns
3) Both H&S patterns broken via 30% trend angle to downside
4) Best time to trade and sell today is during London and London/NY overlapping sessions
Look at hourly charts, 4 hr charts and daily and learn something about price action everyday. This will make trading FX alot easier for you.
Trading is about four things: winning big, winning small, losing small but never losing big.
To enter a new trade align up these four things: pair, price, session and time.

How To Trade The J-Hook PatternThe J-Hook Pattern
Normally it should be a signal of continuation of the current Trend.
– It occurs during an Uptrend; confirmation is required by the candles that follow the Pattern.
– The Pattern starts with a rapid increase in the Prices. (1)
– Then there is a Candlestick Pattern that gives a bearish signal (So the Traders start to sell). (2)
– The prices fall, then reach a level of “indecision”; at the end of this phase of indecision, there should be a Bullish signal. (3)
– The prices start to rise and they reach the Previous High (The one formed from the Phase (1) ). If the prices keep rising, going above this High, there should be a new Uptrend in Prices.(4)
– If the prices don’t go above the High, the Pattern has failed; in this case the Pattern creates the Double Top Pattern (A pattern from the Technical analysis).

Basic Elliott Wave CycleBefore beginning about patterns in concept, we must remember that there are 3 commandments, stated by R.N Elliott that are imperative to theory: (See attached 4 hour GBPCAD chart for example).
Impulse Wave 3 can never be the shortest wave
Wave 2 can never retrace beyond the start of Wave 1
Wave 4 can never cross into the same price area as Wave 1
These rules, just like all rules in general, are bent sometimes, so don’t be afraid to think outside the box and question everything. What I would suggest is that when one of these 3 rules are broken, then a review needs to be done for the wave count.
Wave Sequence:
In a Dominant Trend, progress ultimately takes the form of 5 Waves, which are labeled with
numbers; 1,2,3,4,5.
Three of these swings, which are 1, 3 and 5, affect the overall direction in favor of the Dominant Trend. These Swings are known as Motive Waves or Impulses.
Within the 5 Wave Sequence, the 3 Waves that unfold in favor of the Dominant Trend are separated by 2 counter-trend interruptions, which are labeled as 2 and 4. These Swings represent a temporary interruption of the Impulse Waves, hence why they are called
Corrective Waves.
Wave Principle states that; a Full Cycle is made up of 8 Swings. The Market moves with 5 Waves in the direction of the Main Trend with 3 Waves against it.
Once the Impulsive Phase is complete, then the Trend Corrective Legs unfold and act as a pull-back. Labeled A, B & C.

Trade Smarter Not Harder!!!On this GBPCAD 4 hour chart what do you see?
I see largest moves from 2 a.m. to 10 a.m. ( 8 hours) per day. * This is 4th and 5th- 4 hour candle on chart- you could go to hourly to set entries on any trades.
You need to ask yourself how can I catch the daily trend and make 40 pips to 80 pips daily on this pair? Break it down, risk management, lot size, etc...
If I use 4 hour chart, can I catch the trend with a larger stop loss and higher target, make sure you have a 1:2 or higher risk reward set up. So, could be 20 pip stop vs 40 pip target or higher per trade.
If you look at any 4 hour pair, you will notice when they move and do not move- just wait for trend of daily- do not trade side ways (unless you do that).
Also, before trades look for four things:
1) right pair
2) right price
3) right session
4) right time
* If three or four of above align up, then think of setting up a new trade.

These 4 Reversal Candlestick Patterns (Know Them)Please google, you tube or PDF all of these following FOUR candlestick reversal patterns, so you can win at trading Forex. (look at them on chart too)
1) Harami candlestick pattern- Bearish or a Bullish Harami, the pattern will contain two candles and the second will be smaller than the first. Harami actually means pregnant woman in Japanese, which makes sense when you consider this signal's shape: the second candle is enclosed within the body of the first. You can think of the second candle as the first candle's baby belly!
2) Pinbar candlestick pattern- A pin bar pattern consists of one price bar, typically a candlestick price bar, which represents a sharp reversal and rejection of price. The pin bar reversal as it is sometimes called, is defined by a long tail, the tail is also referred to as a “shadow” or “wick”. The area between open and close of the pin bar is called its “real body”, and pin bars generally have small real bodies in comparison to their long tails. The tail of the pin bar shows the area of price that was rejected, and the implication is that price will continue to move opposite to the direction the tail points. Thus, a bearish pin bar signal is one that has a long upper tail, showing rejection of higher prices with the implication that price will fall in the near-term. A bullish pin bar signal has a long lower tail, showing rejection of lower prices with the implication that price will rise in the near-term.
3) Engulfing candlestick pattern- The engulfing candlestick patterns, bullish or bearish are one of the easiest of candlestick reversal patterns to identify. Because these candlestick patterns are two-candlestick patterns, they are more valid and are often looked upon as reversal patterns. As with any candlestick pattern, the bullish or bearish engulfing pattern takes more priority depending on the time frame that they are formed on.
4) Doji candlestick pattern- A Doji is a candlestick pattern that looks like a cross as the opening price and the closing prices are equal or almost the same.
When looked at in isolation, a Doji indicates that neither the buyers nor sellers are gaining – it’s a sign of indecision. There are different types of Doji candlestick patterns, namely the Common Doji, Gravestone Doji, Dragonfly Doji, and Long-Legged Doji. Before acting on any signals, including the Doji candlestick chart pattern, one should always consider other patterns and indicators.
All of these can not be traded ALONE, but need other confirmation too trade. Like at supply and demand, in golden zone of fib (50%-62% area), etc...

Basic Market Maker 24 Hour CyclePlease see hourly example chart of Basic Market Maker 24 Hour Cycle: EurChf (1 Hour Chart)*Learn this 24 hour cycle if you scalp or day trade.
1) Tokyo- consultation
2) London- expand the range
3) New York- trend of day
*then price action repeats same cycle over and over..just there are different varieties of this cycle- so retailers need to be aware of these changes, on higher time frames of 4 hour, daily, weekly and monthly.
On attached one hour chart: You had three chances to sell EurChf during to days Marker Maker cycle, with proper risk management and stop loss.
In a downtrend, sell on a previous buy candle (green or blue on chart)- let price action comes to your trade, never chase a trade.
