(How To Trade) Diamond Pattern or ABCD PatternYes, possible 4 obvious trades on hourly chart of GBPNZD on Thursday (two sells and two buys), you need to ask yourself HOW could you have entered these trades with right risk management related to- lot size, entry price, stop loss and target? Diamond Pattern is a harmonic pattern.
What do you always need to be aware of is bigger picture, like the following: You should use support and resistance and Fib ret. tool in trading.
- What is GBPNZD doing on higher time frames, earlier this week, etc...
- What is GBPNZD current ADR?
- What pair are you trading?
- Any news events that have or will be happening? Noted: on chart two new events that actually were part of revering short term trends.
- What is current price? any psychological numbers around current price? triple 000 or 500 numbers on charts?
- What are sessions currently open? With GBPNZD on left part of chart is when Sydney is open, so AUD and NZD are being traded - what is price action doing?
- What is time in session? you would need to know exact time where currency is being traded: Convert Sydney time to your time, Convert Tokyo time to your time, Convert London time to your time and Convert New York time to your time.
Trading Forex is really not difficult, but you need to always with with big banks and not trade against them. You need to be able to understand candlestick language and what each one is telling you in the bigger context of price action. This is all about probabilities and if you employ a certain strategy or edge- how many times out of 100 trades would you win? not gambling!!!
Really, look at hourly charts and higher ones of any pair- put in the homework, take notes and be one with Forex- then you will succeed.
Candlestick Analysis

BTCUSD - 1dIf you notice that in the previous Bitcoin crash, there was a move during which the bearish move did not go above the previous candlestick, in other words, no previous candlestick broke until a long shadow candle (pin bar) was formed and Then a powerful ascending candlestick broke its previous candlestick and then an ascending movement was formed ... such movements are called micro-channel in price action ... and as you can see, a micro-channel is also formed in this fall. And we must wait for the failure of this micro-channel ...

Double Doji Strategy (Set Up example)Double Doji Strategy should be done on hourly, 4 hour or Daily, related to a lot more price action involved with each candlestick. Then break will be sudden and quick, when price action does happen to buy or sell side of doji's.
These double dojis do not happen that often, but when they do can be highly profitable set up and high win rate %.
Chart is GbpAud is 4 hours and shows a great example of this double doji strategy:
Rules:
1) Find two dojis at about the same price on charts (hr, 4 hr or daily)
2) Place an entry price one pip higher and lower then tallest and shortest doji
3) Once price action breaks either way, the other entry line becomes stop loss of trade.
4) The range of high and low of both dojis is doubled for target of trade. Ex: if doji range is like chart 28.4, then target above is 28.4 minimum.
Please adjust your lot size and risk management accordingly- when you enter any new trades.

The Hammer Candlestick PatternHammer candles- lower shadow (wick) is at least twice the size as the real body.
Hammers are price candle reversals to the upside or bull-side, so a possible buy trade could be traded afterwards.
Conservative traders would wait for confirmation candle or next candle to be completed, aggressive traders would trade open of next candle with right risk management.
Higher time frame charts are easier to trade, but these hammers occur on all time frames. Look for support and resistance, momentum, pivot points, etc...
These hammers will happen at end of downtrends and to the left of these candlesticks no other close price action will be noted, just empty space.

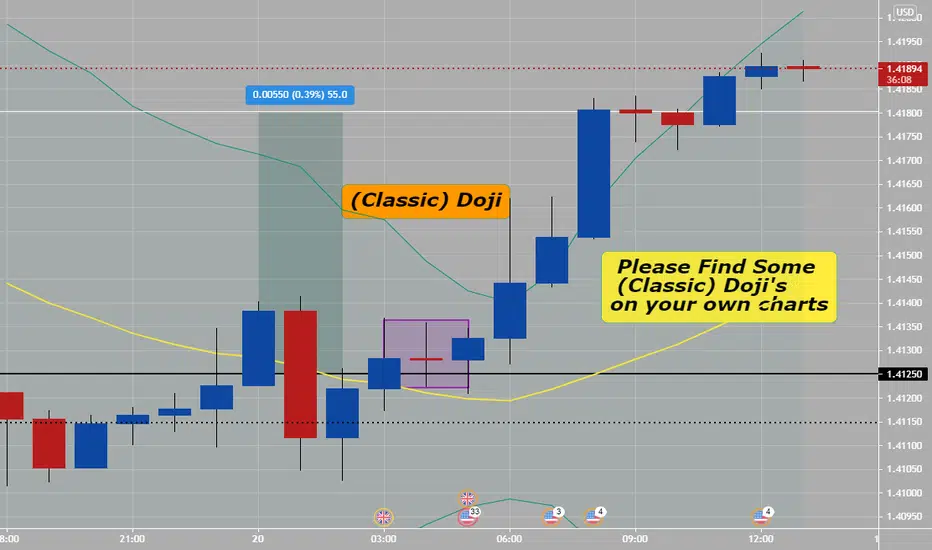
Doji Types: Classic Doji (Part 4 of 4)(Classic) Doji
Japanese name: doji
Forecast: lack of determination
Trend prior to the pattern: N/A
Construction:
- a doji candle
- appears on as a long or short line
- candle does not meet requirements to be considered as any of the following doji types:
- Long Legged Doji
- Dragonfly Doji
- Gravestone Doji
A doji can occur on any time frames, higher the better and if there are two or more on higher charts, when prices break- they tend to keep trending.
Doji Types: Gravestone (Part 3 of 4)Gravestone Doji
Japanese name: tohbo (or tohba)
Forecast: lack of determination
Trend prior to the pattern: N/A
Opposite candlestick: Dragonfly Doji
Construction:
- opening, closing and minimum prices are the same or similar
- long upper shadow (wick)
- appears on as a long line
Note: all doji's can appear on any time frames- higher the better for any price patterns of candlesticks.

Doji Types: Dragonfly (Part 2 of 4)Dragonfly Doji
Japanese name: taketombo
Forecast: lack of determination
Trend prior to the pattern: N/A
Opposite candlestick: Gravestone Doji
Construction:
- opening, closing and high prices are the same or similar
- long lower shadow (wick)
- appears as a long line

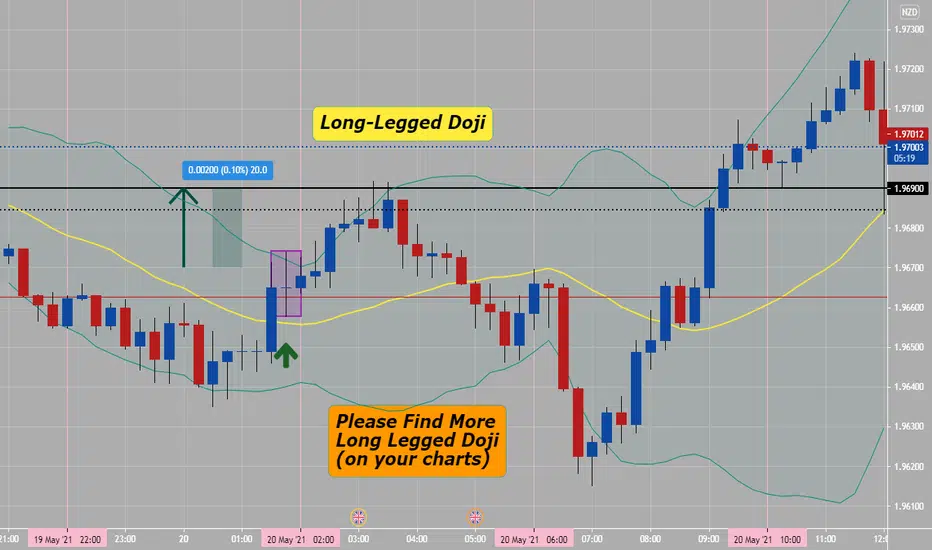
Doji Types: Long-Legged (Part 1 of 4)Long-Legged Doji
Japanese name: juji, yose
Forecast: lack of determination
Trend prior to the pattern: N/A
Opposite candlestick: none
Construction:
- a doji candle
- opening and closing prices are the same or similar
- upper and lower shadow are very long
- body is located in the middle of the candle or nearly mid-range
- appears as a long line
Bitcoin making a Bullish Harami. Identifying Candlesticks.Keeping it very simple today.
Big red candle to the left totally enveloping a green candle to the right = Bullish Harami.
It's ok that there is a big red candle to the left. That candle needs to be there or else the current green candle wouldn't be what it is (bullish harami). It's relative.
----
Remember: Never take trades off of candlestick identification alone. Combine with other elements.
*I have been trying to get off of caffeine lately, ok. Don't get upset because this isn't a challenging lesson.*

Double Doji Strategy (How To Scalp or Day Trade this ?)Sure, you can but as with most trading longer time frames are better. Look on attached 15 minute chart- I see around 3 buy trades after Double Dojis or more appeared at a minor or major support area- for quick scalps and/or a longer day trades.
For your convenience here is a summary of the rules:
1) Spot 2 Dojis in a row. it is better when they appear after a clear up or down trend ( minimum of 3 green/blue or red candles in a row).
2) Mark the upper and lower border of these Dojis highs and lows.
3) Wait for one of the borders to break. No need to actually wait, just insert 2 pending orders.
4) When one of the orders executed, cancel the other one.
5) Choose one of the three trade management methods and follow it to the letter.
6) Collect profits.
NOTE: Please see my previous posted article, related to using Double Doji Strategy on higher time frames.

Double Doji Strategy (How To Trade)The Doji pattern is one of the most incredible patterns among the Japanese candlesticks. For some reason it is not referred to very often. Maybe that explains why is is extensively used by professionals, not retailers. Only trade this pattern during high liquidity and volume times of session.
The Doji hints us that the market is in a state of balance of powers: the buyers strength has run out, but so is the sellers. So this is a state of temporary calmness, just before a major move happens. Note: a hourly or higher candle with a body of under 5 pips is considered a Doji.
The Doji may appear in variety of shapes, but the meaning of all of them is the same. The meaning is that the opening and closing price of the candle are the same. Remember that each candle represents a certain amount of time. For example (attached noted chart) is looking at a 1 hour (H 1) chart, each candle represents one hour of market activity. NOTE: this Double Doji Strategy works better on higher time frames: 1 hour, 4 hour and daily. (FYI).
RULES:
1) Identify 2 Dojis one after the other. It is preferable that the two Dojis will appear after a clear strong trend, for example an up trend or a downtrend.
2) You should mark the high and low borders of the two Dojis (place lines). As you can see on attached chart, I've marked the upper and lower borders of those two Dojis. Once top or bottom border is crossed, a move is underway so it is time to make a trade.
3) Place 2 pending orders. One if market breaks upper border of Dojis (1 pip above is enough) and one if market breaks the lower border (1 pip below).
4) For a buy (long) trade, place stop loss 1 pip below the Dojis lower border. For a sell (short) trade, place stop loss 1 pip above the Dojis upper border.
Now for the cheerful part of determining the profit target, or the amount of profit you expect to extract from this trade: 3 different methods:
1) Take Profit is equal to the stop loss ( attached chart is example of this one)
2) You open 2 identical trades. The first has a stop loss equal to the take profit. The second has a profit target which is double the stop loss. For example: Stop Loss is 50 pips and Take Profit is 100 pips.
3) Open one trade with a profit target which is half the stop loss. Lets say I determined the stop loss to be 50 pips, thus the first target would be 25 pips. This is where I'll close 80% of the trade. The second profit target, would be x2 of the stop loss. Or this example, take profit would be 100 pips.

Trend-Pullback-Breakout PrincipleThis T.P.B principle happens on all time frames, but if you are scalping or day trading (using 15 minute, 1 hour or 4 hour charts).
Key Principle:
Identify the trend. Watch for pullback. Trade the beak out.
1) Trend candle (TC)
2) Pullback candle (PC)
3) Break out candle (BC)
The above can happen on 1 candle each or couple or few candles- attach GBPNZD hourly chart is normal price action on hourly price chart, given the right pair, right price, right session and right time- of this possible sell trade with high liquidity and volume.
Underlying Principle: Risk cont through stop loss. The noted set up would have given you 1:3 risk/reward set up with 20 pips/60 pips.

Eur/Usd versus DXY (U.S. Dollar Index) Index Description:
The U.S. Dollar Index is a weighted average of the foreign exchange value of the U.S. dollar against the currencies of the group of major U.S. trading partners.
The U.S. Dollar Index is an index of the value of the United States dollar relative to a basket of foreign currencies, often referred to as a basket of U.S. trade partners' currencies. The Index goes up when the U.S. dollar gains "strength" when compared to other currencies. The index is designed, maintained, and published by ICE, with the name "U.S. Dollar Index" a registered trademark.
It is a weighted geometric mean of the dollar's value relative to following select currencies:
• Euro, 57.6% weight <----------------------- majority of U.S. Dollar index.
• Japanese yen 13.6% weight
• Pound sterling, 11.9% weight
• Canadian dollar, 9.1% weight
• Swedish krona, 4.2% weight
• Swiss franc 3.6% weight.
The Eur/Usd (FX pair) and DXY (U.S. Dollar Index) have a negative correlation related to Euro making up 57.6% of the weight of the DXY (or majority).
This last Friday the 14th of May what happened? DXY went down (sell) or lost strength while the EurUsd went up (buy) or gained strength (60 pips possible). Keep in mind while trade Eur/Usd pair, because this is the most traded pair in FX and also, most manipulated pair during London and New York sessions.

Do You Day Trade? (Part 2/2)You need to know that during the 3rd/4 hr candle or from 10:00 pm to 2:00 am (PST/USA)- please convert to your time zone, that most of the time the L.O.D. (low of day) or H.O.D. (high of day) is made, within that 4 hr candle. If you get that right, you can profit with right risk management.
There is a high correlation that 11:00 pm to 2:00 am PST/USA that the High or Low being established for the daily session, in the majority of the cases.
Attached chart example of GBPJPY 1 hour chart of Thursday, making a H.O.D. during this 3rd/4 hour candle of session, then price action dropping 80 pips.
This is why I use Daily, 4 hour and 1 hour mostly when scalping and day trading.
Do not fight big banks, if you are scalping or day trading- just jump on their train and go with it for success.

Do You Day Trade? (Part 1/2)You need to know that during the 3rd/4 hr candle or from 10:00 pm to 2:00 am (PST/USA)- please convert to your time zone, that most of the time the L.O.D. (low of day) or H.O.D. (high of day) is made, within that 4 hr candle. If you get that right, you can profit with right risk management.
There is a high correlation that 11:00 pm to 2:00 am PST/USA that the High or Low being established for the daily session, in the majority of the cases.
Attached chart example of GBPJPY 1 hour chart of Friday, making a L.O.D. during this 3rd/4 hour candle of session, then price action going 50 pips up. This is why I use Daily, 4 hour and 1 hour mostly when scalping and day trading.
Do not fight big banks, if you are scalping or day trading- just jump on their train and go with it for success.

japanese candlestick patterns (engulfingbar bar)the engulfing bar:
an engulfing pattern signals a reversal, and can be bullish or bearish. It comprises two candles. the body of the second one must engulf the body of the first one. There are two type of engulfing bars
The bullish engulfing bar that cosists of two candles. the bosy of the second candle is greater in size than the previous candle. This pattern is considered to be reversal, because when it appears in a downtrend, it signals a revesal.
The bearish engulfing candle consists also two candles, but it is the opposite version of the bullish engulfing bar . Be cause when it occurs in the end of an uptrend, it signals a future price reverse.

japanese candlestick patterns (pin bar)The pin bar:
It is candlestick pattern that consists of just one candle, it has a long lower wick and short body and little or no upper wick. Strictly speaking, the lower wick should be at least two times longer than the body, the longer, the better.
There are two types of pin bar , the bullish pin bar which is a reversal candle that occurs at the end of downtrend and reverse the trend. A bearish pin bar which is also a reversal candle that happens at the end of an uptrend and revers it
As you can see this chart, almost pin bar appear the trend will change reversal. This is one of the best in price action.

Introducing The Satoshi All Time History IndexStarting today you can chart, follow, and research the price of Satoshis going back to 2010. Our new index is called Satoshi All Time History Index.
Satoshis, or sats, are the smallest unit of bitcoin (BTC). 100,000,000 satoshis make up one Bitcoin.
Satoshis are particularly important to the Bitcoin community because transaction fees are often measured as satoshis per byte or satoshis/byte. This makes the unit important to chart, follow, and analyze in detail. In addition, some people see sats as a useful way of addressing unit bias – where people prefer whole units over a fraction of a unit.
To get started with our new index, type SATSUSD into the search box and select it from the list. You can also bookmark the SATSUSD symbol page or share the link where needed.
We hope everyone enjoys this new addition. Please leave any comments or questions below.
Thanks for reading!

Ethereum 05/13/21, Mean Reversion studyThis is a really simple (almost too simple) way of predicting the most likely number of candles before a revisit to a certain level, presuming no outside factors increase the required sample of study. I have just tried to predict very specific candle positions and times as well as the bottom, but this is only for the extreme near future (ie, the easiest to predict), past that it becomes harder unless you reduce your precision several factors.
This is an ideal situation where there is a clear median that it has clung to, and the standard deviations are very obvious and apparent.
Note: I am only counting candle bodies, not wicks.
edit: I also made the highlight before the current hour while I was writing this it seems to agree with me so far.

japanese candlesstick pattern (doji)The Doji is a candlestick where the opening and closing prices are the same (or almost the same). It can take many forms; as shown here; depending of what the trading activity was in that period.
The Doji candlestick indicates that neither sellers or buyers have gained control, and that price has ended where it began. It is a sign of indecision in the market. Let me show you an example below :
In the chart above, you can see different types of the Doji candlestick pattern. This candlestick gives us a clear image about what happened in the market during the specific time period. In this hourly chart above, the formation of the Doji means that buyers and sellers are equal, no one is in control of the market during one hour, which is the time of the Doji candlestick formation.
You can't use the Doji alone to make your trading decision, my goal in this first lesson is to help you read charts by being able to identify and understand candlestick patterns formation, so when you see the Doji candlestick pattern for example, you know that during that period of time the market was in an indecision phase and sellers and buyers are equal. This is the most important information that the Doji gives us when it forms in the market.

The Quarter's Theory (Is Price Action Random & Chaotic?)IS PRICE MOVEMENT RANDOM? No
There is a notion that price movement in financial markets is random and chaotic. Quarter theory suggest a clear pattern in price movement, challenging the notion that price movement is random. Quarter theory organizes the daily fluctuations of currency exchange in a systematic orderly manner.
Quarters Theory focuses on the 1000 PIP Ranges between the Major Whole Numbers in currency exchange rates and divides these ranges into four equal parts, called Large Quarters. Each 1000 PIP Range contains four Large Quarters and each Large Quarter has exactly 250 PIPs (1000 PIP Range/4 = 250 PIPs).
Can you day trade The Quarter Theory? Yes (Look at attached price action on GpbNzd 1 hour chart, between Tokyo end and London end.
The 100 PIP Ranges between two whole numbers in currency exchange rates are also divided by The Quarters Theory into four equal parts called Small Quarters. Each 100 PIP Range contains four Small Quarters and each Small Quarter has exactly 25 PIPs (100 PIP Range/4 = 25 PIPs). The numbers that mark the beginning and the end of each Small Quarter are given the name Small Quarter Points. Currency exchange rates fluctuate in orderly series of price moves from one Small Quarter Point to the next, measured in increments of 25 PIPs, in a systematic effort to complete an entire Large Quarter of 250 PIPs.
In order to monitor the price behavior of currency exchange rates within the range of each Large Quarter, The Quarters Theory establishes three important price levels within each Large Quarter:– The End of the Hesitation Zone,The Half Point, and The Whole Number preceding a Large Quarter Point (25 PIPs).
HESITATION ZONE:
The Hesitation Zone is the range of 75 PIPs above or below a Large Quarter Point. The Hesitation Zone is formed by the first three Small Quarters of 25 PIPs of each Large Quarter. The Quarters Theory uses the Hesitation Zone to identify successful or failed Large Quarter Transitions by distinguishing between decisive and indecisive entrance of prices into a new Large Quarter. If prices stay confined within the Hesitation Zone, the End of the Hesitation Zone can prove to be a difficult support or resistance level to overcome and may prevent further progression of prices beyond the range of the Hesitation Zone, leading to price exhaustion and unsuccessful completion of a Large Quarter. Only decisive price moves that target the end of the Hesitation Zone and do not break above (or below) the preceding Large Quarter Point on pullbacks are considered to be an indication of a successful Large Quarter Transition.

Drop-Base-Drop (4-4)One of the four basic patterns that exist in trading, is the Drop-Base-Drop (DBD ) when trading.
You now have one of the four of the patterns that exist in trading. Any of your more complex patterns that you’ve read about consist of a series of these patterns. I intentionally chose not to label any of the “classic” technical analysis patterns. One of the more interesting things I’ve noticed from my years of trading is the desire by people to make what should be simple into something very complex.
You should see some of the complicated charts I’ve been shown! Now, I mean no disrespect to the traders out there who use multiple Fibonacci-butterfly-overbought/sold-crossing-confluence indicators to trade, provided they are making money. If you are using all of that stuff and NOT making money, perhaps you should simplify your charts! It doesn’t get much simpler than these four basic patterns.
The drop-base-drop is the exact opposite of a rally-base-rally, with the only similarity being they both form during trending movements.
Whereas a rally-base-rally structure will always form a demand zone in the market, a drop-base-drop will always form a supply zone.
Both the drop-base-drop and rally-base-rally supply and demand zones are categorically the same, they both only form when the market is trending and they are zones which if the market returns to should push the price back in the direction of the movement which created the zone.
In the image on chart, a drop lower created the supply zone so if the market was to return to this zone it should push the market lower.

Rally-Base-Rally (3-4)One of the four basic patterns that exist in trading, is the Rally-Base-Rally (RBR) when trading.
You now have one of the four of the patterns that exist in trading. Any of your more complex patterns that you’ve read about consist of a series of these patterns. I intentionally chose not to label any of the “classic” technical analysis patterns. One of the more interesting things I’ve noticed from my years of trading is the desire by people to make what should be simple into something very complex.
You should see some of the complicated charts I’ve been shown! Now, I mean no disrespect to the traders out there who use multiple Fibonacci-butterfly-overbought/sold-crossing-confluence indicators to trade, provided they are making money. If you are using all of that stuff and NOT making money, perhaps you should simplify your charts! It doesn’t get much simpler than these four basic patterns.
The rally-base-rally is a type of demand zone which forms during an up-move.
The name from the market structure which creates the demand zone. In the example on chart, you can see first we have a rally, then a consolidation, and finally another rally which creates the demand zone itself.
A rally-base-rally will always from a demand zone, they never create a supply zone.
