The Curve -watch as Price bounces to set up for a bullish moveThe Curve is a visual representation of Wyckoff method although not designed with Wyckoff in mind it was made over a 9 month period of watching the market and making a ruleset that supports everything I saw in the market. There are 5 stages. Each stage bounces from Bollinger band top to bottom. Except stage 4 which is a continuation of 3 at the midpoint of a curve....usually in Re-accumulation. Price action will hug the upper bb a few candles before dropping to hit the bottom Bollinger Band for stage 5, also called The Spring/Launch. This then goes for a New high if retail is cooperating. it is also the lowest volume part of the curve. In this chart you can see institutional buying setting up to make a very bullish run as it fullfills each stage in just about 5 candles. Why else would it do this if not to full fill each stage and be on stage 5 going to stage 1 for the new high. Of course each stage breaks down into something else in wyckoff method. Which is usually:
1. Buyers Climax
2. Major sign of weakness
3/4. Into Up Thrust After Distribution
5. to Spring or final dip into liquidity
Finally back into
1. Which is the free ride up to create a new higher high.
All my ideas have the Curve represented or are part of the the analysis regardless if stated or not. It is the fundamental basis of how I trade.
As I never looked at any other teachings until 2 months ago when I found wyckoff as I was curious as to what the logical explanation of what I saw was.
Thank you.
if you like ideas like this or want to see more of these please comment below, like, subscribe, and share. As its the only way I can tell if you are actually into this or not.
by iCantw84it
06.08.2021
Candlestick Analysis

ACCUMULATION PHASE A : BTC Wyckoff Law Curve VisualWyckoff's three laws:
Supply and demand.
Cause and effect.
Law of effort.
Saved for personal and public curve representation and visuals on a large time frame.

Bullish and Bearish Trend | ForexbeeBullish Trend
Bullish trend refers to consecutive higher highs
and higher lows in the price of a currency pair in forex during a specific timeframe. it shows that there is strong buying pressure.
Bearish Trend
The formation of consecutive lower lows and lower highs in the price of a currency during a specific timeframe is called a bearish trend. It indicates strong selling pressure.

How To Trade Triangle CorrectionTriangle Correction:
In addition to the 3-wave correction patterns, there is another pattern that appears time and time again. It is called the Triangle pattern. The Elliott Wave Triangle approach is quite different from other triangle studies. The Elliott Triangle is a 5- wave pattern where all the waves cross each other. The five sub-waves of a triangle are designated A, B, C, D, and E in sequence.
Triangles are by far most common as fourth waves. One can sometimes see a triangle as the Wave B of a 3-wave correction. Triangles are very tricky and
confusing. One must study the pattern very carefully prior to taking action. Prices tend to shoot out of the triangle formation in a swift “thrust.”
When triangles occur in Wave 4, the market thrusts out of the triangle in the same direction as Wave 3. When triangles occur in Wave B, the market thrusts
out of the triangle in the same directions as the Wave A.
How do you trade triangle correction?:
You need to place two trend lines- one from b to d sub waves (above PA) and one from a to c to e sub waves (below PA)- In a bullish example (see chart)- once d to e sub wave is completed ( see noted long legged doji on chart)- this would have been your low risk high reward time to initiate a buy trade via daily chart.
Within 20 days (do you have the P A T I E N C E ?)- you would have made a 1:6 risk and reward on your investment- which is great.

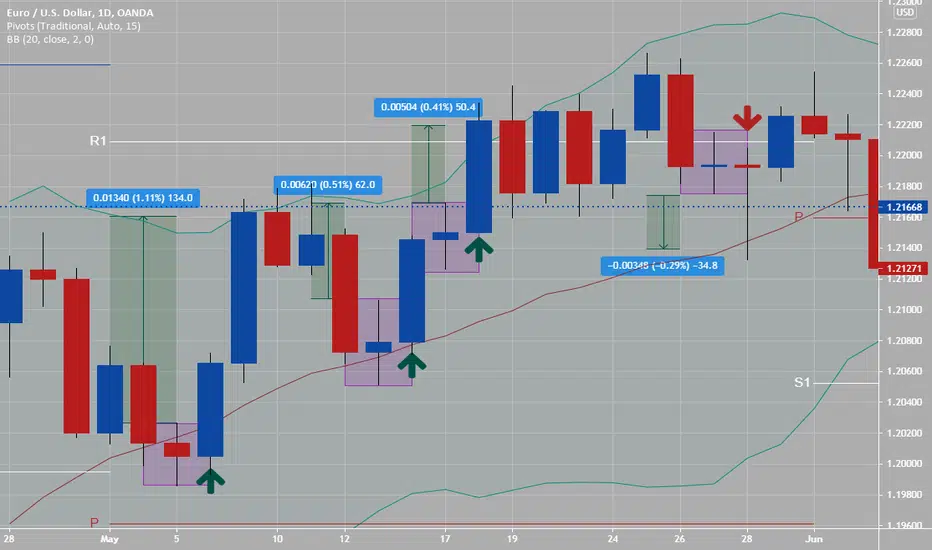
Persistent Supply or Demand Level In A Trend RotationSupply and Demand Forex – The driving force behind changes in price is supply and demand. When there are more buyers than sellers, the market price will move up. Conversely, when there are more sellers than buyers, the market price will move down. When buyers and sellers are more or less even, the market will range. These simple concepts are very powerful and allow us to analyze naked charts in order to determine where the price is likely to go.
Since the current price is determined by past prices, this is a very simple method of technical analysis and a highly successful trading style that makes it possible to identify a specific entry price, and a supply zone or demand zone. Stop-loss and take-profit levels are also easily identifiable. Supply and demand in Forex trading (SD for short) provides a simple no-brainier system that gives good profits. All this without all the complexity of technical indicators, but rather through the interpretation of the bare price action itself.
Supply and Demand Forex Analysis
The supply and demand concept is timeless. It will always be the simplest, most atomic way of explaining why price changes. This is because the market is the place where sellers and buyers meet to conduct the business of exchanging the product for cash.
By understanding the supply and demand concept, it will be very simple to spot SD zones on charts. Although this would be a hindsight observation, it will give us a good hint of where to look for our trades in the future. It is key to understand that the theory of supply and demand Forex trading is based on analyzing and defining zones in the past. These zones determine where should we expect the price to react in the future.
How to Identify Demand Zones on Price Charts: To identify a demand zone on a chart, we are looking for a large candle or series of candles in the same direction moving up and away from a ranging price zone. When this occurs, the area underneath the point where the candle breaks through the body of the past two candles is a demand zone. As you can see in the graph.
How to Identify Supply Zones on Price Charts: The method for identifying supply zones on charts is similar to identifying demand zones, only reversed. You will be looking for a large candle or series of candles that fall beyond the bodies of the previous two candles in a downward direction. The area above this is a supply zone. At this point, we are looking for a significant move in the direction of the large candle. The stronger the move, the stronger the demand or supply zone is. It also suggests that the price will move in the same direction again when the price returns to this level in the future. We want the price to stay away for a while. If it comes right back, it is not a significant move. In other words, we want the move to be significant in both price and time. We now know where to enter the market and where to set our stop-loss and take-profit

How To Trade Daily Doji CandlesticksA doji represents an equilibrium between supply and demand, a tug of war that neither the bulls nor bears are winning. In the case of an uptrend, the bulls have by definition won previous battles because prices have moved higher. Now, the outcome of the latest skirmish is in doubt.
After a long downtrend, the opposite is true. The bears have been victorious in previous battles, forcing prices down. Now the bulls have found courage to buy, and the tide may be ready to turn.
How I trade daily doji's (rules):
1) Place a news buy (long) or sell (short) order next session or daily candle.
2) Place buy order 1 pip above highest price action of daily doji candle
3) Place sell order 1 pip below lowest price action of daily doji candle
4) Which ever one is hit by the next sessions price action- the other order is turned into a stop loss order.
5) Examples of three buy orders and one sell order on daily EURUSD example chart- with possible pip profits of 30 pips to 130 pips.
These dojis occur on every time charts, but I tend to put more weight into using these on 1 hour, 4 hour or higher charts.
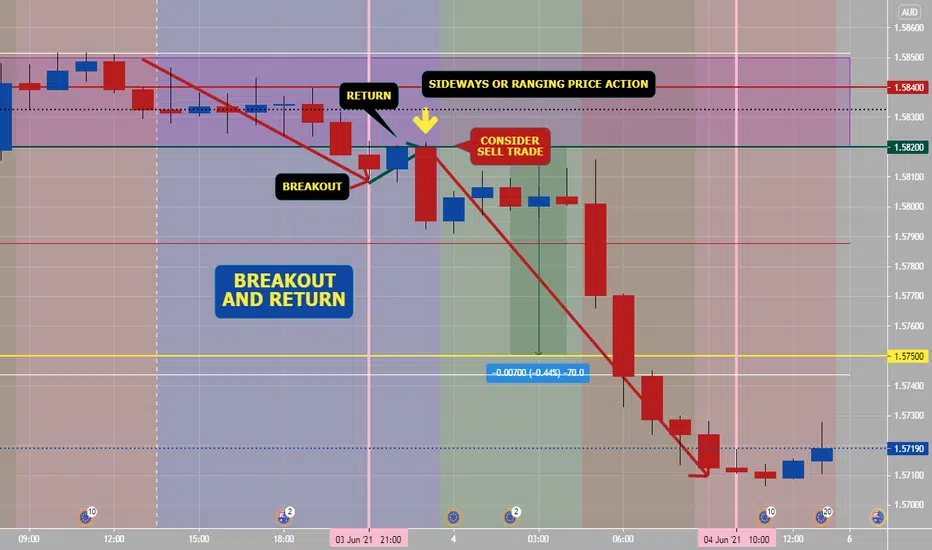
How To Trade Break Out & Return PatternAfter sideways price action, price action breaks out of range suddenly which you should let happen, then price action returns back into range- this is time that a trader should consider getting into a new trade (example: chart trade is sell break out and return trade).
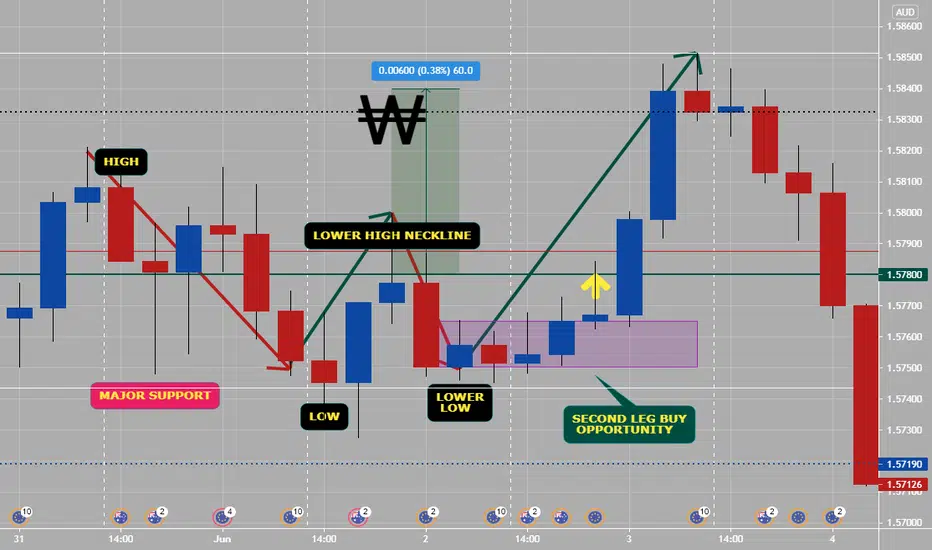
How To Trade "W" Pattern5 Tips to trade W reversal patterns:
1) Only trade W’s off the lows
2)Only trade W formations London & NY Session
3)Wait for the second leg stop hunt to the high/low of the day to confirm entry
4) Asian consolidation range should be very well defined
5) Always use proper risk management, if the Risk reward ratio is less than 1:3+ the trade is not worth taking
Each day there is a new high and low that is created.Trade the “W” formation reversal pattern at the lows.
This is a universal guide to trading W formations on any pair in Forex. This works on all time frames under the daily time frame. We recommend back testing everything we have highlighted in this post for greater clarity of the power you are tapping into!
The concept of trading M and W patterns
The retail trader masses may be dumb, but they are not that dumb. They will always continue to look for confirmation in order to validate their trades. So, we must understand the reverse psychology behind why the M and W pattern is such an effective reversal strategy. The confirmation the masses use to determine a trend is the creation of higher highs and higher lows in the case of an uptrend.
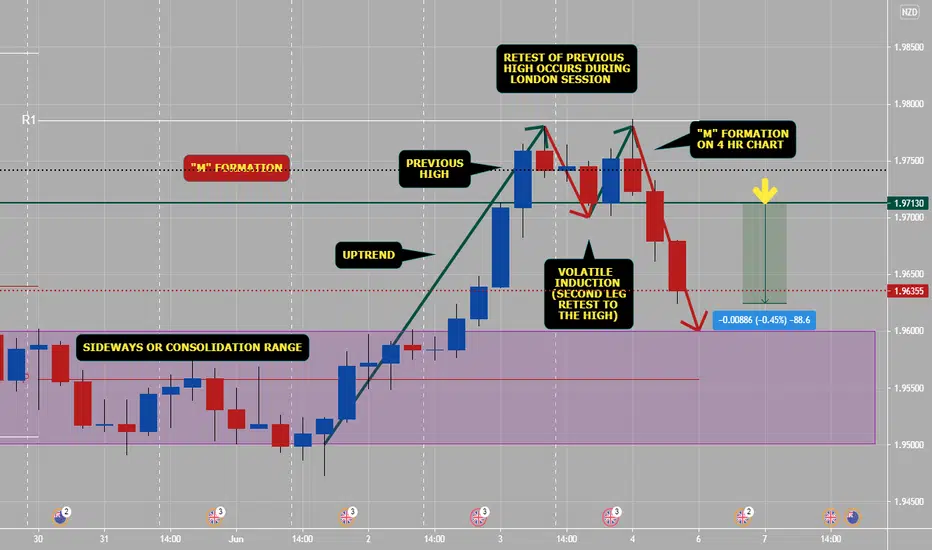
How To Trade "M" pattern (part 1)5 Tips to trade M reversal patterns:
1) Only trade M’s off the highs or overbought/supply areas.
2) Only trade M & W formations London & NY Session
3) Wait for the second leg stop hunt to the high/low of the day to confirm entry
4) Asian consolidation range should be very well defined
5. Always use proper risk management, if the Risk reward ratio is less than 1:3+ the trade is not worth taking.
These patterns occur on all scales and on all time frames. The time frame above is on the 4 hr, here we can clearly see the structure of the different sessions that occur on a daily basis.
The best sessions to trade are London Session and New York Session. These sessions will present the best reversal setups. Asian session should be avoided as there is very little movement.
Engage- Reversal Pattern -2 Extreme Reversal setupThe first Video on Education series - Engage - The Trade Setup
The first candlestick pattern that I will discuss is the wick reversal setup, which is a pattern that can spotlight some of the best reversal opportunities in the market.
studied from Book Secrets of a Pivot Boss: Revealing Proven Methods for Profiting in the Market
www.amazon.in
Happy learning.
( Education purpose for all )

Heikin Ashi Charts vs. Candlestick ChartsFollowing price action is at the core of markets. One glance at a chart can show you a trend, trade idea, or serve as a quick way to check the holdings in your portfolio.
Candlestick charts are one of the most popular ways to look at price action. A single candlestick shows the high, low, open, and close for a specific time period. This means that a lot of price information is stored in a single candlestick . However, sometimes, that price information is filled with volatility or chaotic trading.
That's where Heikin Ashi charts are most useful - they smooth out the price by showing an average price range rather than the exact measurements. In fact, Heikin Ashi charts were developed in Japan and the word Heikin means “average” in Japanese . For those who invest over long-term horizons or look for sustainable trends, Heikin Ashi charts can be an effective way to smooth out price and show clearer trends.
The key to understanding Heikin-Ashi charts is to remember that each bar, whether it's red or green, shows an average price range for a specific time period whereas a candlestick chart shows the exact price levels for that time period.
The formula for a Heikin Ashi looks like this:
Open = (Previous bar open + previous bar close) / 2
Close = (Open + High + Low + Close) / 4
High = Highest point whether it's the open, high, low or close
Low = Lowest point whether it's the open, high, low or close
Make sure to test out these two different chart types and have some fun. There is no better way to learn than to compare and contrast the two types of charts as we are doing in this example. Remember, it is also about your personal preference. Do you want to see every granular detail in price action? Or do you want to see an average price of that trading action? This is entirely up to you and the tools are here for you to try.
NOTE
While Heikin Ashi and other non-standard charts can be useful to analyze markets, they should not be used to backtest strategies or issue trade orders, as their prices are synthetic and do not reflect bid/ask levels at exchanges or brokers. If you need more information to understand why that is, have a look at these publications:
• In the Help Center: Strategy produces unrealistic results on non-standard chart types (Heikin Ashi, Renko, etc.)
• From PineCoders: Backtesting on Non-Standard Charts: Caution!
Thanks for reading and please leave any comments or questions if you have them!
Comment : P.S.
Someone asked how they can select Heikin Ashi. Click the dropdown at the top of your chart where it currently shows either your Candlestick or Line chart options. Then select Heikin Ashi from the dropdown menu.

Bull or bear beat holding +249.2% over a year, in profit in MayAs traders we look to capitalise on all sort of markets, not just parabolic runs. Today we are exploring how to run a long strategy even when the bulls are not in control.
WILL POST LAST 50 POSITIONS BELOW
We are looking for an strategy that:
1. has been beating buy and hold all year
2. Has a drawdown of max 15% in may 2021
3. Is simple to execute and automate
Not all candlestick patterns are created equal, and they do not work on all markets. However they do work in crypto, at least based on experience as they are not tough to identify and speculators tend to react to them.
This is why we focused on candles that are not that difficult to identify and are very clear in meaning.
The strategy (FULL INSTRUCTIONS):
On the 30 min timeframe:
We are going to open a position when the candle is a bullish Engulfing
We are going to close the position when the candle is bearish Marubozu
No stop loss or take profit, these are the only rules we follow, but we follow them a 100% of the time.
The results:
The strategy brought in 249.17%, beating holding. If you started trading this a year ago with 1 Bitcoin, you would be 2.4917 BTC in profit at the moment. What's even better the max drawdown throughout the year was 22.7% and it was actually in February.
During May we were only 11% down at a certain point.
This provides a Sortino Ratio of 5.44 which is a stellar mark for these volatile markets.
The positions:
31/05/2021 04:30
31/05/2021 14:00
10 hours
OP 0.06681
CP 0.068884
+3.1%
29/05/2021 21:30
30/05/2021 19:30
22 hours
OP 0.065407
CP 0.067746
+3.58%
29/05/2021 00:30
29/05/2021 18:00
18 hours
OP 0.068427
CP 0.066952
-2.16%
28/05/2021 07:30
28/05/2021 14:30
7 hours
OP 0.069574
CP 0.069572
-0.00287%
25/05/2021 18:00
27/05/2021 19:30
2 days
OP 0.068144
CP 0.071024
+4.23%
24/05/2021 00:30
25/05/2021 03:30
1 day
OP 0.061435
CP 0.067043
+9.13%
22/05/2021 22:30
23/05/2021 12:30
14 hours
OP 0.062197
CP 0.0581
-6.59%
22/05/2021 11:00
22/05/2021 17:30
7 hours
OP 0.064251
CP 0.06059
-5.7%
19/05/2021 22:00
20/05/2021 21:00
23 hours
OP 0.066705
CP 0.068997
+3.44%
17/05/2021 23:00
19/05/2021 07:00
1 day
OP 0.075193
CP 0.074787
-0.54%
17/05/2021 06:30
17/05/2021 09:30
3 hours
OP 0.076593
CP 0.077412
+1.07%
14/05/2021 13:00
15/05/2021 14:30
1 day
OP 0.079504
CP 0.078525
-1.23%
13/05/2021 16:30
13/05/2021 23:30
7 hours
OP 0.076788
CP 0.074242
-3.32%
12/05/2021 10:30
13/05/2021 15:30
1 day
OP 0.075732
CP 0.075619
-0.149%
11/05/2021 06:30
12/05/2021 10:00
1 day
OP 0.071125
CP 0.075353
+5.94%
09/05/2021 16:00
10/05/2021 11:00
19 hours
OP 0.06759
CP 0.069748
+3.19%
07/05/2021 13:30
09/05/2021 00:30
1 day
OP 0.061147
CP 0.065733
+7.5%
05/05/2021 01:30
06/05/2021 23:30
2 days
OP 0.061121
CP 0.061832
+1.16%
03/05/2021 00:30
04/05/2021 22:00
2 days
OP 0.05225
CP 0.061328
+17.4%
01/05/2021 22:30
02/05/2021 05:30
7 hours
OP 0.051064
CP 0.051111
+0.092%
30/04/2021 19:00
01/05/2021 15:00
20 hours
OP 0.048829
CP 0.049703
+1.79%
30/04/2021 09:30
30/04/2021 16:00
7 hours
OP 0.051113
CP 0.047849
-6.39%
29/04/2021 08:30
30/04/2021 02:30
18 hours
OP 0.050351
CP 0.051114
+1.52%
28/04/2021 10:00
29/04/2021 00:30
15 hours
OP 0.04799
CP 0.049829
+3.83%
27/04/2021 00:00
27/04/2021 19:30
20 hours
OP 0.046896
CP 0.047795
+1.92%
26/04/2021 10:00
26/04/2021 13:00
3 hours
OP 0.046466
CP 0.046378
-0.189%
24/04/2021 21:00
25/04/2021 13:30
17 hours
OP 0.045035
CP 0.046231
+2.66%
22/04/2021 20:00
24/04/2021 17:00
2 days
OP 0.04791
CP 0.044796
-6.5%
19/04/2021 12:00
22/04/2021 18:00
3 days
OP 0.039343
CP 0.04728
+20.2%
16/04/2021 10:30
17/04/2021 19:00
1 day
OP 0.03943
CP 0.039117
-0.794%
15/04/2021 18:00
16/04/2021 05:00
11 hours
OP 0.039286
CP 0.039291
+0.0127%
13/04/2021 17:30
15/04/2021 17:00
2 days
OP 0.0363
CP 0.039141
+7.83%
13/04/2021 14:30
13/04/2021 17:00
3 hours
OP 0.03575
CP 0.035968
+0.61%
12/04/2021 11:00
12/04/2021 12:30
2 hours
OP 0.035761
CP 0.035598
-0.456%
11/04/2021 03:30
12/04/2021 09:30
1 day
OP 0.035639
CP 0.035866
+0.637%
10/04/2021 21:00
10/04/2021 23:30
3 hours
OP 0.035761
CP 0.035688
-0.204%
08/04/2021 22:30
09/04/2021 13:30
15 hours
OP 0.035729
CP 0.035448
-0.786%
08/04/2021 02:00
08/04/2021 18:30
17 hours
OP 0.035231
CP 0.035636
NA
+1.15%
05/04/2021 05:30
06/04/2021 19:30
2 days
OP 0.035409
CP 0.036274
+2.44%
02/04/2021 13:00
04/04/2021 03:00
2 days
OP 0.033704
CP 0.035098
+4.14%
01/04/2021 13:30
02/04/2021 04:00
15 hours
OP 0.032793
CP 0.033349
+1.7%
30/03/2021 06:30
31/03/2021 22:00
2 days
OP 0.03138
CP 0.032743
+4.34%
27/03/2021 09:00
30/03/2021 02:30
3 days
OP 0.030822
CP 0.031326
+1.64%
26/03/2021 02:00
27/03/2021 04:00
1 day
OP 0.03114
CP 0.030919
-0.71%
25/03/2021 16:00
25/03/2021 20:00
4 hours
OP 0.031273
CP 0.030754
-1.66%
23/03/2021 17:30
23/03/2021 20:30
3 hours
OP 0.030826
CP 0.03091
+0.272%
20/03/2021 15:30
23/03/2021 00:30
2 days
OP 0.031261
CP 0.030839
-1.35%
20/03/2021 00:00
20/03/2021 05:30
6 hours
OP 0.031174
CP 0.031295
+0.388%
18/03/2021 18:00
19/03/2021 03:30
10 hours
OP 0.030665
CP 0.03087
+0.669%
17/03/2021 07:30
17/03/2021 18:00
11 hours
OP 0.031816
CP 0.032216
+1.26%

Pin BarPin Bar, which is short for 'Pinocchio Bar,' is a single
candlestick setup that clues price action traders into
potential reversals in the market. A pin bar is an elongated
wick that 'sticks out' from price action. When you see a
Pin Bar, be aware of a possible change of direction.

Market Cycle (Stop-Accumulation-Trend)On a 24 hour market cycle or longer time frames- these cycles happen all of the time. If you can figure out which phase current price action is in, you can make your trading easier and more profitable.
Remember: S.A.T. or Stop-Accumulation-Trend
Example of Today's sell trade from a breakout and return then going into trend for the day.

24 Hour Daily Market Cycle (Key Phases)24 Hour Daily Market Cycle
Key Phases:
Accumulation Phase
Stop Hunt Phase
Trend Phase Of The Day

Engage- Reversal Pattern -1 Wick ReversalThe first Video on Education series - Engage - The Trade Setup
The first candlestick pattern that I will discuss is the wick reversal setup, which is a pattern that can spotlight some of the best reversal opportunities in the market.
studied from Book Secrets of a Pivot Boss: Revealing Proven Methods for Profiting in the Market
www.amazon.in
Happy learning.
( Education purpose for all )

The Cycle Parts: Trend PhaseThen, what happens after they consolidate 60 minutes or so, they will start the trend run against their original move.
Trend Phase:
Once they set the high of the day off of the break, they'll start the channel, and run the trend down for 6-8 hours. If you're going the wrong way, it's a nightmare! It's slow, relentless, and it just keeps going, and going, and going. You think it's going to hold, and you start making up stuff in your head, and seeing things in the charts that aren't there. You start making up reasons to validate why you were wrong instead of understanding the true market structure. After the trend runs 6-8 hours it will go into the low of the day, and the same behavior is seen. They'll make an M at the high, a W at the low.
How you can profit from this market cycle?
Understanding this cycle gives you a major edge in your trading! Once you can identify it on the chart, taking trades is simple; second nature even.
Just initiate short positions once the high is set for the day, or long positions once the low is established. Your stop loss for short trades is placed just outside the dealers grasp, above the high, or for long trades, below the low. If you are correct in your assessment, your stop will rarely be triggered, because the dealer will not move the entire market just to grab your stop loss. You see, if he does, he will allow other traders to exit their trades. How many times have you told yourself that if price comes back on a bad trade you will simply click out? Market makers are aware of this, so they come near previous levels but don’t break them. This is added confirmation that you have obtained an excellent entry!
24 Hour Market Maker Cycle: Find this on all time frames- once you spot different phases - trading will become easier and stops and targets too.

The Cycle Parts: Stop Hunt PhaseLet's say they have 3 trillion dollar in short-holders, and 1 trillion dollars in long-sellers. Guess who's getting punished today? Short-holders. It's simple. It has nothing to do with the 1 hour, 4 hour, which way it's pointed, or which way it's going. It's where the dollar volume is built up that they can do the most damage, and collect the contracts. (See: Chart Example)
Stop Hunt Phase:
Sometime between 1 am EST and 4 am EST, they'll break out of the Asian range in 3 swipes. They'll quickly change the high of the day, settle in, and work it for 30-90 minutes. This is a two- pronged approach. The reason they use the number three is because we are stubborn. They hit it one time, and we think, "Oh, maybe it's not really going that way. It'll come right back." They hit it a second time, and we think "Oh, I'm missing it!" They hit it a third time and you finally get excited and give in that you were wrong, and switch your direction. Now, you've changed in the wrong direction, which is their first break-out of the Asian channel, to get you to recommit your money the other way.
What happens when they break out of the range is they trigger the stops of the weak short-sellers, the people that put their stops on the other side of the Asian range, people who put their stops 7 pips below the candle. That's all garbage...they hit them! They cancel out this volume, and get those traders to recommit their funds long. So, let's say half of the people come back. in, and the 3 trillion dollars has now become 3.5 trillion dollars long. What is the goal for the market makers, now? To get that money! How do they do it? There are a lot of people that trade the ABCD patterns (AB=CD), the Fibonacci extensions: when the market makers make their pullback, they make one more pass toward the high of the day. When they make this pass, people put pending orders right above the high. The job of the market makers is to go to the high, open the spread, trigger the pending orders, and validate all of the patterns that can be found in textbooks. When they fire those pending orders, all of those pattern traders are now stuck. They quickly pull off of the high of the day 25-50 pips, to trap the traders in that cycle, and hold them there.

The Cycle Parts: Accumulation PhaseFirst of all, let me ask you, "Have you ever heard of a market maker?" Others will tell you they don't exist in Forex market: that the Forex market is too big to be manipulated. Well, I'm here to tell you otherwise. There is a small elite group of traders that do in fact control how market will play out on any given day.
The beauty of what I am about to share with you boils down to this: These manipulations are visible on the chart to the trained eye. Once you see the behaviors and understand what they mean, you will be able to trade like a market maker!
Accumulation Phase:
At 5 pm EST, the high/low are reset. The price comes in,and the market makers make a quick push up, 15-25 pips. They make a quick pull back down, and then go sideways. They push it again 15-25 pips. Why would they do this? When they push up, you're a buyer, and they sell to you. When they push down, you're a seller, and they'll buy from you. They are accumulating contracts, and building up the volume.
Have you ever heard of 1 hour, 4 hour, daily, trade in the direction of the trend? Why doesn't trend following work? It's not about the trend, it's about the money. All the market makers do is wait for the money to build up during the accumulation phase, and see where the contracts are accumulated.

Which Candlestick Pattterns Work Best with Bitcoin?What is the daily closing price of bitcoin? It doesn’t have one. It is actively quoted 24 hours a day, seven days a week.
Most securities have a start and endpoint. Even the euro closes at the weekend, but not bitcoin.
“What is the close of bitcoin?” may sound like an odd question, but it is crucial for candlestick analysis.
How can you have a bitcoin candlestick with no candle close?
Traders have used candlestick charting techniques for literally hundreds of years. We can say they have stood the test of time.
Traders continue to use this ancient technique because it works. (If it did not work for them, they certainly would have stopped preferring to display their daily bars as candles long before now.)
Know the Candlestick Patterns
These patterns work best in bitcoin and, sometimes, better than in other markets.
What other candlestick patterns would you add in this list?🧐

Day Trading With Fibonacci Extension (Buy)Set up on USDCAD 15 minute chart with fib retracement extension tool:
1) Right Pair? Yes- USDCAD
2) Right Price? Yes, Enter at 1.20400 with stop at 1.20300 (10 pips)
3) Right Session? Yes, end of London beginning of London/New York session overlap. This is in the highest liquidity and volume times daily of trading Forex, which is from 10 pm to 10 am PST/USD time or from Tokyo end to London end.
4) Right Time? Yes, both USD and CAD are trading during New York session and London/New York overlapping session .
Using a Fib retracement and/or Fib retracement extension is great for setting targets, depending how deep initial retracement or reversal goes back into break out zone.
This set up would have been a great trade: 1:3.5 Risk/Reward setup or (10 pips/35 pips). Have patience and let trade work. You can only control when you enter and exit a trade- rest is up to price action.

Day Trading With Fibonacci Extension (Sell)Example of using Fibonacci Extension to day trade with: EurNzd 15 minute time frame today:
1) Right Pair? Yes, EurNzd during both London and London/New York overlapping sessions. (Both Gbp and Eur pairs are great r/t being in session). Have high liquidity and volume.
2) Right Price? Yes, Enter sell at 1.69500 with stop at 1.16950 (15 pip stop).
3) Right Session? Yes, During London session and London/New York overlapping session.
4) Right Time? Yes, after break out of price action and return back into golden zone (38%-62% area) of Fib. retracement area.
NOTE: Waiting for the initial break of range or sideways price action and return back into the golden zone of Fib. retracement area gives you one of the safest and best risk and reward set ups in day trading Forex. This one was 1: 2 Risk/Reward setup (15 pip risk/stop/30 pip reward/profit).

What Is A Valid Pin-bar Candlestick?The pin bar candlestick pattern is one of the best candle patterns available and one of the most reliable candlestick reversal formations you can see on the Forex or stock market. The pin-bar candlestick can be seen frequently on Forex charts and the best tradeable pin-bars are usually located at the end of impulse waves, and extend outside of the preceding price action.
These are the three conditions or rules to use in verifying a valid trading price action Pin Bar:
1) The price opens and closes within the previous candle
2) The wick is 3 times the length of body
3) The wick must stick out from all other candles ( no candles left of right of this candle)
Please see chart example of a valid daily time frame bearish pin bar. thank you.
Always use price action #1, risk management when trading. 1:2 risk reward should be minimum set up on any trades or higher..
