Don't Trade These Trend Lines | Forex Trading Basics
A lot of traders apply trend lines for trading and making predictions on different financial markets.
Trend line can also be an important element of price action patterns.
However, only few knows that some trend lines are better to be avoided.
In this article, I will share with you the types of trend lines that you should avoid and not rely on for making trading decisions.
Invalidated Trend Line
Even the strongest trend lines may lose their significance with time.
Before you take a trade from a trend line, make sure that it still remains valid.
If the trend line is not respected by the buyers and then by the sellers,
or by the sellers and then by the buyers, we say that such a trend line lost its significance, and it is better to not trade it.
Have a look at that rising trend line on USDCAD.
We see strong bullish reactions to that, and we may expect a bullish movement from that, once it is tested.
However, it was violated and after a breakout it should turn into a vertical resistance.
Retesting that, the price easily went through the broken trend line.
The trend line lost its significance, and it is better to not trade that in future.
2 Touches Based Trend Line
When you are looking for a strong trend line to trade, remember that the trend line should be confirmed by at least 3 touches and 3 consequent bullish / bearish reactions to that.
Above is the example of a valid and reliable trend line.
However, quite often, newbie trade 2 touches based trend lines.
Most of the time, such trend lines are neglected by the market.
Moreover, relying on 2-touches-based trend lines, your chart will look like a complete mess.
Simply because there are too many trend line meeting that criteria.
Receding trend line
There are the trend lines that go against your trade with time while remaining valid.
Have a look at a major falling trend line on NZDCHF on a daily time frame.
You may open a swing long position from that on a daily or a day trade on intraday time frames like an hourly.
You can see that the market may easily go against your predictions for a long time, while perfectly respecting a trend line.
The price was sliding on that trend line for 6 consequent days before it finally started to grow.
Such trend lines are better to be avoided .
Make sure that a trend line and your trade have the same direction.
Trend lines can provide very safe points for trading entries. However, the trend lines are not equal and while some of them can be very profitable, some of them can lead to substantial losses.
❤️Please, support my work with like, thank you!❤️
Candlestick Analysis

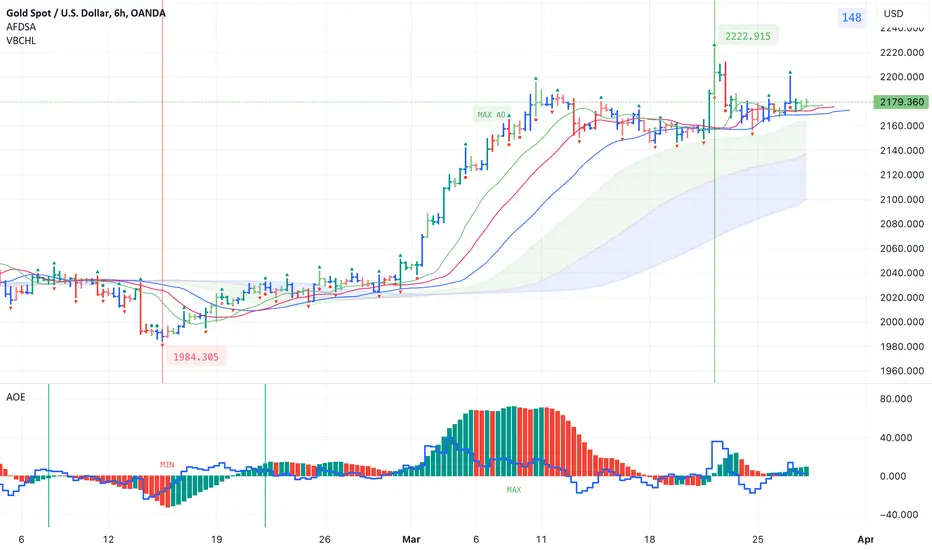
Indicators for trading using Bill Williams' Profitunity strategyI published 3 indicators for trading using Bill Williams' Profitunity strategy. For each indicator, I have added a visual and detailed description in English and Russian. In this post I will briefly describe these indicators and how I use them together.
AFDSA indicator (Alligator + Fractals + Divergent & Squat Bars + Signal Alerts)
Includes Williams Alligator, Williams Fractals, Divergent Bars, Market Facilitation Index, Highest and Lowest Bars, maximum or minimum peak of the Awesome Oscillator, and signal alerts based on Bill Williams' Profitunity strategy:
Bullish and Bearish Divergent Bar Signal + Squat Bar + Green Bar + Fake Bar + Awesome Oscillator Color Change + AO Divergence.
Crossing the green line (Lips) of an open Alligator.
Formation of a fractal.
Signal about the breakdown of the last upper or lower fractal.
Signal about the appearance of a new maximum or minimum peak of AO in the interval of 140 bars from the last bar.
I also added an Alligator display for the higher timeframe, for example, if the chart timeframe is 1 hour, then the higher timeframe will automatically be 4 hours, if the chart timeframe is 4 hours, then the higher timeframe will be 1 day, etc.
AOE Oscillator (Awesome Oscillator + Bars count lines + EMA Line)
Includes the Awesome Oscillator with two vertical lines at a distance of 100 and 140 bars from the last bar to determine the third Elliott wave by the maximum peak of AO in the interval from 100 to 140 bars according to Bill Williams' Profitunity strategy. Additionally, a faster EMA line is displayed.
I also added display of the AO line for the lower timeframe instead of the EMA line if the Moving Average Line values (method, length and source) are equal to the Awesome Oscillator values in the indicator settings. For example, if the chart timeframe is 1 day, then the lower timeframe will automatically be 4 hours, if the chart timeframe is 4 hours, then the lower timeframe will be 1 hour, etc.
VBCHL indicator (Visible bars count on chart + highest/lowest bars, max/min AO)
The indicator displays the number of visible bars on the screen, including the prices of the highest and lowest bars, the maximum or minimum value of the Awesome Oscillator. The values change dynamically when scrolling or changing the scale of the chart, but with a delay of several seconds, so this feature is included in a separate indicator so as not to slow down the work of other indicators.
Indicator settings
In the AFDSA indicator I use the following settings:
By default, the Squat Bar is colored blue, and all other bars are colored to match the Awesome Oscillator color, except for the Fake bars, which are colored with a lighter AO color. But I also enable the display of "Green" Divergent bars in the "Green Bars > Show" field.
I enable the display of Alligator for higher timeframes in the "Alligator for higher timeframe > Enable" field.
In the indicator style settings, I disable the display of the highest and lowest bars, maximum and minimum AO peak labels, because these labels are also displayed by the VBCHL indicator depending on the number of visible bars in the chart window.
Only after opening a position, I enable all additional alerts in the “Enable all additional alerts” field (after changing this field, you need to re-create the alert for the current chart): crossing the green line of an open Alligator, formation of a fractal, appearance of a new maximum or minimum AO peak.
In the settings of the AOE oscillator, I enable the display of the AO line for the lower timeframe instead of the EMA line, setting the same values in the fields for the Moving Average Line (method, length and source) and Awesome Oscillator.
In the VBCHL indicator settings, I only enable the simple display text style for labels in the "Simple display text style for labels" field.
As a result, when analyzing the current chart, I immediately see all the signals on the chart, the location of the bars relative to the Alligator on the higher timeframe and changes in the Awesome Oscillator on the lower timeframe. And thanks to the VBCHL indicator, I quickly select the desired timeframe for analyzing the 5-wave Elliott impulse, focusing on the interval of 140 bars, and immediately see whether there is divergence between the maximum AO peak and the following lower AO peak in this interval.
DON'T TRADE THESE SUPPORTS AND RESISTANCES
When it comes to technical analysis,
the understanding of which support and resistance levels to not trade can be as important as knowing which ones to trade.
In this article, I will show you the structure levels that professional traders avoid to maximize their profits and minimize losses.
Invalidated support and resistance
Invalidated support/resistance is the structure that has a clear historical significance, but that lost its strength and was neglected by the market during the last 2 tests.
Have a look at that key horizontal support.
We can see that in the recent past, the price bounced from that multiple times, confirming its significance.
Then, the price suddenly broke and closed below that support.
According to the rules, that structure should turn into a resistance after a violation.
However, after its test, the price bounced and violated that to the upside.
The structure became invalid, and you should not trade that in future.
Resistance in a Bullish Trend
If the market is trading in a bullish trend, according to the rules its last higher high composes a key horizontal resistance.
USDJPY is trading in a strong bullish trend.
The price dropped once it set a new higher high higher close.
It composes a key horizontal resistance.
Always remember, that in a bullish trend, the price tends to set new higher highs and higher lows over time.
Quite often, the test of the level of the last high leads to a further bullish continuation and a formation of a new higher high.
For that reason, it is better not to trade such resistances.
Support in a Bearish Trend
In a bearish trend, the last lower low is always considered to be a key horizontal support.
Above is a price action on USDCHF.
The pair is bearish and recently set a new lower low.
It is a key horizontal support now.
However, in a bearish trend, the price tends to set a new low after a retracement. Most of the time, it does not respect the support based on the last lower low.
I recommend you not to trade such supports.
I always repeat to my students that key levels work, but they are not equal in their significance. While some of them are very strong, some are better to be avoided.
❤️Please, support my work with like, thank you!❤️

Most powerfull candlestick pattern Pulse Pin Scalping Strategy Greetings, traders! 📈 Excited to share with you my latest discovery - the Pulse Pin Pattern! 🕯️✨ This three-candlestick formation is a powerful tool for identifying potential trend reversals or continuation. Let's dive into the details for both bullish and bearish scenarios.
Bullish Pulse Pin Pattern:
In the bullish case, keep an eye out for the following conditions:
Candle 2 Breaks Below Candle 1: Ensure that the second candle breaks and closes below the first candle.
Candle 3 Breaks High of Candle 1: The third candle must break the high of the first candle and close with its body above it.
When these conditions are met, it signals a potential bullish setup. Seize the opportunity by opening a buy trade and setting your stop-loss below the low of candle 2. Aim for a target that is twice the risk for a rewarding risk-reward ratio.
Bearish Pulse Pin Pattern:
Conversely, for the bearish case, watch for the following criteria:
Candle 2 Breaks Above Candle 1: Confirm that the second candle breaks and closes above the first candle.
Candle 3 Breaks Low of Candle 1: The third candle should break the low of the first candle and close with its body below it.
Once these conditions align, it indicates a potential bearish Setup. Capitalize on this by initiating a sell trade and setting your stop-loss above the high of candle 2. Target a gain that is twice the risk for a favorable risk-reward ratio.
Remember, always conduct thorough analysis and risk management before executing any trades. Happy trading! 💹🚀 #PulsePinPattern #TechnicalAnalysis #TradingView #TradeSmart #AHTConcepts

How to Analyze Daily Time Frame on Gold. 5 Important Things
There are 5 important things that you should analyze on Gold on a daily time frame to accurately predict long term, midterm and short term movements.
In this article, I will share with you a step-by-step guide for daily time frame analysis that you can apply on Gold or any other financial instrument.
1 - Identify the market trend
When you analyze a daily time frame, you should identify long term, midterm and short term market trends.
Long-term trend is based on the analysis of one year long price action.
In the example above, Gold is trading in a long term bullish trend because the price keeps setting new higher high and new higher lows during the year.
Midterm trend is based on the analysis of a price action for the last 4–5 months.
Above, we can clearly see that a mid-term trend is bullish because again, the price sets new higher highs and higher lows over time.
Short-term trend is based on the analysis of price movements for the last 2 months.
Short-term price action is also bullish on Gold, with a clear sequence of higher highs and higher lows.
According to the trend analysis, long-term, mid-term and short-term trends are bullish.
2 - Identify the directional bias
The directional bias defines a highly probable future direction on the market.
In our example, we can anticipate that Gold will keep growing among all the dimensions: long-term, mid-term and short-term.
3 - Execute structure analysis
Identify important historic horizontal and vertical structures.
That will be the points from where you should look for trading opportunities.
When you analyze key levels, identify the structures that are lying close to the current price levels.
Make sure that all the structures that you spotted were respected by the market in the past.
4 - Look for price action patterns
Price action patterns are the language of the market.
Proper identification of the patters will help you correctly understand the intentions of the market participants.
You can see that a bearish breakout of a rising channel triggered a correctional movement on the market.
Gold started to fall steadily within a bullish flag pattern and after it tested a key support, the price violated the resistance of the flag.
5 - Analyze candlesticks
Candlestick patterns can provide extra clues and confirmations.
You can see that the market formed multiple rejections from key support, an inside bar formation and bullish engulfing candle.
Violation of the inside bar to the upside with a strong bullish candle is an important bullish signal.
Combining trend analysis, structure analysis, price action and candlestick analysis, and you can make predictions and look for trading opportunities.
You can also make your analysis even more sophisticated, for example, analyzing fundamental analysis or applying technical indicators.
❤️Please, support my work with like, thank you!❤️

Understanding Momentum to filter out the Best SetupsIn the video I discuss how I analyse momentum using MACDs and the 5min and 1min charts when daytrading.
Knowing these key concepts helps me filter out the best setups to get on the right side of the market and in the right trading zones.
The basic concepts discussed are :
- Momentum
- Price Action
- Candle Analysis
- Multi-timeframe Analysis
** If you like the content then take a look at the profile to get more ideas and learning material **
** Any Comments and likes are greatly appreciated **

The importance of trading with the trend + Suppy/Demand zonesA trend can be defined with price action or indicators. Understanding that all indicators lag and price behaviour is key I prefer price action to tell me if we are up trending, down trending or trading in a range. Before understanding the basics of market structure it is important to know that its more likely for a trend to keep going on than for the trend to reverse. That is why professional traders look for areas to jump on the trend not areas to go against it. Also, keep in mind what time frame are you using to define the trend, for example, if your trades don't last more than an hour would you jump on the weekly chart trend ? what happens in 1 hour won't affect the weekly chart. So if you are trading the 5 or 15 min chart you can trade with the trend of the 1 or 2 hour chart.
How to define the trend ?
• An up trend is when price is making higher highs and higher lows
• A down trend is when price is making lower highs and lower lows.
• If there is no way to define the trend then you can say it is in a trading range with no clear
direction.
When has the trend changed ?
To explain a trend change we will consider the chart below. First we can notice a clear up trend making higher highs and higher lows (1,2,3) then we create a new lower low (4) where we break below previous higher low (2) then price fails to create a new higher high and instead creates a lower high (5), finally when price breaches the previous lower low at (6) we can consider a change of structure. opposite situation happens in a down trend market.
ABCD CORRECTION PATTERN
There is a very common pattern that pretends to be a change of structure but really it is just a correction pattern to continue the uptrend. Look at the example below. An up trend creates a higher high (A) and a higher low (B). Then creates a lower high (C) and finally a lower low (D) before continuing its up trend.
What did not happen that the trend didn't change ?
If the high after (C) had been also a lower high and then it breaks below (D) and (D) acts further as resistance then the trend had changed.
What is more important here is to understand that trading a continuation of the trend has a higher probability of working, on the example shown the correction ended right at a 4hr demand zone that was valid because the trend was still skewed to the upside.

Range Bar Chart, Line Chart & Candlestick Chart - Everything You
Hey traders,
In this post, we will discuss 3 most popular types of charts.
We will discuss the advantages and disadvantages of each one, and you will decide what type is the most appropriate for you.
📈Line Chart.
Line chart is the most common chart applied by analysts. Reading financial articles in different news outlets, I noticed that most of the time the authors apply line chart for the data representation.
On a price chart, the only parameter that the one can set is a time period.
Time period will define a time of a security closing price. The security closing prices overtime will serve as data points.
These points will be connected with a continuous line.
Line charts are applied for displaying an asset's price history, reducing the noise from less volatile times.
Being simplistic, they can provide a general picture and market sentiment. However, they are considered to be insufficient for pattern recognition and in depth analysis.
Above, a line chart is applied for analysis of a long-term trend on Gold.
📏Range Bar Chart.
In contrast to a line chart, a range bar chart does not consider time horizon. The only parameter that the one can set is a price range.
By the range, I mean a price interval where the price moves. A new bar will be formed only once the prices passes the desired range.
Such a chart allows to completely ignore time variable, focusing only on price movement and hence reducing the market noise.
The chart will plot new bars only when the market is volatile, and it will stagnate while the market is weak and consolidating.
Accurately setting a desired price range, one can get multiple insights analyzing a range bar chart.
In the example above, one range bar represents 10 pips price range on EURUSD.
🕯Candlestick Chart.
The most popular chart among technicians and my personal favorite.
ith just one single parameter - time period, the chart plots candlesticks.
Each candlestick is formed as a desired time period passes.
It contains an information about the opening price level, closing price, high and low of a selected time period.
Candlestick chart is applied for pattern recognition and in-depth analysis. Its study unveils the behavior of the market participants and their actions at a desired time period.
Each candle stick represents a price action within 4 hours on AUDUSD chart above. (time frame is 4H)
Of course, each chart has its own pluses and minuses. Choosing its type, you should know exactly what information do you want to derive from the chart.
What chart type do you prefer?

Most Powerful Candlestick Patterns Candlestick patterns are like building blocks in understanding how the stock market behaves and how prices might change. Knowing about these patterns can really help you make smarter decisions when trading.
I. Introduction to 35 Candlestick Patterns
Candlestick patterns are visual representations of price movements within a specific time frame. Each candlestick represents the opening, closing, high, and low prices for that period.
The body of the candlestick is the difference between the opening and closing prices, while the wicks or shadows represent the price range.
II. Bullish Candlestick Patterns
A bullish candlestick pattern is essentially a visual signal that appears on a price chart, indicating a potential upward momentum or trend in the market. It’s like a green light for traders, suggesting that the price of the asset is likely to go up.
Traders use these patterns to time their entry into the market with the goal of capitalizing on the anticipated price increase.
Bullish Single Candlestick Patterns:
Hammer: A single candlestick pattern characterized by a small body and a long lower wick, signaling a potential bullish reversal after a downtrend.
Inverted Hammer: Another single candlestick pattern with a small body and a long upper wick, indicating a potential bullish reversal after a downtrend.
Black Marubozu: A single candlestick pattern characterized by a long black body with no shadows, representing a strong bearish sentiment.
White Marubozu: A single candlestick pattern characterized by a long white body with no shadows, representing a strong bullish sentiment
Bullish Double Candle Patterns:
Bullish Engulfing: A two-candle pattern where a small bearish candle is followed by a larger bullish candle that engulfs the previous one, suggesting a potential trend reversal to the upside.
Bullish Piercing Pattern: A two-candle pattern starting with a bearish candle followed by a larger bullish candle that opens below the previous day’s low and closes more than halfway into the prior bearish candle.
Bullish Counterattack: A two-candle pattern starting with a bearish candle, followed by a larger bullish candle that engulfs the entire range of the previous bearish candle.
Tweezer Bottom: A two-candle pattern occurring after a downtrend, characterized by two consecutive bearish candles with similar lows, suggesting potential support and a bullish reversal.
Mat Hold: A five-candle pattern suggesting a continuation of a bullish trend. It begins with a bullish candle followed by a bearish candle, a long bullish candle, a small bullish or bearish candle, and ends with another bullish candle.
Bullish Triple Candle-Sticks Pattern:
Morning Star Pattern: A three-candle pattern starting with a bearish candle, followed by a small indecisive candle (often a doji), and then a bullish candle, indicating a potential bullish reversal.
Three White Soldiers: A bullish formation consisting of three consecutive long bullish candles. Each candle closes higher than the previous one, suggesting a strong potential upward movement.
Rising Three Methods: A five-candle pattern signaling a continuation of the current bullish trend. It starts with a long bullish candle, followed by three smaller bearish candles, and ends with another long bullish candle.
Upside Tasuki Gap: A three-candle pattern involving a bullish candle, a gap up, a bearish candle, and finally another bullish candle that opens within the range of the previous bearish candle.
III. Bearish Candlestick Patterns
A bearish candlestick pattern is a visual cue on a price chart that suggests a potential downward momentum or trend in the market. It’s akin to a red light for traders, indicating that the price of the asset is likely to decrease. Traders pay close attention to these patterns to time their entry into the market, aiming to profit from the expected price decline.
Single Candle Patterns:
Hanging Man: A single candlestick pattern resembling a hanging man, signaling a potential bearish reversal after an uptrend. Learn more about Hanging Man Candlestick
Shooting Star Pattern: A single candlestick pattern characterized by a small body and a long upper wick, suggesting a potential bearish reversal.
Bearish Engulfing: A two-candle pattern where a small bullish candle is followed by a larger bearish candle that engulfs the previous one, indicating a potential trend reversal to the downside.
Black Marubozu: A single candlestick pattern characterized by a long black body with no shadows, representing a strong bearish sentiment.
Double Candle Patterns:
Evening Star Pattern: A three-candle formation indicating a potential bearish reversal. It starts with a bullish candle, followed by a small indecisive candle and ends with a bearish candle.
Dark Cloud Cover: A two-candle pattern starting with a bullish candle followed by a larger bearish candle that opens above the previous day’s high and closes more than halfway into the prior bullish candle.
Bearish Harami: A two-candle pattern. The first candle is a large bullish one, followed by a smaller bearish candle that is entirely within the range of the bullish candle. This pattern indicates a potential bearish reversal.
Bearish Counterattack: A two-candle pattern starting with a bullish candle, followed by a larger bearish candle that engulfs the entire range of the previous bullish candle.
On-Neck Pattern: A two-candle pattern where the first day has a long black body followed by a second day with a small body that closes slightly above the previous day’s low.
Triple Candle Patterns:
Three Black Crows: A bearish formation consisting of three consecutive long bearish candles. Each candle closes lower than the previous one, suggesting a strong potential downward movement.
Three Inside Down: A bearish reversal pattern. It consists of a bullish candle, a smaller bearish candle that is completely within the range of the previous candle, and a larger bearish candle.
Three Outside Down: A three-candle pattern. It starts with a bullish candle, followed by a larger bearish candle that completely engulfs the previous bullish candle, and then another bearish candle.
Neutral Candlestick Pattern
A neutral candlestick pattern doesn’t strongly indicate either a bullish or bearish trend. It’s like a yellow light, suggesting caution and indicating that the market is uncertain or indecisive about its direction. Traders look at these patterns to assess the market’s stability or potential upcoming change in trend.
Single Candle Patterns: [/b
Doji: A single candlestick pattern with a small body, indicating market indecision. It suggests a potential trend reversal, whether bullish or bearish.
Spinning Top: A single candlestick pattern with a small body and long upper and lower wicks, signaling market indecision and potential trend reversal.
High Wave: A single candlestick pattern characterized by a long upper and lower wick relative to the body, suggesting high market volatility and uncertainty.
Double Candle Patterns:
Tweezer Top: A two-candle pattern occurring after an uptrend, characterized by two consecutive bullish candles with similar highs, suggesting potential resistance and a bearish reversal

Mastering the Art of Trading Doji Candlesticks in Forex 📈🕯️
Mastering the Art of Trading Doji Candlesticks in Forex 📈🕯️
✅Introduction
=================
In the world of forex trading, the use of candlestick patterns is an essential tool for analyzing and predicting market movements. Among these patterns, the doji candlestick holds a special significance due to its potential to signal market reversals and trend continuations. In this article, we will explore the characteristics of doji candlesticks, their significance in forex trading, and strategies for effectively trading them.
Formation of 2 doji candles on a daily time frame on GBPUSD after a retracement was a strong bullish signal.
✅Understanding the Doji Candlestick
=====================================
The doji candlestick is characterized by its very small or non-existent body, indicating that the opening and closing prices are essentially the same. This results in the formation of a short or non-existent body, with long upper and lower wicks. The doji represents market indecision, signaling a potential reversal or continuation of the current trend.
Doji candle helped me to predict a bearish reversal on USDJPY.
✅Trading Strategies with Doji Candlesticks
==============================================
1. Reversal Strategy: When a doji candle forms after a strong upward or downward trend, it can indicate market indecision and potential reversal. Traders can look for confirmation from other technical indicators or patterns to enter a trade in the opposite direction of the previous trend.
Example: After a prolonged uptrend, a doji candle forms, indicating indecision. Traders can wait for a bearish confirmation candle, such as a bearish engulfing pattern, before entering a short trade.
2. Continuation Strategy: Sometimes, a doji candle can signify a brief pause in the current trend before continuing in the same direction. Traders can wait for a break above or below the high or low of the doji to confirm the continuation of the trend.
Example: In a strong uptrend, a doji candle forms, indicating uncertainty. Traders can wait for a break above the high of the doji to enter a long trade, expecting the trend to continue.
3. Doji Patterns: Certain variations of the doji candle, such as the dragonfly doji, gravestone doji, or long-legged doji, carry their own specific implications based on their shape and position within the broader price action. Traders can develop specialized strategies based on these patterns.
Combining key levels and doji gives even more powerful confirmation
✅Conclusion
================
In conclusion, mastering the art of trading doji candlesticks in forex requires a deep understanding of their characteristics and the ability to integrate them into effective trading strategies. By incorporating doji candlesticks into their arsenal of technical tools, traders can gain valuable insights into market sentiment and improve their decision-making process.
By learning to recognize and interpret doji patterns, traders can enhance their ability to identify potential trend reversals and continuations, leading to more profitable trading outcomes. Incorporating the strategies outlined in this article, traders can leverage the power of doji candlesticks to gain an edge in their forex trading endeavors. Happy trading! 📊💰

How to identify high quality Supply and Demand zonesSupply and demand zones are powerful tools to find high probability trades. If they are used in the correct context they offer a high win rate and a very controled risk. These are some of the characteristics that high quality zones have:
•When a good zone is being created in real time you will watch that price pushes down/up with aggressive price action and follow through after the basing candle. Heavy volume on the development and candle closing at its highs are also good indicators.
•A high quality supply/demand zone is the one that creates new lows/highs. That means that it was able to push below/above the prior low/high.
•In short time frames, shorter than 1 hour, you would probably find good supply and demand zones to have a continuation of the trend. For example, if a Future is in an uptrend pay attention to the demands that are created in that trend and then when price pulls back to it look at the price action in the zone. Have in mind that in uptrends, demand zones are reliable and supply zones have a much lower probability of working. The opposite scenario happens in downtrends were supply zones are higher probability and demand zones should be avoided.
•In higher time frames, a very strong supply or demand zone could be an area for a change of structure (from an uptrend to a downtrend for example).
•A good indicator of a reliable supply/demand zone is when price pulls back to it and the candle has a strong rejection as it touches the zone, meaning an upper/lower wick is created below/above the zone. volume is developing with no follow through (orders hitting strong ask/bid in the tape) and the candle does not close inside the zone.
•Speed heading into the zone is also relevant, a high speed drop heading in to a demand zone is a good area to trap late sellers.
•If for example FX:EURUSD has a demand zone and TVC:DXY has a supply zone or a resistance level and both are having retracements from their trend, that could be a good opportunity to go long and also if price action gives an extra confirmation. This means that confluence is key for a high probability trade when using supply and demand zones.
• Use the concept of relative strength/weakness when using confluence with other charts.
Example: A 2 hour demand zone in Brent Futures $NYMEX:BZ1!. Notice how the red candle that reaches the zone is a strong one with higher volume and is not able to close inside the zone, It prints a lower wick and closes above it giving the demand zone a good price action confirmation.

Fair Value Gap Trading StrategyFair Value Gap Trading Strategy
To implementing a fair value gap as a trading strategy you need to understand these three basic components of this trading strategy.
Time
Liquidity Hunt
Market Structure Shift
Fair Value Gap
Let’s begin by discussing the importance of time in trading. According to ICT Trader, time is considered to be fractal, meaning that what happens on higher time frames is reflected in lower time frames if studied in the proper context.
In this context, fractal refers to the idea that patterns and behaviors observed on longer time frames, such as daily or weekly charts, can be seen in shorter time frames, like hourly or minute charts.
By studying price action and market behavior across different time frames, traders can gain a deeper understanding of market dynamics and potentially identify profitable trading opportunities.
Time indeed holds significant importance in the fair value gap trading strategy, particularly when it comes to identifying favorable trading setups. Despite the forex market being open 24 hours a day, not all times present ideal conditions for executing fair value gap trades. That’s where the concept of ICT Kill Zones comes into play.
ICT Kill Zones
ICT Kill Zones refer to specific time periods during the day that have been observed to offer higher probability trading opportunities. These zones are associated with the entry of smart money, which are institutional or banks who have the ability to influence market direction.
In short, ICT Kill Zones correspond to specific time periods during the day that are particularly relevant for trading activities. These zones include the London Open, London Close, New York Open, and New York Close.
Traders using the fair value gap trading strategy often focus on these times as they tend to offer higher probability trading setups. The ICT Kill Zones are associated with the entry of smart money and can provide enhanced opportunities for traders to capitalize on market movements. By aligning their trading activities with these specific time periods, traders aim to improve their chances of success.
Liquidity in FVG Trading Strategy
Liquidity in the market often takes the form of buy stops and sell stops.market makers or smart money intentionally trap retail traders by manipulating prices to trigger their stop losses.
The idea is that they move the market in one direction to hunt for stop losses, causing retail traders to place orders in the false direction and set their stop losses at key levels. After the stop loss hunt, the market reverses in the opposite direction, benefiting the smart money.
Let’s analyze the above chart from a retail trader’s perspective. When we observe the chart, we notice that the price levels between 44240 and 44280 have proven to be strong resistance in the past.
Based on this observation, many retail traders might place their selling pending orders to anticipate of a price reversal at these levels. To manage their risk, they would likely set their stop loss orders just above this resistance area.
What is done by market makers or smart money,they could manipulate the market by initially pushing the price upward, deliberately triggering the stop loss orders placed by retail traders. This action would cause some retail traders to think that a breakout is occurring and prompt them to place buying orders while setting their stop losses at levels below the resistance area.
Once the stop loss orders have been hunted and triggered, the market makers or smart money may then reverse the price direction.
Enhancing Trading Success with the Fair Value Gap Entry Strategy
After a liquidity hunt on a higher time frame, you suggest switching to lower time frames such as 15 minutes, 5 minutes, 3 minutes, or even 1 minute to identify certain patterns that may emerge following the stop loss hunt. These patterns include:
1.Sudden or sharp price movements: Following the liquidity hunt, you may observe rapid and significant price fluctuations on the lower time frames.
This sharp movement causing market structure shift and provide an extra confluence.
2. Fair value gap (FVG): Look for gaps between the current price and the fair value of the asset. The fair value represents the equilibrium price based on various factors. Identify instances where the market price deviates significantly from this fair value.
3. Entry position based on the Fair Value Gap strategy: Once you spot a fair value gap pattern after the liquidity hunt, you can consider taking a position in anticipation of the market filling that gap. The expectation is that the market will eventually return to the fair value price.
It’s important to carefully train your eyes to recognize these patterns after a liquidity hunt and patiently wait for the market to come back and fill the identified gap. Once you have identified a suitable entry position, you can place your stop loss order above the first candle to manage your risk.
Please note that implementing such strategies requires careful analysis, experience, and a deep understanding of the specific market you are trading. It’s crucial to conduct thorough research, backtest your strategy, and consider other factors that may influence price movements before making any trading decisions.

GBPUSD London Session Buy Recap 70+ pipsPrice broke below the KL but the next 30 minute candle closed back above, indicating a small liquidity grab for price to move back up. CPI was to follow and as the next hourly candle broke the previous high, buys were entered with us anticipating CPI to drive price back up to the next KL. Secured some profits there, and left a runner to target the KL at 1.26900.

Gold Asian Session Buy Recap 80 pipsTook successful buys on gold after price broke resistance, waited for a pullback and entered anticipating price to move up with Asian volume. Looked to target a 4hr wickfill and stops were placed below the previous 30m candle.

Learn Profitable Doji Candle Trading Strategy
In the today's post, I will share my Doji Candle trading strategy.
This strategy combines the elements of multiple time frame analysis, price action and key levels.
Step 1
Analyze key levels on a daily time frame.
Identify vertical and horizontal supports and resistances.
Here are the key structures that I spotted on on AUDUSD.
Step 2
Look for a formation Doji Candle on a key structure.
This rule is crucially important: we will trade only the Doji candles that are formed on key levels.
From key supports, we will look for buying, and we will look for shorting from key resistances.
Look at this Doji Candle that was formed on a key daily support on AUDUSD.
Step 3
Look for a horizontal range on a 4h/1h time frames.
Doji Candle signifies indecision. Quite often, you will notice the horizontal ranges on lower time frames when this candlestick is formed.
Here is a horizontal range that was formed on a 4H time frame on AUDUSD after a formation of Doj i.
Step 4
Look for a breakout of the range.
To sell from a key resistance, we will need a bearish breakout of the support of the range. That will be our bearish confirmation.
To buy from a key support, we will need a bullish breakout of the resistance of the range. It will be our bullish signal.
Here is a confirmed breakout of the resistance of the range with a 4H candle close above. That is our bullish confirmation on AUDUSD.
Step 5
Buy aggressively or on a retest.
After you spotted a confirmed breakout of the range, open a trading position aggressively or on a retest.
Personally, I prefer trading on a retest.
If you sell, a stop loss should be above the high of the range and your target should be the closest key daily support.
If you buy, your stop loss should be below the low of the range and a take profit will be on the closest daily resistance.
On AUDUSD, a long position was opened on a retest. Stop loss is lying below the lows. Take profit is the closest resistance.
Here is how the great strategy works!
Always patiently wait for a confirmation! That is your key to successful trading Doji Candle.
❤️Please, support my work with like, thank you!❤️

How Buyers Trapped Beautiful Chart to Learn .
I can discuss this chart with you for a longer period of time because there is so much learning in this chart, why this chart is important for a Trend follower,
for a candlestick pattern (Bullish bearish Engulfing, Doji, Three Black Crow, etc.)
and for a pattern lover( Channel, Wedge, Pennant, Triangle, Rectangle) because it has everything in the chart but how to have a close eye without getting biased each and every time you just need to perform your learning without any emotions.
on 16 June 2022, the candle is made telling everybody that the trend has been changed
from there on-wards, if you place have Fibonacci almost each and every time it gets retraced from 50% so on and so forth at held its direction firm and it does the same which a trend should do.
From November 4th onwards again continues in its original direction
if you think that the 3rd October candle is telling you to change the direction, but when you see the 22nd September candle you will understand that on 3rd October the candle which has complete buyers is still overshadowed by the 22 September candle, this tells that trend is still Bearish.
the most interesting part happened from 20 December 2022 to 2nd of March
when the price was in the Zone of (0.67750-0.69735)
where I think how they Created Buyers Trap each and every time and how high frequency trades each and every time were placed there because there were limit orders placed and each and every time they fill the orders you can see just by looking at the wicks,
you can clearly see if buyers have potential then they could break the upper part of the rectangle which was made by the price but couldn't hold Levels
if you see 27 February to 3rd March then you can clearly see they again established the bearish Phase and they had the upper hand so they Take the price Down and Broke the recently made support Zone which is around 0.67750
and when they broke its level there is a Marubozu candle just telling you completely that sellers are in full control.
There is so much in this chart Learn and Practice.
Please Watch Closely and there is So much.
Gratify if you appreciate the practice then you can like it, share it and
If you want me to investigate any chart for you then would cherish doing that for you.
Thank you for your time and support.
Stay safe.

SPY: Don’t “Guess” the Top.We can learn a very interesting lesson by looking at the SPY chart. Anyone who tries to guess the next top or bottom is a gambler, not a trader, and as someone who has gambled a lot in the past, this rally brings back some memories.
It's very easy for someone to see such an explosive movement and think: "It's already gone up a lot, it's going to have to come down soon". It's very easy to look for clues in other indicators, for example, and get excited when you see the RSI exploding close to 70. Looking for clues that reinforce a pre-existing belief is common among individuals corrupted by the "confirmation bias", which is something else, and would be content for a future article.
Still talking about the RSI, it's important to mention that the RSI was already at 70 when the price was at $450. Since then it has risen by more than $20 (approximately 5%), and there is no sign of a top yet. Far from being a criticism of such an efficient indicator, this is just evidence that the use of indicators should be aligned with what we see on the chart.
Top or bottom signals are confirmed when we see a clear breakout from a notorious reversal pattern. As we can see from the SPY chart below, just one or two bearish patterns, even when appears close to clear resistance, is not enough. There needs to be confirmation of a good breakout.
Perhaps this is one of the reasons why so many are rushing to sell a possible top, even without confirmation. By waiting for confirmation, you sacrifice part of your profits, and amateurs hate that. To feel like a pro, you have to feel the satisfaction of buying the bottom and selling the top, all the time. Which is ironic, because that's not the focus of a professional. A real trader seeks long-term consistency.
Speaking for myself, as far as I can see it's a strong rally in the SPY, and the next resistance is the all-time high at $479.98. So far, there is no clear reversal pattern for me, although I personally would like to see a correction to a support point.
What if the SPY made a bearish candlestick pattern today? Just as we see on November 9, 15 and 29, and on December 6, a top signal is plausible, but we need to wait for confirmation via a breakout. Otherwise, it would just be another bear trap.
Another thing I like to do is wait for a clear bearish reversal structure to appear on shorter time frames, such as the hourly chart. Uptrends are characterized by rising tops and bottoms, and the reverse applies to downtrends. When a stock is in a clear uptrend, but the hourly chart suddenly makes a lower top and bottom, it's a warning sign. If such a reversal occurs near a resistance area, all the better, as was the case with NVDA at the end of last month.
One of the most overlooked principles of Dow Theory is the number 6: "Trends Persist Until a Clear Reversal Occurs". When Charles Dow, founder of the Dow Jones index and the Wall Street Journal, began working on the principles more than a century ago, he never imagined that in the 21st century there would still be traders who anticipate and don't wait for confirmation (again, I was among these gamblers in the past).
Therefore, trading reversals is interesting and can be very profitable, but you need to base your decisions on technical reasons. I shared how I like to trade reversals, but there are more strategies that you can use. Feel free to share yours. That's the difference between a gambler and a trader. Moreover, remember to follow me for more content like this, and support this idea if you liked it!
All the best,
Nathan.

Market Manipulations. Bullish Trap (smart money concepts)
In the today's article, we will discuss how smart money manipulate the market with a bullish trap.
In simple words, a bullish trap is a FALSE bullish signal created by big players.
With a bullish trap, the smart money aims to:
1️⃣ Increase demand on an asset, encouraging the market participant to buy it.
2️⃣ Make sellers close their positions in a loss.
When a short position is closed, it is automatically BOUGHT by the market.
Take a look at a key horizontal resistance on AUDCHF.
Many times in the past, the market dropped from that.
For sellers, it is a perfect area to short from.
Bullish violation of the underlined zone make sellers close their position in a loss and attracts buyers.
Then the market suddenly starts falling heavily, revealing the presence of smart money.
Both the sellers and the buyers lose their money because of the manipulation.
There are 2 main reasons why the smart money manipulates the markets in a such a way:
1️⃣ - A big player is seeking to close a huge long position
When a long position is closed, it is automatically SOLD to the market.
In order to sell a huge position, smart money needs a counterpart who will buy their position.
Triggering stop losses of sellers and creating a false demand, smart money sell their position partially to the crowd.
2️⃣ - A big player wants to open a huge short position
But why the smart money can't just close their long position or open short without a manipulation?
A big sell order placed by the institutional trader, closing their long position, can have an impact on the price of the asset. If the sell order is large enough, it can push the price downward as sellers outnumber buyers. Smart money are trying to balance the supply and demand on the market, hiding their presence.
It is quite complicated for the newbies and even for experienced traders to recognize a bullish trap.
One of the efficient ways is to apply multiple time frame analysis and price action.
Remember, that most of the time bullish traps occur on key horizontal or vertical resistances.
After you see a breakout, analyze lower time frames.
Quite often, after a breakout, the market starts ranging.
After a breakout of a key daily resistance, gold started to consolidate within a narrow range on an hourly time frame.
Bearish breakout of the support of the range will indicate a strength of the sellers and a highly probable bullish trap.
Remember, that you can not spot all the traps, and occasionally you will be fooled by smart money. However, with experience, you will learn to recognize common bullish traps.
❤️Please, support my work with like, thank you!❤️

The Best Strategy to Apply Trailing Stop Revealed
Hey traders,
In this post, I will share with you my strategy to apply a trailing stop.
Please, note that I am applying a trailing stop only in trend-following trades and only when a trade is opened on a key level. I trade price action patterns, so the following technique will be appropriate primarily for price action traders. Moreover, my entries are strictly on a retest.
1️⃣
Spotting a price action pattern, I am always waiting for its neckline breakout. (if we talk about different channels, then by a neckline we mean its trend line)
Once I see a candle close below/above the neckline, I set my sell/buy limit order on a retest.
Stop loss will strictly lie below the lows of the pattern if we buy and above the highs of the pattern if we sell.
I spotted a horizontal trading range on an hourly time frame on AUDUSD. I set a sell limit order after a breakout of its neckline. Stop loss is lying above the highs of the pattern.
2️⃣
Once we are in a trade, you should measure the pattern's range (distance from its high to its low based on wicks) and then project that range from the entry to the direction of the trade.
In the picture above, the pattern range and its projection are the underlined blue areas.
Once the price reaches the projection of the pattern's range, you should move your stop loss to entry and make your position risk-free.
Move stop to breakeven in traders' slang.
3️⃣
Then you should let the market go.
📈If you are holding a long position, you should let the market retrace and set a higher low and then a new higher high or AT LEAST an equal high. Once these conditions are met, you can trail your stop and set it below the last higher low.
📉If you are holding a short position, you should let the market retrace and set a lower high and then a new lower low or AT LEAST an equal low. Once these conditions are met, you can trail your stop and set it above the last lower high.
In the example above, stop loss was modified when the price set a new lower high. Stop loss is now lying above that.
Catching a trending market you should trail your stop based on new higher lows / lower highs that the price sets. Occasionally you will catch big winners.
How do you apply a trailing stop?
❤️Please, support my work with like, thank you!❤️

Learn FAKEOUT, BREAKOUT, RETEST | Trading Basics
Hey traders,
In this post, we will discuss 3 very important market situations that every trader must be able to recognize: breakout, retest, and fakeout.
❗️ Please, note that the essential element of all these terms is structure: vertical and horizontal key levels.
📍 Breakout is a situation when the market breaks the identified horizontal support or resistance, or a vertical trend line.
Breakout is a very important event that signifies the willingness of buyers/sellers to violate the structures. Violation of support signifies a strong selling pressure, while a violation of resistance signifies a high buying momentum.
Usually, the structure breakout is confirmed with a candle close.
For confirmation of a breakout of support, a candle close below that is needed.
For confirmation of a breakout of resistance, a candle close above is required.
Take a look at a bearish breakout of a key support on Gold. After the breakout, the broken support turned into a resistance and was respected multiple times. It was broken by the buyers then and turned into a support again.
📍 Retest is the situation when the price returns to broken horizontal support or resistance, or a vertical trend line after a confirmed breakout.
For a structure breakout, high trading volumes are needed. Usually, after a breakout, the market participants are locally exhausted and a correctional movement follows. That may lead to a retest of a broken structure.
Most of the time, after a retest, a strong impulse follows. For that reason, for many traders, the retest is applied for trading entries.
Here is how nicely the price violated a key support on Gold. After a violation, the market became oversold and the price retested the broken structure.
📍 Fakeout or false breakout is the situation when the price has not enough strength to maintain its direction after a retest of a broken structure. Instead, the market returns below/above the broken resistance/support.
Above, is the example of a false breakout on EURUSD.
Fakeout is one of the main reasons why structure traders lose money.
One of the ways to avoid fakeout is to monitor trading volumes during a structure breakout. A volume spike is needed to confirm the strength of the market participants, while low volumes most of the time signify a manipulation.
Learn to spot breakouts and false ones, and try to trade on a retest.
Hey traders, let me know what subject do you want to dive in in the next post?

4 Types of Gap You MUST Know in Trading
Hey traders,
In this article, we will discuss a very common pattern that is called gap.
In technical analysis, the gap is the difference between the closing price of the previous candlestick and the opening price of the next candlestick.
📈Gap up represents a situation when the price bounces up sharply at the moment of a transition from one candlestick to another. The price gap that appears between them is called gap up.
📉Gap down represents a situation when the price drops sharply at the moment of a transition from one candlestick to another, the price gap between the closing price of the previous candle and the opening price of the next candle is called a gap down.
From my experience, I realized that with a high probability the gap tends to be filled. For that reason, once you see a gap, consider trading opportunities around that.
Depending on the market conditions where the gap appears, there are several types of a gap to know:
1️⃣Common gap appears in a weak, calm market. When the trading volumes are low and the market participants are waiting for some trigger, or the asset reached a fair value price.
Above, there is a perfect example of a common gap that was formed on Dollar Index on an hourly time frame.
2️⃣Breakaway gap appears in a situation when the price suddenly breaks a structure (support or resistance) in a form of a gap.
Such a gap usually confirms a structure breakout.
I spotted a perfect breakaway gap on Dollar Index. The market violated a solid horizontal support with that.
3️⃣Runaway gap usually appears when the market is growing or falling sharply. It signifies the dominance of buyers/sellers and highly probable continuation. Usually such gaps are not filled.
Runaway was a perfect indicator of a strength of buyers on US30 Index.
4️⃣Exhaustion gap is, in contrast, appears around major key levels and signifies a highly probable reversal. The exhaustion gap is usually confirmed by a consequent strong opposite movement that fills the gap.
US100 formed an exhaustion gap, trading in a strong bullish wave. After that the gap was filled and the market started to fall rapidly, forming a breakaway gap.
Learn to recognize gaps on a chart and learn to interpret them. It will increase the accuracy of your technical analysis.
Hey traders, let me know what subject do you want to dive in in the next post?

Trading Initial BalancesWhat Are Initial Balances?
Initial balances refer to a specific time frame at the beginning of a trading session, typically the first few minutes or hours when a market opens. During this period, traders closely observe price movements and volume to gauge market sentiment and establish trading strategies for the rest of the session.
How Initial Balance Trading Works
The concept of initial balance trading is rooted in the idea that the price and volume behavior during the initial balance period can provide valuable insights into the day's trading potential. Here's how it works:
1. Observation: Traders closely watch the price action and volume during the initial balance period, which often includes the first 30 minutes to one hour of a trading session. This is a critical phase for assessing market dynamics.
2. Key Levels: Traders identify key price levels during the initial balance period, such as the high and low points. These levels can serve as significant reference points for the day's trading activities.
3. Breakouts: Breakouts above or below the initial balance range can signal potential trading opportunities. A breakout above the initial balance high may suggest bullish momentum, while a breakout below it may indicate bearish sentiment.

Order Blocks - The only explanation you will ever needHere's the only guide on order blocks you're ever going to need 😎✏️
Order blocks may seem scary and difficult to find -
Once you know what you're looking for, it's like taking candy from a baby 🍭
The key elements you need to have in place before getting the hang of this basic SMC application is as follows -
🟢 Trend spotting
🟢 Market structure
Those are the 2 greatest tools a trader could ever have at their disposal. Make sure you know how to identify trend and market structure well - The rest will fall in place.
Happy hunting! 🦁🐯🦈
Apex out ✌️
OANDA:GBPUSD OANDA:EURUSD
