EURCAD - Dynamically exiting a trade like a proIn this video I discuss, using a recent live trade, how dynamically managing trades is superior to the "set it and forget it" approach to stop loss and profit taking levels.
Candlestick Analysis

Japanese Candlestick GuideHere is a quick guide to Japanese Candlesticks. I went over the basics of candlestick construction & some of the common patterns we see a lot

Postmortem - Managing losing trades like a proIn this video I use the recent losing gold trade to talk about how to manage trades like a pro. You do this using 3 main principles 1)Risk small amounts of capital, 2)Don't over-trade, 3)Don't ignore counter-position price action.

ADVANCED SKILLS OF INSIDE BARNormally INSIDE BAR will give us two trade
1. the first trade is to trade at the breaking out
2. the 2nd trade is to trade after the breakout + pull back
the first trade normally can quickly take you to 1:1 risk/reward
the 2nd trade can give you a higher R/R
if you don't know what is inside bar, you can google it and also check my video tutorial

How well do you know your pinbar?Please note :
I am self-taught and the information below is just my understanding/thoughts on the topic. I am open to debate in the comments if I have either misjudged something or have missed something altogether.
Pinbars
I wanted to publish something abit more educational regarding reading of candlesticks.The ‘pinbar’ is a crowd favourite and you don’t have to surf anything chart related for too long before running into a pinbar strategy. While I agree with the premise of it, there is an obvious lack of information out there regarding pinbars & hopefully I can do my bit and clarify some situations in which the pinbar is better used – in my opinion.
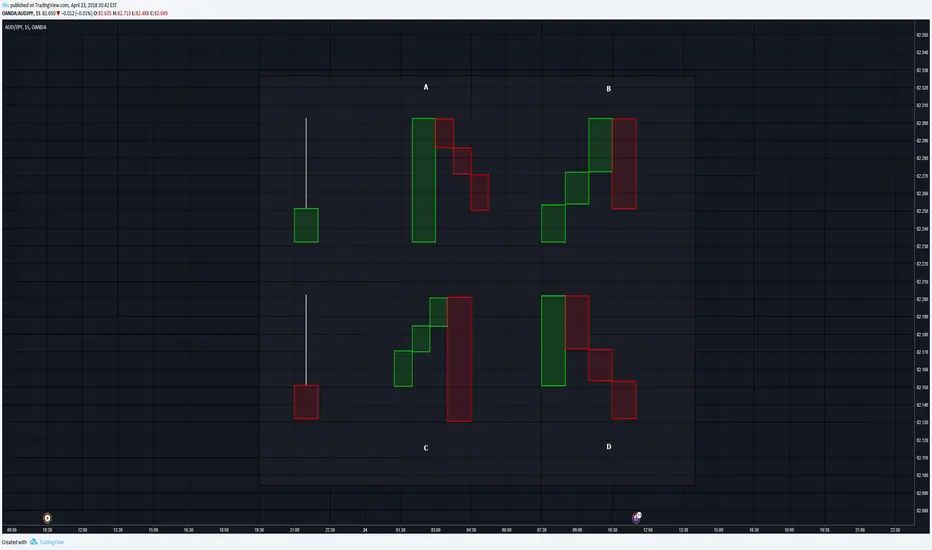
The chart here illustrates what many will categorize as ‘bearish’ pinbars . The word ‘rejection’ has begun to be thrown around too loosely. The truth of the matter is that some of these pinbars signal ‘relief’ or ‘retracement’ rather than ‘rejection’. While I recognise that there are thousands of other ways the breakdowns may occur, you can definitely relate most breakdowns back to the 4 here in one way or another.
While the context (ie location,trend etc) of the pinbar plays a major role, for the purposes of this post, we will put that aside.
For example, you see a pinbar form at the top of an up move on the 4hrly and decide to take a short. If I asked you to go down to the hrly and look at its breakdown, would you still short if its makeup was pinbar breakdown A? I wouldn’t as this breakdown signals a pause in the up move before continuation to me. If we were to talk about the order in which I would place the breakdowns for considerations of a short trade, it would be C,D,B,A.
This brings me to my next point, the colour of the pinbar you are trading matters. I have read several articles/guides online that either make no mention of the colour of the pinbar, or even say it is not important. Both C & D show a violation of the previously upward move, this signals that it is MORE LIKELY that price moves down rather than continue to the upside – this is pretty much the only edge we need in trading.
I urge you to go through your charts and mark down all the 4 hr pinbars you can find at appealing locations (like I said, context matters) & zoom into the 1hr to have a look at their breakdowns to see which ones succeed more often. While I have not fully tested these myself, I can pretty much guarantee with 100% certainty breakdown C will be way more successful than breakdown A.
Think about the strategies you can come up with which incorporates pinbars once you apply this info to it. For example,
You trade bearish pinbars (red with preferably breakdowns similar to C) that print with the following confluences :
In line with the overall trend on your higher timeframe
Has retraced to a decent resistance zone (horizontal or sloping) with a Fibonacci level present
Overbought readings on your RSI or stoch etc in order to refine it even more (Be cautious with this as with trading I find less is more & too many filters can cause paralysis)
Another way of taking advantage of this (and I don’t recommend this) is to trade the green pinbars (similar to setup A) to the UPSIDE if the location it appears in is out in the open & nowhere near any feasible resistance (outside the box, I know)
All the above info can be applied to bullish scenarios as well.
So remember, take notice of what the breakdown of the pinbar you wish to trade looks like & you will be able to refine your trading in order to take trades that offer the highest probability of success.
While I realise this was a rough guide, I hope you have found this helpful. If you did, leave an upvote, & share around so that more traders can avoid using pinbar strategies incorrectly. There is a lot of misinformation going around on the internet as a whole. Like I said initially, these are all thoughts I have had based on logic – so I could be mistaken in some way. Let me know your thoughts.
Price Action Lesson 6: Shooting Star Candlestick Pattern Def.Shooting Star Candlestick Pattern Definition:
When the price highly increases during a day, but decreases to what it was at the beginning of the day or even lower, a considerable bearish retracement is occurred.
The candlestick of this price action in the daily time frame is a Shooting Star.
The Shooting Star in the daily time frame is a very strong signal for the possibility of more decrease in price during next days.
Example: The chart shows the price of Gold in the time frame of 30 minutes. On Sep 08, 2017 the price significantly increased from 1348.80 to 1357.53, then it decreased more, and at the end of the day to it was closed at 1346.07.
The corresponding Shooting Star candlestick of this price movement in the daily time frame is also drawn on the chart to better describe the concept.

Price Action Lesson 7: Conditions of a Perfect Shooting StarConditions of a Perfect Shooting Star:
Body is short.
The height of the candlestick (the difference between high and low price) is tall enough and it's more than the Daily ATR(264). The taller the Candlestick is, the stronger the Shooting Star.
The upper shadow (also known as upper wick or tail is the distance between the high price and the close or open price, whichever is higher) should be very tall, over than 75 percent of the Daily ATR(264) is better.
The lower shadow (also called bottom wick or tail is the distance between the low price and the close or open price, whichever is lower) is nonexistent or very short. It should be less than 25 percent of the Daily ATR(264).
The Shooting Star with the bearish body is stronger than the one with the bullish body.
- The picture shows a perfect Shooting Star candlestick .
As seen, the height of the candlestick is tall, but the body is very short. Also, the upper shadow is very tall and the lower shadow is very short.
The close price is lower than open price, therefore the body of this Shooting Star is bearish , and the strength is very high.

Example of a inside bar + false break tradeHere is an example of a profitable trade that closed out today for a 2R gain.
I currently have an open order on the USDCHF with a simular setup. See linked idea.
The setup consists of the following elements:
strong / clear preceding trend
consolidation in the form of one or more inside bars
a false break out of the consolidation, thus rejecting the counter trend direction
place a trade in the direction of the preceding trend
In this example the break was a well formed pinbar and I therefore placed a limit entry order at the 50% retracement of the pinbar.
Stop was placed above the high of the pinbar.
Profit target was placed at two times the distance of the stop, giving a R2R ratio of 2. Target also nicely lined up with the bottom of the consolidation / mother candle of the inside bar pattern.
Learn more about my trading at: www.davetromp.net

BTCUSD - Spread the light - EducationalI cleaned up the chart so I can explain few points. I have already traded the dip and I am out. I have noted the short trade price, stop loss price and the target price on the chart (for educational purposes only). If you want further information about this trade, please review the previously published ideas. Here are few points I want to explain:
1. No one can trade the absolute tops and bottoms. You always want to wait for confirmation before you enter a trade and you also want to exit before the trade changes direction and eat your profit. So, you will always enter and exit at different points other than tops and bottoms on the chart.
2. You can define your target prices in different ways. In my opinion, you should always use the same exact method and never change it in the short term. The one used in this trade is very simple. The target is 2 times the distance from trade price to stop loss. In other words, I am willing to lose X to win 2X. I can also trail my stop loss to protect he profit and maybe make more money, but I prefer a simple binary system.
3. All the support levels that I posted in the previous idea were basically to make sure that there is no strong level where the downward movement can be stopped before reaching my target price. I never intended to wait and see if the price will reach any of them. If there were any strong levels of support before the target price, I would not take the trade. You may choose to be riskier in your trading strategy.
There are multiple other strategies for position sizing and entry and exit rule and stop loss determination. I would suggest you study some of them and choose one that fits your personality.
Now, what is going on with Bitcoin.
You can see that there is a bearish engulfing candlestick pattern (marked with the big green and red arrows). There is no typical engulfing pattern when trading Cryptocurrencies basically because they trade 24/7 non-stop and the close of the previous candle is always the open of the next, but this is as close as it can be. The only thing is that there is no good volume behind the bearish candle which makes it weaker in my opinion. Most indicators are useless at this point. Some traders consider stochastic crossing below 50% is further confirmation of the downtrend (and they only enter at this point). At the time being, I am just watching and waiting for the next confluence of signs to enter another trade.
On the other hand, there is a possibility of forming head and shoulders pattern (see the green arcs on the chart). Head and shoulders pattern takes at least 1 month to form. Any shorter duration patterns are probably false. In BTC case, if the pattern forms, it will be around 6 weeks which is good. The thing is, you have to wait for a break up above the neckline with very very strong volume ( the volume is really important here). Generally, I prefer to see price closes above 11800 (previous high) in this case before I long.
happy trading. I'd love to hear your thoughts on this.

Price Action Lesson 5: Weak Hammer (Example)Weak Hammer (Example):
The chart shows the price of Bitcoin vs. US Dollar. In 02/02/2018, as it says, buyers couldn't raise the price above the day open price, the D1 candle seems a Hammer with bearish body. So the final result wasn't clear and the next day, sellers could pullback the price. (Consider the red thick arrow)

How to enter a trade (entry signals) for CTR/BTC price spikeHi all.
I've had some PM's about the price spike we had for CTR/BTC over the last 24 hours, given that I did some analysis on this a few days back.
I've recorded this vid to provide some context around what you should have been looking for! There's also some time spent on what not to do, which will hopefully be useful for newer traders.
Hope it's useful. Let me know any feedback or other things that you would like covered.
Cheers and good luck,
RJR

Last 3 market crashes compared"What just happened?" Is the most common question people is asking their brokers.
The answer: Nobody knows exactly. The market just crashed like in 2015, 2011 and 2010.
Here is a comparison of the latest 3 flash-crashes:
18 August 2015
1 August 2011
6 May 2010
Even while past data suggests a price bounce, bear in mind that the sell-off could continue in the next days.
---
"Know what you own, and know why you own it" - Peter Lynch

Price Action Lesson 4: Weak hammerWeak hammer:
For having successful and steady transactions, Simple detection of market patterns is not enough. But with a deeper look, we should calculate the success possibility of each pattern. One of the determining power Parameters of hammer stick is about Descending or ascending that the body can be. Thus, if the body of hammer is ascending, Possibility of starting an ascendant wave is very high.
The opening price of the day, is very important. This price - is the previous day's closing price, in fact it is the price that they had a war at in previous day where buyers and sellers come to equilibrium. So on the day that the Hammer is forming. If buyers can raise prices to the point of closing price of yesterday, and by the end of the day, they keep the price at the top of it, they will be the winners of the war. If we can raise the price above yesterday's closing price, they are not conclusive winners of today’s war, and this war will continue for the next few days.
Thus, if the body of hammer is ascending, Possibility of the beginning Ascending wave is very high. But if the body of hammer is Descending, Possibility of the beginning Ascending wave is less. In this case, it is said a weak hammer has made.
- The picture shows a hammer candlestick with descending body.
. As what can be seen, candle’s height is tall, but it has very short body height. Also Lower Shadow is long, and the upper shadow is very short.
. As regards the Closing Price of market is under its Opening Price, therefore the body of this hammer is Descending, and the power is very low. Possibility of the beginning ascending wave is less.

Invest in yourself before invest your moneyIs buy & hold a strategy for penny stocks?
Some says yes, some says no. The answer really depends how skillful the investors are.
In this penny stock example, buy and hold is definitely a poor choice.
A 30% gain in 171 days VS a 255% gain in 80 days.
I pointed out many alert positions. Please move your cursor to the blue spots.
These alerts tell you to think about STOP LOSS to protect your PROFIT.
You may have to develop some technical analysis skills like below:
Left chart
Understand candlesticks pattern
Spot moving averages crossovers
Spot MACD crossover
Apply Fibonacci Retracement
Draw one or more trend line(s)
Right chart
Understand candlesticks pattern
Check S/R levels
Spot Tenkan-sen & Kijun-sen crossovers
Check Chikou-span position
Check price is under cloud
The next step is to develop your mindset:
According to a Stanford Research Institute report, 87.5% of our success in life comes from our attitude, with only 12.5% coming from skill.
If there were only 50 technical analysis methods in the world, then you learnt only 10 of them. You got only 2.5%, a tiny portion of your success. You attitude then will be a massive action that move you forward.
Do you know the power of beliefs? There are many people giving up trading because they cannot handle their negative emotions. I knew you're thinking fear & greed, but you may probably forget some emotions holding you back such as distress, disappointment and discouragement. The more bad news your heard from TV, magazines, and forums, your mind is filled with a lot of negative comments. Why not you go to hang around with positive thinking traders, fully technical analysts in some trading seminars face to face. They will encourage you and sometimes empower you, much better than sharing with your own friends. You must find the way to improve yourself. You must dump the past trading experience in order to absorb professional advice.
Do you have the best place to do your chart analysis? I was telling some of my students “Can you not doing your analysis on a dining table; not analyzing & watching TV at the same time; not Facebook messenging while you are doing day-trades?” You need a FOCUS on what you are trading. Some says trading bitcoins can generate a lot of money, then you jump from your boat into their boat with no understandings their structure and foundation. If you lose, then it is your responsible, not others.
At last I encourage all of the beginners that we are all riding the waves in the many markets (Forex, shares, crypto, indices, futures, options, etc). Therefore, you are not alone. Do not underestimate the negative emotions sometimes engulf someone's lives. As you are not alone, you are in this tradingview family !!
When you make money, share it. Share how you make it win (not by gambling)
When you lose money, share it, too. Share how to make it lose (no excuses).
Be a responsible generous trader you are, find your peak performance, equip your skills to unleash your momentum to success.
The PAST does not equal the FUTURE unless you live there.
Thank you for reading.
All the best

Price Action Lesson 3: Hammer, The first sign of beginning ...Hammer, The first sign of the beginning Ascending wave:
Hammer shows that the war between buyers and sellers, at the beginning of the day sellers could create significant reduction in price, with their high investments. But when the price had come to the lowest extent of it, many of buyers have entered with more investments than sellers. And again they could increase the price close to what it was at the beginning of the day or may even more. And at the war that was between buyers and sellers, the buyers have been the winners of the day, and the market is largely in control of them. Thus, the possibility of further price increases in the coming days is enormous.
example: picture Shows, currency pair of EUR/USD -0.31% in a 30 minutes time frame.
At the beginning, by increasing investments of sellers, the price became to 1.16886 But in this range with the arrival of large buyers to the market and overcome to turnover of shopping on sales transactions, the price increased again. Sellers could increase the selling price due to the amount of demand from buyers. The starting price is may be at 1.17495 but it increased by the end of the day to 1.17578.
As what can be seen, after forming Hammer , an Ascending wave started and the Price have increased more.

Price Action Lesson 2: Conditions of a Perfect Hammer Conditions of a Perfect Hammer:
. Body height must be short.
. The total height of the candle must be taller than the Daily ATR-264. The taller the candle is, the stronger the Hammer is.
. The lower shadow’s length should be very tall. It is better to be over 75 percent of the Daily ATR-264.
. The upper shadow does not exist, or if it does, it is very small. It shouldn't be more than 25 percent of the Daily ATR-264.
. The hammer that has an ascending body is stronger than the one which has a descending body.

Hammer Candlestick Pattern DefinitionHammer Candle Stick Definition
If there was a large drop in price in the middle of the day, but before the day ended it increased to what it was at the beginning of the day and even more, a significant upward return occurred. The candlestick of this change (move) will be a Hammer in a daily time frame. A Hammer formation on the daily time frame is a very strong indication for probability of increasing price in next days.
Example: The picture shows currency pair of EUR/USD in a 30 minute time frame. On Ausust 09, 2017 the price significantly decreased from 1.17495 to 1.16886 or even lower. But after that, it increased rapidly at the end of the day to 1.17578 and then closed.
Also in this picture - for better understanding - the Hammer Candlestick in the daily time frame - in the result of changes in a day - is drawn.

Heikin-Ashi Monthly Trend StrategyTrade current Heikin-Ashi monthly trend long or short/bonds/cash
Reverse trade with a decisive break of the 7 period Moving Average at close of monthly candle
Decisive means non-Doji candle with body 50% or more above/below the 7MA
Doji or indecisive break of 7MA may just be consolidation, stay with current trend

PRO-GAP Tutorial PRO-GAP Tutorial
Today is Monday and GBPAUD formed a PRO-GAP
Definition of pro gap is:
the gaps' direction is the opposite of the last candle's direction.
We can see Last Friday's closing price was 1.6793
and this morning's opening price was 1.6849
which means all the sellers who sold in the last candle were trapped.
Therefore a good trading plan was developed:
wait for price to pull back and buy
it actually pulled back into the last candle's opening price.
and it is also a 0.618 level.
Buy from 1.6814, SL 1.6790
and the result is almost 7 times Reward/Risk Ratio

USDJPY > Simple candlestick signals easy to recognizeEducation > Basic Candlestick Signals
Chart > USDJPY > Non-Farm Payroll News Release > Friday, Oct. 6, 2017 - 8:30 A.M.
Analysis in chart
1. Large body w/small wicks indicate strength
2. Larger the body w/smaller wicks indicate greater strength
3. Long wick w/body at opposite end of candle indicates shift in trend momentum
4. Wicks at both sides w/smaller body in middle indicates indecisiveness and both sides have equal strength
5. Larger wicks w/smaller body in middle indicates increase of indecisiveness
* Personal analysis only. Please use your own rules and strategies prior to entering market.
** Forex trading involves HIGH RISK.
Before entering a trade, carefully consider your objectives, financial resources and level of experience.

EUR/USD - When is a market turning? 4 price action tips!Good chart reading and technical analysis do not have to be complicated. A trader should focus on a few key principles when trying to understand a price chart.
In my trading, I have stripped away everything that doesn’t provide value and I have optimized the points on my checklist that I use to read price charts. Below you see the current EUR/USD chart on the Daily timeframe and it offers a great learning opportunity because it shows us that ‘something’ is happening here.
Price is/was in a strong uptrend and now things are slowly turning. The amateur/losing trader will make the mistake of jumping in too early because he ‘feels’ that something is happening here but he is too early. Price is NOT yet ready to move lower and it’s too early to jump on the signal. But let’s start at the beginning and let me give you a few key principles that will help you understand trends and consolidations better:
1. Count of bearish vs. bullish candles
When you suddenly see that price is showing more bearish candles after an uptrend and the ratio between bullish and bearish candles changes, it can be a first important signal that a trend is losing momentum.
2. Ratio between wicks and bodies
During a trend, there are usually smaller wicks and larger bodies as the price keeps trending into the direction of the trend. When candles start to show longer wicks and smaller bodies, something is happening and momentum might be fading.
3. Length of trendwaves
When the trendwaves lose strength, they become shorter. Before a market turns, you can often see that the final trendwave is becoming much shorter
4. Support and resistance barriers
Once price starts breaking the “higher high / higher low” or “lower high / lower low” sequence that describe healthy trends, you know that something big is happening. When, like in the EUR/USD example, price breaks the blue marked level, price will make the first lower low for the first time in over 4 months. Putting it all together with the previous points, we can then see that the trend is likely going to reverse.

USDCAD, CLASSIC inside bar tradeIf I'm asked about what is the most interesting part for inside bar trade, my answer is "trailing".
1st kick is only for risk management purpose to make me able to deposit the risk to other trades, the outstanding risk-reward ratio is about the other half of the positions.
The other half is very important so I need it to run as much as possible, so I NEVER put sell limit order for the other half of the positions, I would more like to change my out only.
With trailing in mind, I never have to worried about whether to sell or not, all I need to do is to wait for pivot to put my out (LH/HL).
This inside bar trade is a multi-reason combination itself
1. 1st inside bar after the rate hike (both direction trade)
2. inside bar after new low (short)
3. the more inside bars in a row the better
It literally was a MUST trade for all the inside bar traders.

Reverse pattern in EURUSDA beautiful reverse pattern in the EURUSD invites to a short trade.
What are the signs for a short?
perfect evening star formation
CCI turns again below 100
overdue correction
changing monetary policy
How could a trade look like?
There are several possibilities.
Short-term trade: Entry immediately, SL at 1.1979 and TP at 1.1718
Medium to long-term trade: Entry immediately, SL at 1.21 and TP at 1.15
