What’s America's Real Goal in a Possible India–Pakistan War?We are nearing the end of the petro-dollar era. The power balance of the new world order will be defined not by oil, but by the strategic resources essential for AI, electric vehicles, and cutting-edge technology.
Throughout the 20th century, the U.S. maintained its global dominance by controlling access to oil. From the Middle East to Latin America and Africa, wherever oil was found, the U.S. was there.
But today, the focus has shifted to rare earth elements, lithium, copper, and other strategic minerals.
Trump’s 2025 move to buy Greenland wasn’t a diplomatic joke—it was a signal. Behind-the-scenes deals in Ukraine for rare earth deposits tell the same story: whoever controls these "white gold" assets will lead the tech-driven world.
Now enters Pakistan, with mineral-rich lands spanning over 600,000 km², nearly three times the size of the UK. Experts estimate its underground reserves to be worth $8 trillion.
In Balochistan's Rekodik field alone, there are 12 million tons of copper and 20 million ounces of gold, with a copper purity of 0.53%, well above global standards. In the north, newly discovered lithium reserves could be a game-changer for the EV revolution.
This is no longer just about resources—this is about deciding the future balance of global power.
Metals

How to Trade Gold with AI-Powered Algos in 2025📊 How to Trade Gold with AI-Powered Algos in 2025
A practical action plan for serious gold traders
🔍 1. Know Why Gold Requires Custom Algo Tactics
Gold is volatile, news-sensitive, and driven by macro events like Fed policy, geopolitics, and inflation. Generic stock or crypto bots fail here — gold needs precise, event-aware automation.
🧠 2. Use AI-Powered Bots Trained for Gold Volatility
Deploy bots that adapt to real-time data like CPI releases, bond yields, and geopolitical headlines. Use machine learning models that detect gold breakouts, consolidations, and safe-haven flows.
Top AI algos for gold traders: Multiple systems based on MT4/MT5
Fully-automated, AI-based gold bot with breakout detection, precision entries, and built-in risk control.
⚙️ 3. Build or Choose the Right Algo Strategy for Gold
Trend-Following: Use 21/50 EMA crosses on H1 and H4
Mean Reversion: Bollinger Band fades in range-bound sessions
Breakout Algos: Trigger trades on CPI or FOMC event volatility
Volume-Based AI: Analyze volume spikes vs. historical patterns
🧪 4. Backtest Gold-Specific Models
Always test your bot using historical gold data, especially during NFP weeks, Fed meetings, and geopolitical escalations. Use data from 2018 to 2024 for high-volatility periods.
Tools: TradingView for Pine Script testing, MetaTrader 5 for EA deployment
🛡️ 5. Control Risk with Gold-Specific Parameters
Max drawdown: Keep under 15 percent
Stop-loss: Always use hard stops (not just trailing)
Position sizing: 0.5 to 1 percent of capital per trade
Use volatility filters: Avoid entries during thin liquidity hours
🔄 6. Automate Monitoring and Adaptation
Run multiple bots for breakout, momentum, and reversal setups
Use dashboards to track gold-specific metrics like VIX, USDX, DXY, and 10Y Treasury yields Integrate AI that adjusts parameters after major data releases
🚀 7. Prepare for 2025 Market Structure
Gold is increasingly driven by
Central bank digital currency rollouts
USD de-dollarization risks
Global stagflation or recession themes
DeFi and tokenized gold products
Your algo must factor in these macro narratives using real-time data feeds
📌 Gold Algo Trading Success Plan 2025
Use AI bots built for gold volatility
Trade high-probability breakouts post-news
Backtest with gold-specific macro filters
Maintain strict risk limits with max 15 percent drawdown
Monitor global news and macro data with bot triggers
Continuously optimize and adapt
Gold is not just a commodity — it’s a signal of global risk. Automate smartly, manage risk tightly, and use AI to stay one move ahead.

SPY/QQQ Plan Your Trade Update : Behind The Scenes ResearchI want to say thank you to all of you and to share with you all the work/resources/servers/and other data I maintain to help me identify where and how the markets will present opportunities to all of us.
This video shows you a bit of the behind-the-scenes work I do and some of my proprietary modeling systems.
I'm not sharing this with you to try to win you over or to tell you I do more than anyone else in terms of research. I'm sure there are many others who go much further than I do in terms of trying to dissect the markets and the opportunities available.
But I do believe I deliver very unique research, which is a one-of-a-kind solution for traders.
Again, I'm not 100% accurate (I wish I were).
But I am trying to share some of the decision-making solutions I use to understand where the markets are likely to move over the next 2- 4+ months and how traders can profit from my research.
Remember, you are only seeing about 10% of my total research, tools, modeling systems, and capabilities in these Plan Your Trade videos.
I want to thank all of you who continue to value my work. It is not easy. It takes money, time, and resources to continue to monitor all of these systems/algos.
The end result, I believe, is one of the most unique future/current modeling system resources you can find anywhere.
Again, thank you for making my research a success. I promise to do more and improve my tools over the next 12+ months for everyone to find better profits.
Get some.
#trading #research #investing #tradingalgos #tradingsignals #cycles #fibonacci #elliotwave #modelingsystems #stocks #bitcoin #btcusd #cryptos #spy #gold #nq #investing #trading #spytrading #spymarket #tradingmarket #stockmarket #silver

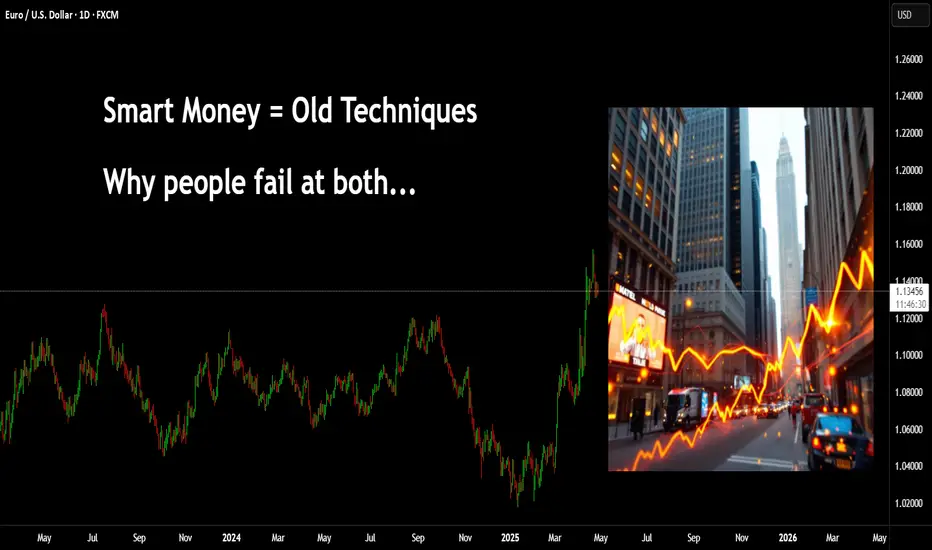
Why does it always go against you? You might be new to trading, you may have several years of experience. But, where a lot of people still seem to go wrong is in not realising the relationships.
I have posted hundreds of educational posts here on Tradingview from cartoons, trying to simplify techniques through to market relationships between technical systems such as Elliott Wave and Wyckoff.
Many new traders fall foul of social media posts covering "SMC - Smart Money Concepts" and are not seasoned enough to appreciate what or why these can work for some and not for others.
You have Elliott Wave traders, there is a saying along the lines of "if you put 10 Elliott traders in a room searching for a wave count you will come out with 11 different answers"
This isn't to say Elliott doesn't work, nor Smart Money.
The market seeks liquidity, it forms seemingly complex patterns that humans try to make sense of. We are great at that, seeing patterns even if they are not there. - Look, there's an upside-down butterfly 1.618 extension!
First, you need to appreciate Elliott Wave counts on smaller timeframe are pointless, especially in the age of algo's and bots. However, sentiment on the larger timeframes can't really be spoofed.
In this first image; you can see a market wave that is straight out of a textbook.
Let's also add some Wyckoff; if you were to visualise this - Wyckoff schematics would be visible on smaller timeframes, the Green boxes represent accumulation and the Red show distribution.
Let's overlay and Elliott Wave count -
Take that to the next level, this count is only part of a higher fractal count.
How does this fit into smart money concepts? well, it's more like - How does Smart Money fit into this?
Elliott waves and Wyckoff have been around for over 100 years. Many of the techniques shown on YT video's today can be traced back to these older concepts.
Now, if you can see how a 1-2 EW count pushes up for a 3. You can zoom in again and start to see what to expect when trading using SMC.
In this image you can see a drop, then a gap as price pushes back up (I haven't bothered drawing wicks for simplicity assume their inside the box)
Many traders would now anticipate a move that looks something like this.
Only to see price do this
Yeah - you're not the only one!
The next issue is where and how Supply and Demand is drawn.
Ok, the gap didn't hold, it must be the demand level there. GO AGAIN!!!
How did that play out? Trade 1, Trade 2 =
What about now?
Price holds the support
This time you are afraid to go in. Then one of two things happens.
1)
Or
2)
In the first image, we can see a sweep of prior liquidity and that creates momentum for a move up. In the second image, price simply melts away.
This is an easy fix. It all comes down to understanding what the charts are trying to tell you.
People love to talk about how "Smart Money" is the banks and institutional players - how they are playing against you on every click of the button.
The truth is, most people don't understand the market.
When larger players enter the market, the can leave a pretty obvious footprint. In addition to that - they leave behind orders they had but were unable to fill. These orders they will be defended with even more buying or selling (if they need to), and this is the premise for a rally and pullback or a drop to pullback.
Now, visualise a 1-2 Elliott Wave move. Why do you think 2 often comes back so deep?
What would you expect the move from 2-3 to do?
Powerful push, yes?
In this image, the move that created demand is simply the opposing colour candle before the power play. The significant move pushed up (showing institutional involvement). Hence, a location they will likely defend.
In addition to the push up, they pushed with so much money - it created a natural gap.
This type of example doesn't always have to be a power play 1-5 up, it could be visualised on pullback moves too.
Here's a great example recently on Euro.
The demand candle 'buy before the sell" is clearly targeted on the way up. Price fails to close above it, drops, goes back to retest - sweeps and drops. If you were to zoom in you will see on smaller timeframes evidence of a Wyckoff schematic with a UTAD.
Add a volume profile there.
As the price breaks above, after it's pullback you can see an acceleration in price and of course the area has the PoC.
Back to where people go wrong.
They will see this GAP created and assume price will come back here to reject and go. However, look closer and the demand that started the move is very near that gap.
Where is the juicy liquidity? PoC is another little clue.
Let's take this to another level.
In this image I have a range, using the prior high just to give the example in this post.
We are in an uptrend = we just broke the high, we expect a Pullback. Where would that likely target?
Zoom in again. This time I have added a fixed range volume tool.
What do you know?!
Anyways, once you get a handle on the bigger picture and understand the relationships, you can zoom into any timeframe you like - the game is always the same.
Have a great week all!
Disclaimer
This idea does not constitute as financial advice. It is for educational purposes only, our principal trader has over 25 years' experience in stocks, ETF's, and Forex. Hence each trade setup might have different hold times, entry or exit conditions, and will vary from the post/idea shared here. You can use the information from this post to make your own trading plan for the instrument discussed. Trading carries a risk; a high percentage of retail traders lose money. Please keep this in mind when entering any trade. Stay safe.
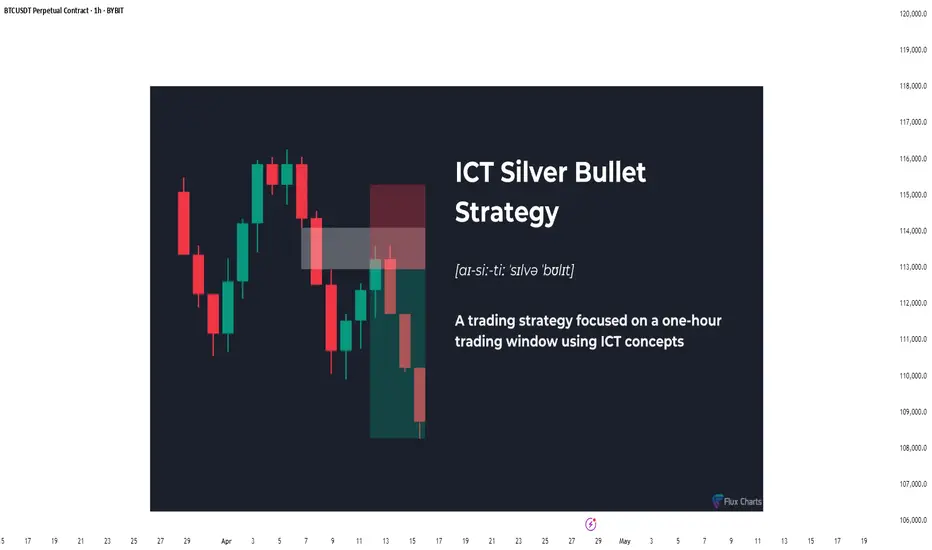
The Hidden Power of the Silver Bullet Strategy - Full GuideIntroduction
The Silver Bullet Strategy is a high-probability intraday trading technique popularized within the Smart Money Concepts community. It focuses on taking precision trades during specific times of the day when liquidity is most active. Mastering this strategy can help traders consistently capture high-quality setups with minimal risk.
In this guide, we will cover:
- What the Silver Bullet Strategy is
- Key Times to Watch
- Entry Models
- Target Setting
- Risk Management
- Real Chart Examples
---
What is the Silver Bullet Strategy?
The Silver Bullet Strategy is based on trading within a "window" of high-probability price action, typically during key liquidity times. It looks to capture moves after liquidity sweeps, order block mitigations, and Fair Value Gap (FVG) plays.
Key Principles:
- Focuses on high-probability windows (New York session especially)
- Waits for a liquidity grab and displacement
- Entries are often on FVGs, OBs, or MSS points
---
Silver Bullet Timing Windows
Timing is crucial to this strategy. The "Silver Bullet" typically occurs in these windows (New York time):
- First Window: 10:00 AM - 11:00 AM (New York)
- Second Window: 2:00 PM - 3:00 PM (New York)
These times capture major moves post-liquidity sweeps or reversals after news/market manipulation.
---
Silver Bullet Entry Model
The classic sequence for a Silver Bullet setup:
1. Identify Liquidity Sweep: Look for price to grab liquidity above a swing high or below a swing low.
2. Look for Displacement: A strong move away from the sweep, creating a Fair Value Gap (FVG) or Breaker Block.
3. Entry in FVG or OB: Enter on a retracement into the FVG or Order Block after displacement.
4. Confirmation: Use lower timeframe MSS or BOS to confirm the reversal.
Liquidity sweep and FVG at the 5m:
MSS + Displacement candle at the 1m:
So all 4 steps completed!
Example Entry Checklist:
- Liquidity sweep
- Strong displacement creating an FVG
- Price retraces into FVG or OB
- MSS/BOS confirmation
- Execute trade with tight stop-loss
---
Where to Set Targets
Targets should be logical based on market structure:
- First Target: Recent internal liquidity (equal highs/lows)
- Second Target: External liquidity zones (major swing highs/lows)
- Optional: Use 1R/2R/3R scaling based on risk-to-reward goals
---
Risk Management for Silver Bullet Trades
Golden Rules:
- Risk less than 1% per Silver Bullet setup
- Set stop-loss beyond the liquidity sweep (not too tight, not too loose) or above FVG
candle
- Stick to one or two trades per window maximum
- Avoid revenge trading outside the windows
---
Common Mistakes to Avoid
- Trading outside the specified time windows
- Entering without a confirmed sweep and displacement
- Overleveraging because the strategy "looks easy"
- Ignoring higher timeframe bias (HTF context is still critical!)
Pro Tip: Combine Silver Bullet entries with SMT Divergences, MSS, and IFVGs for maximum confluence.
---
Final Thoughts
The Silver Bullet Strategy is one of the cleanest ways to approach intraday trading. By mastering liquidity concepts, timing, and precision entries, traders can catch powerful moves with strong risk-to-reward setups.
Be patient, wait for your window, and always trade with discipline.
Happy Sniping!
Forex Grid Trading Overview: Practical Guide for 2025Forex Grid Trading Strategy: Detailed Overview & Low-Risk EUR/USD Application
1️⃣ What Is Grid Trading?
A grid trading strategy places a series of **buy** and **sell** orders at fixed intervals (“grid levels”) above and below a base price, without forecasting market direction. As price oscillates, it triggers orders across the grid, locking in small profits on each swing.
- **No Directional Bias** – Profits on both up- and down-moves
- **Automated Entry/Exit** – Ideal for Expert Advisors (EAs) on MT4/MT5
- **Scalable** – Grid size and lot sizing can be tailored to account size and volatility
2️⃣ How It Works – Core Components
1. **Grid Levels**
- Define a **base price** (e.g. current EUR/USD mid)
- Set **intervals** (e.g. every 20 pips) above/below the base
2. **Orders**
- **Buy Limit** orders at 20, 40, 60 pips below base
- **Sell Limit** orders at 20, 40, 60 pips above base
3. **Take Profit (TP) for Each Order**
- TP typically equals the grid interval (e.g. 20 pips) so each triggered order nets a small profit
- No hard Stop Loss per order—risk is managed via overall exposure
4. **Cumulative P&L**
- Winning trades roll profits into the floating drawdown of unfilled orders
- As price oscillates, the grid “locks in” incremental gains
3️⃣ Pros & Cons
| Pros | Cons |
|---------------------------------------|------------------------------------------|
| ✅ Profits in ranging markets | ❌ Can incur large drawdowns in strong trends |
| ✅ Automated, systematic execution | ❌ Requires significant margin for multiple open trades |
| ✅ Scalable to any time-frame | ❌ Floating negative exposure if grid one-sided |
---
✅Low-Risk Best Practices
1. **Grid Spacing & Width**
- Wider grid intervals (e.g. 30–50 pips) reduce order density and margin use
- Use **ATR** (Average True Range) to adapt spacing to EUR/USD volatility
2. **Lot Sizing & Equity Risk**
- Risk ≤ 1–2% equity per full grid cycle
- Use **fixed fractional** sizing: each order size = (Equity × 1%) / (max number of open grid orders)
3. **Drawdown Control**
- **Maximum Open Orders** cap (e.g. 5 orders per side)
- **Equity Stop-Out**: if floating drawdown exceeds e.g. 10% of equity, close all orders
4. **Trend Filters**
- Use a **200-period SMA** or **ADX** filter: only enable sell grid if price < SMA (downtrend) or ADX < 25 (low momentum)
- Disables grid in strong one-way trends
5. **Grid Shifting / Re-Base**
- After a net grid profit, **shift** the base price to current mid to reset exposure
- Prevents runaway open trades far from current price
5️⃣ Step-by-Step: Applying to EUR/USD
1. **Choose Time-Frame**
- **H4 or H1** recommended: balances signal frequency and margin needs
2. **Define Grid Parameters**
- **Base Price:** current EUR/USD mid (e.g. 1.0980)
- **Interval:** 30 pips (≈ recent ATR on H4)
- **Levels:** 3 buys at 1.0950 / 1.0920 / 1.0890; 3 sells at 1.1010 / 1.1040 / 1.1070
3. **Set Order Size**
- Account equity $10 000, risk 1% = $100 per full grid
- Max open orders 6 → each order $100/6 ≈ $16.7 → ≈ 0.02 lots
4. **Configure TP & No SL**
- Each order TP = 30 pips (equals interval)
- No per-order SL; overall drawdown managed by equity stop
5. **Implement Filters**
- Only open **sell** grid if H4 close < 200-SMA; only open **buy** grid if H4 close > 200-SMA
- Pause grid if ADX > 30 (strong trend) or market events (e.g. NFP, ECB rate decision)
6. **Deploy & Monitor**
- Run on MT4 with an EA or semi-automated Expert Advisor
- Monitor margin usage; adjust grid or disable before major news
6️⃣ Example P&L Mechanics
| Trigger Price | Order Type | Entry | TP Target | Profit (pips) |
|---------------|------------|---------|-----------|---------------|
| 1.0950 | Buy Limit | 1.0950 | 1.0980 | 30 |
| 1.0980 | Sell Limit | 1.0980 | 1.1010 | 30 |
- If price moves down to 1.0950: buy executes, TP at 1.0980 nets +30 pips
- If price then climbs above base, sells trigger at 1.1010 nets +30 pips
2️⃣ Introducing Progressive & Regressive Scaling
🔼 2.1 Progressive Scaling
“Let winners run”—increase exposure after success
Concept: After each profitable grid cycle, step up your lot size by a fixed increment.
Why: Capitalizes on momentum and winning streaks.
How to apply:
Base Lot: 0.02 lots per order (1% equity risk).
After grid closes net-positive, next cycle = 0.03 lots.
Continue stepping up (0.04, 0.05 …) until a drawdown or equity-stop is hit.
Reset back to base lot after a losing cycle or whenever floating drawdown > 5%.
Caps & Safeguards:
Max Lot Cap: Never exceed 0.10 lots (or 2% equity risk).
Equity Stop: If floating drawdown > 10%, close cycle & reset.
🔽 2.2 Regressive Scaling
“Protect the downside”—reduce exposure after losses
Concept: After a losing grid cycle, step down your lot size to conserve capital.
Why: Limits damage during rough periods and preserves margin.
How to apply:
Base Lot: 0.02 lots per order.
If grid hits equity-stop or nets negative, next cycle = 0.015 lots.
Continue stepping down (0.01, 0.005) until you record a net-positive cycle.
Reset to base lot after recovery (e.g. two consecutive winning cycles).
Thresholds:
Don’t drop below 0.005 lots (to avoid over-shrinking).
After two winning cycles at reduced lot, return to base.
✅ Bottom Line
Forex grid trading on EUR/USD can generate steady gains in choppy markets—but demands **strict risk controls** (grid spacing, lot sizing, drawdown limits) and **trend filters** to avoid large losses in trending conditions. When properly applied, a low-risk grid on EUR/USD offers a robust, mostly hands-off strategy for capturing repetitive market swings.
4️⃣ Key Takeaways
Progressive Scaling lifts lot sizes on winning streaks, amplifying gains—but must be capped and reset on losses.
Regressive Scaling shrinks exposure after drawdowns, preserving capital until the strategy recovers.
Combine both with your grid’s risk parameters, trend filter, and a solid equity-stop to maintain a balanced, low-risk EUR/USD grid.
By layering scaling rules atop your grid, you adapt dynamically to market performance—maximizing winners and protecting against prolonged losing runs. Good luck! 🚀

Are You Taking the Right Risks in Trading? RISK Per Trade Basics
What portion of your equity should you risk for your trading positions?
In the today's article, I will reveal the types of risks related to your position sizing.
Quick note: your risk per trade will be defined by the distance from your entry point to stop loss in pips and the lot size.
🟢Risking 1-2% of your trading account per trade will be considered a low risk.
With such a risk, one can expect low returns but a high level of safety of the total equity.
Such a risk is optimal for conservative and newbie traders.
With limited account drawdowns, one will remain psychologically stable during the negative trading periods.
🟡2-5% risk per trade is a medium risk. With such a risk, one can expect medium returns but a moderate level of safety of the total equity.
Such a risk is suitable for experienced traders who are able to take losses and psychologically resilient to big drawdowns and losing streaks.
🔴5%+ risk per trade is a high risk.
With such a risk, one can expect high returns but a low level of safety of the total equity.
Such a risk is appropriate for rare, "5-star" trading opportunities where all stars align and one is extremely confident in the positive outcome.
That winner alone can bring substantial profits, while just 2 losing trades in a row will burn 10% of the entire capital.
🛑15%+ risk per trade is considered to be a stupid risk.
With such a risk, one can blow the entire trading account with 4-5 trades losing streak.
Taking into consideration the fact that 100% trading setups does not exist, such a risk is too high to be taken.
The problem is that most of the traders does not measure the % risk per trade and use the fixed lot.
Never make such a mistake, and plan your risks according to the scale that I shared with you.
❤️Please, support my work with like, thank you!❤️
I am part of Trade Nation's Influencer program and receive a monthly fee for using their TradingView charts in my analysis.

Trump's Tariff Wars : Why It Is Critical To Address Global TradeThis video, a continuation of the Trump's Tariff Wars video I created last week, tries to show you why it is critically important that we, as a nation, address the gross imbalances related to US trade to global markets that are resulting in a $1.5-$1.8 TRILLION deficit every fiscal year.
There has been almost NOTHING done about this since Trump's last term as President.
Our politicians are happy to spend - spend - spend - but none of them are worries about the long-term fiscal health of the US. (Well, some of them are worried about it - but the others seem to be completely ignorant of the risks related to the US).
Trump is raising this issue very early into his second term as president to protect ALL AMERICANS. He is trying to bring the issue into the news to highlight the imbalances related to US trade throughout the world.
When some other nation is taking $300B a year from the us with an unfair tariff rate - guess what, we need to make that known to the American consumer because we are the ones that continue to pay that nation the EXTRA every year.
Do you want to keep paying these other nations a grossly inefficient amount for cheap trinkets, or do you want our politicians and leaders to take steps to balance the trade deficits more efficiently so we don't pass on incredible debt levels to our children and grandchildren?
So many people simply don't understand what is at risk.
Short-term - the pain may seem excessive, but it may only last 30, 60, 90 days.
Long-term - if we don't address this issue and resolve it by negotiating better trade rates, this issue will destroy the strength of the US economy, US Dollar, and your children's future.
Simply put, we can't keep going into debt without a plan to attempt to grow our GDP.
The solution to this imbalance is to grow our economy and to raise taxes on the uber-wealthy.
We have to grow our revenues and rebalance our global trade in an effort to support the growth of the US economy.
And, our politicians (till now) have been more than happy to ignore this issue and hide it from the American people. They simply didn't care to discuss it or deal with it.
Trump brought this to the table because it is important.
I hope you now see HOW important it really is.
Get some.
#trading #research #investing #tradingalgos #tradingsignals #cycles #fibonacci #elliotwave #modelingsystems #stocks #bitcoin #btcusd #cryptos #spy #gold #nq #investing #trading #spytrading #spymarket #tradingmarket #stockmarket #silver

Blueprint for Becoming a Successful Forex Trader in 2025🚀 Blueprint to Becoming a Successful Forex Trader in 2025: Leveraging ICT, Automation, and Prop Funding
Here’s a detailed, actionable blueprint designed to position you for success by carefully navigating broker selection, adopting advanced trading strategies, obtaining prop funding, and integrating automation and AI technologies into your trading.
🏦 Broker Selection (Actionable Steps)
🔍 Choose brokers with true ECN/STP execution
⚡ Ensure brokers offer low spreads (0.0-0.2 pip average) and fast execution to maximize ICT precision entries.
🛡️ Prioritize brokers regulated by ASIC, FCA, or FSCA with verified Myfxbook execution reports.
📊 Confirm broker compatibility with MetaTrader 4 (MT4) to seamlessly integrate Expert Advisors (EAs).
💳 Check for flexible withdrawal/deposit methods and swift payouts (Crypto, Wise, Revolut).
🎯 Trading Strategy (ICT Concepts & Supply-Demand Zones)
🧠 Master ICT Concepts: Liquidity sweeps, Order Blocks (OB), Fair Value Gaps (FVG), Market Structure Breaks (MSB).
📍 Combine ICT with Supply-Demand: Identify institutional supply-demand zones aligning with ICT Order Blocks & liquidity areas.
📐 Execute High-Probability Setups: Trade only after liquidity grabs at key daily/weekly ICT points, avoiding retail traps.
📈 Time & Price Theory: Trade London Kill Zones and New York Open exclusively, exploiting predictable ICT volatility.
📆 Weekly Preparation: Annotate D1/H4 charts on weekends marking liquidity points, order blocks, and premium/discount zones clearly.
💰 Getting Prop Funding (Actionable Approach)
🥇 Target reputable prop firms (FTMO, MyForexFunds, The Funded Trader, 8cap, etc) with clear and attainable evaluation objectives.
📑 Use ICT trading style for evaluation: lower-frequency, high-probability trades with clearly defined risks.
🎯 Implement strict risk management rules: never exceed 1% risk per trade, aiming for steady account growth (5-10% monthly target).
📊 Monitor performance closely using provided analytics dashboards (e.g., FTMO Metrics App) and adapt accordingly.
📚 Diversify funded accounts across multiple firms, compounding total available trading capital while reducing firm-specific risk.
⚙️ Automating & Executing Trades (MT4 EA & Bots)
🛠️ Hire experienced MQL4 developers to code custom ICT-based MT4 Expert Advisors
🤖 Develop EAs specifically around ICT logic (Order Block detection, liquidity grabs, market structure shifts) and or supply/demand logic
🤖 use advanced algo based breakout EAs for automation
📌 Automate trade management: EAs should handle entry precision, partial exits, break-even stops, and trail stops.
📡 Set EAs on VPS Hosting (NY4, LD4) for optimal latency and consistent execution (ForexVPS, AccuWeb Hosting).
📈 Regularly perform forward-testing and optimization of EAs on demo accounts before live deployment (at least quarterly optimization).
📲 Integrating Advanced Bots and Technology in 2025
📊 Combine your MT4 EAs with third-party analytics platforms for detailed trade performance insights.
🔮 Incorporate AI-based forecasting tools to refine ICT setups and trade signals.
🔔 Use automated bots for real-time alerts on ICT-based setups via Telegram or Discord channels.
🧑💻 Maintain manual oversight for discretionary ICT decisions—use automation for entry efficiency, not blind reliance.
🔄 Continuously retrain and update your bot’s logic monthly using the most recent trade data, ensuring adaptive execution.
🗓️ Daily Routine for Success
🌅 Pre-session (30 mins): Review annotated charts, ICT concepts (liquidity, OB, FVG), and supply-demand levels.
💻 During trading session: Monitor EA execution, manually adjust positions based on real-time ICT setups.
📝 Post-session (15 mins): Journal trades meticulously in detail, noting ICT reasoning behind wins and losses.
📆 Weekly review: Assess overall ICT & EA performance—adjust EA parameters as needed to match evolving market conditions.
📚 Continuous learning: Keep updated on advanced ICT framework,
supply demand zone trading.
📌 Final Actionable Advice for 2025
🔍 Specialize intensely on ICT & supply-demand concepts rather than multiple strategies—depth over breadth.
🚩 Always adapt and evolve your trading algorithms to ICT methodology—market dynamics continually change.
🧘 Maintain emotional discipline and patience, relying on high-probability setups to steadily compound your account.
💡 Stay ahead by embracing technology: automation, AI-driven forecasting, and custom ICT tools will provide a significant edge in 2025.

Trump's Tariff Wars : What To Expect And How To Trade Them.I promised all of you I would create a Trump's Tariff Wars video and try to relate that is happening through the global economy into a rational explanation of HOW and WHY you need to be keenly away of the opportunities presented by the new Trump administration.
Like Trump or not. I don't care.
He is going to try to enact policies and efforts to move in a direction to support the US consumer, worker, business, and economy.
He made that very clear while campaigning and while running for office (again).
This video looks at the "free and fair" global tariffs imposed on US manufacturers and exports by global nations over the past 3+ decades.
For more than 30+ years, global nations have imposed extreme tariffs on US goods/exports in order to try to protect and grow their economies. The purpose of these tariffs on US good was to protect THEIR workers/population, to protect THEIR business/economy, to protect THEIR manufacturing/products.
Yes, the tariffs they imposed on US goods was directly responsible for THEIR economic growth over the past 30-50+ years and helped them build new manufacturing, distribution, consumer engagement, banking, wealth, and more.
The entire purpose of their tariffs on US goods was to create an unfair advantage for their population to BUILD, MANUFACTURE, and BUY locally made products - avoiding US products as much as possible.
As I suggested, that is why Apple, and many other US manufacturers moved to Asia and overseas. They could not compete in the US with China charging 67% tariffs on US goods. So they had to move to China to manufacture products because importing Chinese-made products into the US was cheaper than importing US-made products into China.
Get it?
The current foreign Tariffs create an incredibly unfair global marketplace/economy - and that has to STOP (or at least be re-negotiated so it is more fair for everyone).
And I believe THAT is why Trump is raising tariffs on foreign nations.
Ultimately, this will likely be resolved as I suggest in this video (unless many foreign nations continue to raise tariff levels trying to combat US tariffs).
If other foreign nation simply say, "I won't stand for this, I'm raising my tariff levels to combat the new US tariffs", then we end up where we started - a grossly unfair global marketplace.
This is the 21st century, not the 18th century.
Step up to the table and realize we are not in the 1850s or 1950s any longer.
We are in 2025. Many global economies are competing at levels nearly equal to the US economy in terms of population, GDP, manufacturing, and more.
It's time to create a FREE and FAIR global economy, not some tariff-driven false economy on the backs of the US consumers. That has to end.
Get some.
#trading #research #investing #tradingalgos #tradingsignals #cycles #fibonacci #elliotwave #modelingsystems #stocks #bitcoin #btcusd #cryptos #spy #gold #nq #investing #trading #spytrading #spymarket #tradingmarket #stockmarket #silver

Using The CRADLE Pattern To Time/Execute TradesThis simple video highlights one of my newest pattern definitions - the Cradle Pattern.
In addition to the many other patterns my technology identified, this Cradle Pattern seems to be a constant type of price construct.
I'm sharing it with all of you so you can learn how to identify it and use it for your trading.
Ideally, this pattern represents FLAGGING after a trend phase.
It is a consolidation of price within a flag after a broad trending phase.
It usually resolves in the direction of the major trend, but can present a very solid reversal trigger if the upper/lower pullback range is broken (see the examples in this video).
Learn it. Use it.
Price is the ultimate indicator.
Learn to read price data more efficiently to become a better trader.
Get some.
#trading #research #investing #tradingalgos #tradingsignals #cycles #fibonacci #elliotwave #modelingsystems #stocks #bitcoin #btcusd #cryptos #spy #gold #nq #investing #trading #spytrading #spymarket #tradingmarket #stockmarket #silver

The Greatest Opportunity of Your Life : Answering QuestionsThis video is an answer to Luck264's question about potential price rotation.
I go into much more details because I want to highlight the need to keep price action in perspective related to overall (broader) and more immediate (shorter-term) trends.
Additionally, I try to highlight what I've been trying to tell all of you over the past 3+ years...
The next 3-%+ years are the GREATEST OPPORTUNITY OF YOUR LIFE.
You can't even imagine the potential for gains unless I try to draw it out for you. So, here you go.
This video highlights why price is the ultimate indicator and why my research/data is superior to many other types of analysis.
My data is factual, process-based, and results in A or B outcomes.
I don't mess around with too many indicators because I find them confusing at times.
Price tells me everything I need to know - learn what I do to improve your trading.
Hope you enjoy this video.
Get Some.
#trading #research #investing #tradingalgos #tradingsignals #cycles #fibonacci #elliotwave #modelingsystems #stocks #bitcoin #btcusd #cryptos #spy #gold #nq #investing #trading #spytrading #spymarket #tradingmarket #stockmarket #silver

ICT Concepts for FX and GOLD traders: 2025 edition🔍 ICT (Inner Circle Trader) is a trading methodology developed by Michael J. Huddleston. It focuses on market structure, smart money concepts (SMC), and how institutions manipulate liquidity to trap retail traders.
📚 It's not about indicators or over-complication — it's about reading the price action like a pro, understanding where liquidity is, and trading with the banks, not against them.
📐 1. Market Structure
Understand Highs & Lows: Identify break of structure (BOS) and change of character (CHOCH)
Follow the macro to micro flow: D1 > H4 > M15 for precision entries
🧱 2. Order Blocks (OBs)
An order block is the last bullish or bearish candle before a major price move.
Banks and institutions place large orders here.
Smart traders look for price to return to these areas (mitigation), then enter with tight stop losses.
👉 Think of OBs as institutional footprints on the chart.
💧 3. Liquidity Zones
Equal highs/lows, trendline touches, support/resistance — these are liquidity traps.
ICT teaches that price often hunts liquidity before reversing. That’s why many retail traders get stopped out.
Learn to trade into liquidity, not off it.
🔄 4. Fair Value Gaps (FVGs)
Also called imbalances — when price moves too fast and leaves gaps.
Price often retraces to "fill the gap" — a key entry point for ICT traders.
🥇 ICT for Gold & Forex in 2025
💰 Why It Works for XAUUSD & Majors:
Gold is a highly manipulated asset, perfect for ICT-style trading.
It responds beautifully to liquidity grabs, order blocks, and Asian–London–New York session transitions.
Forex majors (EUR/USD, GBP/USD, etc.) are also ideal since they’re heavily influenced by institutional flow and news-driven liquidity hunts.
🕐 Timing Is Everything
Trade Killzones:
📍 London Killzone: 2AM–5AM EST
📍 New York Killzone: 7AM–10AM EST
These are high-volume sessions where institutions make their moves.
📈 Typical ICT Setup
▪️Spot liquidity zone above or below recent price
▪️Wait for liquidity sweep (stop hunt)
▪️Identify nearby order block or FVG
▪️Enter on a pullback into OB/FVG
▪️Set tight SL just past the recent swing
Target internal range, opposing OB, or next liquidity level
👨💻 Why FX/GOLD Traders Love ICT
✅ It’s clean, no indicators, and highly logical
✅ Great for part-time trading — 1 or 2 trades a day
✅ Feels like "leveling up" your understanding of the market
✅ Perfect for backtesting and journaling on platforms like TradingView or SmartCharts
✅ Easy to integrate into algo-based systems or EAs for semi-automation
If you’re tired of indicators and guessing, and want to trade like the institutions, ICT is a game changer. In 2025, more prop firms and traders are applying ICT concepts to dominate markets like gold, forex, and even crypto.
🧭 Master the method. Understand the logic. Ride with the smart money.
🔥 Welcome to the next level of trading.

Trading Is Not Gambling: Become A Better Trader Part III'm so thankful the admins at Tradingview selected my first Trading Is Not Gambling video for their Editor's Pick section. What an honor.
I put together this video to try to teach all the new followers how to use analysis to try to plan trade actions and to attempt to minimize risks.
Within this video, I try to teach you to explore the best opportunities based on strong research/analysis skills and to learn to wait for the best opportunities for profits.
Trading is very similar to hunting or trying to hit a baseball... you have to WAIT for the best opportunity, then make a decision on how to execute for the best results.
Trust me, if trading was easy, everyone would be making millions and no one would be trying to find the best trade solutions.
In my opinion, the best solution is to learn the skills to try to develop the best consistent outcomes. And that is what I'm trying to teach you in this video.
I look forward to your comments and suggestions.
Get some.
#trading #research #investing #tradingalgos #tradingsignals #cycles #fibonacci #elliotwave #modelingsystems #stocks #bitcoin #btcusd #cryptos #spy #gold #nq #investing #trading #spytrading #spymarket #tradingmarket #stockmarket #silver

THE IMPORTANCE of Multiple Time Frame Analysis in Forex Gold
In my daily posts, I quite frequently use multiple time frame analysis.
If you want to enhance your predictions and make more accurate decisions, this is the technique you need to master.
In the today's post, we will discuss the crucial importance of multiple time frames analysis in trading the financial markets and forex gold in particular.
1️⃣ Trading on a single time frame, you may miss the important key levels that can be recognized on other time frames.
Take a look at the chart above. Analyzing a daily time frame, we can spot a confirmed bullish breakout of a key daily resistance.
That looks like a perfect buying opportunity.
However, a weekly time frame analysis changes the entire picture, just a little bit above the daily resistance, there is a solid weekly resistance.
From such a perspective, buying GBPUSD looks very risky.
2️⃣ The market trend on higher and lower time frames can be absolutely different.
In the example above, Gold is trading in a bullish trend on a 4h time frame.
It may appear for a newbie trader that buyers are dominating on the market. While a daily time frame analysis shows a completely different picture: the trend on a daily is bearish, and a bullish movement on a 4H is simply a local correctional move.
3️⃣ It may appear that the market has a big growth potential on one time frame while being heavily over-extended on other time frames.
Take a look at GBPJPY: on a weekly time frame, the market is trading in a strong bullish trend.
Checking a daily time frame, however, we can see that the bullish momentum is weakening: the double top pattern is formed and the market is consolidating.
The sentiment is even changing to a bearish once we analyze a 4H time frame. We can spot a rising wedge pattern there and its support breakout - very bearish signal.
4️⃣ Higher time frame analysis may help you to set a safe stop loss.
In the picture above, you can see that stop loss placement above a key daily resistance could help you to avoid stop hunting shorting the Dollar Index.
Analyzing the market solely on 1H time frame, stop loss would have been placed lower and the position would have closed in a loss.
Always check multiple time frame when you analyze the market.
It is highly recommendable to apply the combination of at least 2 time frames to make your trading safer and more accurate.
❤️Please, support my work with like, thank you!❤️
I am part of Trade Nation's Influencer program and receive a monthly fee for using their TradingView charts in my analysis.

Trading Is Not Gambling : Become A Better Trade Part IOver the last few weeks/months, I've tried to help hundreds of traders learn the difference between trading and gambling.
Trading is where you take measured (risk-restricted) attempts to profit from market moves.
Gambling is where you let your emotions and GREED overtake your risk management decisions - going to BIG WINS on every trade.
I think of gambling in the stock market as a person who continually looks for the big 50% to 150%++ gains on options every day. Someone who will pass up the 20%, 30%, and 40% profits and "let it ride to HERO or ZERO" on most trades.
That's not trading. That's flat-out GAMBLING.
I'm going to start a new series of training videos to try to help you understand how trading operates and how you need to learn to protect capital while taking strategic opportunities for profits and growth.
This is not going to be some dumbed-down example of how to trade. I'm going to try to explain the DOs and DO N'Ts of trading vs. gambling.
If you want to be a gambler - then get used to being broke most of the time.
I'll work on this video's subsequent parts later today and this week.
I hope this helps. At least it is a starting point for what I want to teach all of you.
Get some.
#trading #research #investing #tradingalgos #tradingsignals #cycles #fibonacci #elliotwave #modelingsystems #stocks #bitcoin #btcusd #cryptos #spy #gold #nq #investing #trading #spytrading #spymarket #tradingmarket #stockmarket #silver

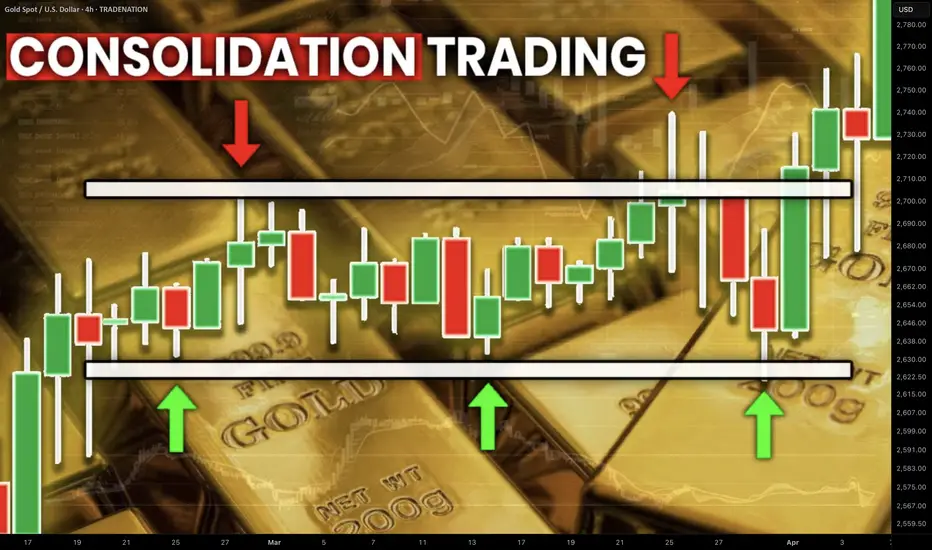
Best GOLD XAUUSD Consolidation Trading Strategy Explained
In article , you will learn how to identify and trade consolidation on Gold easily.
I will share with you my consolidation trading strategy and a lot of useful XAUUSD trading tips.
1. How to Identify Consolidation
In order to trade consolidation, you should learn to recognize that.
The best and reliable way to spot consolidation is to analyse a price action.
Consolidation is the state of the market when it STOPS updating higher highs & higher lows in a bullish trend OR lower lows & lower highs in a bearish trend.
In other words, it is the situation when the market IS NOT trending.
Most of the time, during such a period, the price forms a horizontal channel.
Above is a perfect example of a consolidation on Gold chart on a daily.
We see a horizontal parallel channel with multiple equal or almost equal highs and lows inside.
For a correct trading of a consolidation, you should correctly underline its boundaries.
Following the chart above, the upper boundary - the resistance, is based on the highest high and the highest candle close.
The lowest candle close and the lowest low compose the lower boundary - the support.
2. What Consolidation Means
Spotting the consolidating market, it is important to understand its meaning and the processes that happen inside.
Consolidation signifies that the market found a fair value.
Growth and bullish impulses occur because of the excess of demand on the market, while bearish moves happen because of the excess of supply.
When supply and demand find a balance, sideways movements start .
Look at the price movements on Gold above.
First, the market was rising because of a strong buying pressure.
Finally, the excess of buying interest was curbed by the sellers.
The market started to trade with a sideways range and found the equilibrium
At some moment, demand started to exceed the supply again and the consolidation was violated . The price updated the high and continued growth.
Usually, the violation of the consolidation happens because of some fundamental event that makes the market participants reassess the value of the asset.
At the same time, the institutional traders, the smart money accumulate their trading positions within the consolidation ranges. As the accumulation completes, they push the prices higher/lower, violating the consolidation.
3. How to Trade Consolidation
Once you identified a consolidation on Gold, there are 2 strategies to trade it.
The resistance of the consolidation provides a perfect zone to sell the market from. You simply put your stop loss above the resistance and your take profit should be the upper boundary of the support.
That is the example of a long trade from support of the consolidation on Gold.
The support of the sideways movement will be a safe zone to buy Gold from. Stop loss will lie below the support zone, take profit will be the lower boundary of the resistance.
AS the price reached a take profit level and tested a resistance, that is a short trade from that.
You can follow such a strategy till the price violates the consolidation and establishes a trend.
The market may stay a very extended period of time in sideways, providing a lot of profitable trading opportunities.
What I like about Gold consolidation trading is that the strategy is very straightforward and completely appropriate for beginners.
It works on any time frame and can be used for intraday, swing trading and scalping
❤️Please, support my work with like, thank you!❤️
I am part of Trade Nation's Influencer program and receive a monthly fee for using their TradingView charts in my analysis.
Behind the Curtain: Unveiling Gold’s Economic Catalysts1. Introduction
Gold Futures (GC, MGC and 1OZ), traded on the CME market, are one of the most widely used financial instruments for hedging against inflation, currency fluctuations, and macroeconomic uncertainty. As a safe-haven asset, gold reacts to a wide range of economic indicators, making it crucial for traders to understand the underlying forces driving price movements.
By leveraging machine learning, specifically a Random Forest Regressor, we analyze the top economic indicators influencing Gold Futures on daily, weekly, and monthly timeframes. This data-driven approach reveals the key catalysts shaping GC Futures and provides traders with actionable insights to refine their strategies.
2. Understanding Gold Futures Contracts
Gold Futures (GC) are among the most actively traded futures contracts, offering traders and investors exposure to gold price movements with a range of contract sizes to suit different trading strategies. CME Group provides three types of Gold Futures contracts to accommodate traders of all levels:
o Standard Gold Futures (GC):
Contract Size: Represents 100 troy ounces of gold.
Tick Size: Each tick is 0.10 per ounce, equating to $10 per tick per contract.
Purpose: Ideal for institutional traders and large-scale hedgers.
Margin: Approximately $12,500 per contract.
o Micro Gold Futures (MGC):
Contract Size: Represents 10 troy ounces of gold, 1/10th the size of the standard GC contract.
Tick Size: Each tick is $1 per contract.
Purpose: Allows smaller-scale traders to participate in gold markets with lower capital requirements.
Margin: Approximately $1,250 per contract.
o 1-Ounce Gold Futures (1OZ):
Contract Size: Represents 1 troy ounce of gold.
Tick Size: Each tick is 0.25 per ounce, equating to $0.25 per tick per contract.
Purpose: Provides precision trading for retail participants who want exposure to gold at a smaller contract size.
Margin: Approximately $125 per contract.
Keep in mind that margin requirements vary through time as market volatility changes.
3. Daily Timeframe: Key Economic Indicators
Gold Futures respond quickly to short-term economic fluctuations, and three key indicators play a crucial role in daily price movements:
o Velocity of Money (M2):
Measures how quickly money circulates within the economy.
A higher velocity suggests increased spending and inflationary pressure, often boosting gold prices.
A lower velocity indicates stagnation, which may reduce inflation concerns and weigh on gold.
o Unemployment Rate:
Reflects the strength of the labor market.
Rising unemployment increases economic uncertainty, often driving demand for gold as a safe-haven asset.
Declining unemployment can strengthen risk assets, potentially reducing gold’s appeal.
o Oil Import Price Index:
Represents the cost of imported crude oil, influencing inflation trends.
Higher oil prices contribute to inflationary pressures, supporting gold as a hedge.
Lower oil prices may ease inflation concerns, weakening gold demand.
4. Weekly Timeframe: Key Economic Indicators
While daily fluctuations impact short-term traders, weekly economic data provides a broader perspective on gold price movements. The top weekly indicators include:
o Nonfarm Payrolls (NFP):
Measures the number of new jobs added in the U.S. economy each month.
Strong NFP numbers typically strengthen the U.S. dollar and increase interest rate hike expectations, pressuring gold prices.
Weak NFP figures can drive economic uncertainty, increasing gold’s safe-haven appeal.
o Nonfarm Productivity:
Represents labor efficiency and economic output per hour worked.
Rising productivity suggests economic growth, potentially reducing demand for gold.
Falling productivity can signal economic weakness, increasing gold’s appeal.
o Personal Spending:
Tracks consumer spending habits, influencing economic activity and inflation expectations.
Higher spending can lead to inflation, often pushing gold prices higher.
Lower spending suggests economic slowing, which may either weaken or support gold depending on inflationary outlooks.
5. Monthly Timeframe: Key Economic Indicators
Long-term trends in Gold Futures are shaped by macroeconomic forces that impact investor sentiment, inflation expectations, and interest rates. The most influential monthly indicators include:
o China GDP Growth Rate:
China is one of the largest consumers of gold, both for investment and jewelry.
Strong GDP growth signals robust demand for gold, pushing prices higher.
Slower growth may weaken gold demand, applying downward pressure on prices.
o Corporate Bond Spread (BAA - 10Y):
Measures the risk premium between corporate bonds and U.S. Treasury bonds.
A widening spread signals economic uncertainty, increasing demand for gold as a safe-haven asset.
A narrowing spread suggests confidence in risk assets, potentially reducing gold’s appeal.
o 10-Year Treasury Yield:
Gold has an inverse relationship with bond yields since it does not generate interest.
Rising yields increase the opportunity cost of holding gold, often leading to price declines.
Falling yields make gold more attractive, leading to price appreciation.
6. Risk Management Strategies
Given gold’s volatility and sensitivity to macroeconomic changes, risk management is essential for trading GC Futures. Key risk strategies may include:
Monitoring Global Liquidity Conditions:
Keep an eye on M2 Money Supply and inflation trends to anticipate major shifts in gold pricing.
Interest Rate Sensitivity:
Since gold competes with yield-bearing assets, traders should closely track interest rate movements.
Higher 10-Year Treasury Yields can weaken gold’s value as a non-yielding asset.
Diversification and Hedging:
Traders can hedge gold positions using interest rate-sensitive assets such as bonds or inflation-linked securities.
Gold often performs well in times of equity market distress, making it a commonly used portfolio diversifier.
7. Conclusion
Gold Futures remain one of the most influential instruments in the global financial markets.
By leveraging machine learning insights and macroeconomic data, traders can better position themselves for profitable trading opportunities. Whether trading daily, weekly, or monthly trends, understanding these indicators allows market participants to align their strategies with broader economic conditions.
Stay tuned for the next "Behind the Curtain" installment, where we explore economic forces shaping another key futures market.
When charting futures, the data provided could be delayed. Traders working with the ticker symbols discussed in this idea may prefer to use CME Group real-time data plan on TradingView: www.tradingview.com - This consideration is particularly important for shorter-term traders, whereas it may be less critical for those focused on longer-term trading strategies.
General Disclaimer:
The trade ideas presented herein are solely for illustrative purposes forming a part of a case study intended to demonstrate key principles in risk management within the context of the specific market scenarios discussed. These ideas are not to be interpreted as investment recommendations or financial advice. They do not endorse or promote any specific trading strategies, financial products, or services. The information provided is based on data believed to be reliable; however, its accuracy or completeness cannot be guaranteed. Trading in financial markets involves risks, including the potential loss of principal. Each individual should conduct their own research and consult with professional financial advisors before making any investment decisions. The author or publisher of this content bears no responsibility for any actions taken based on the information provided or for any resultant financial or other losses.

The Two-Faced Market: The Truth Behind Trend Reversals!🎭 The Two-Faced Market: The Truth Behind Trend Reversals! 📊🚀
📢 Ever entered a trade thinking you caught the perfect trend , only to get stopped out as the market reversed?
You're not alone. The market has a way of fooling traders—but if you understand its “two-faced” nature, you can stay one step ahead.
🔥 Why Trends Reverse (and How to Catch It Early!)
Most traders believe trends reverse due to "news" or "randomness." But in reality, the market gives signals long before the turn happens. Here’s what to watch for:
🔹 Momentum Divergence: The price makes a new high, but indicators like RSI/MACD don’t.
🔹 Volume Anomaly: The trend continues, but volume dries up—a sign of weakness.
🔹 Failed Breakouts: Price breaks a key level, only to fall back inside—trapping traders.
🔹 Candlestick Clues: Reversal patterns like engulfing candles or wicks rejecting key levels appear.
🚀 Mastering these signals can put you ahead of 90% of traders.
📊 Real Example: XAU/ USD Trend Reversal in Action
🔎 Breakdown of the setup:
✅ Step 1: Identify a trend (through market structure, trendline or moving average).
✅ Step 2: Look for failed breakouts against the trend
✅ Step 3: Look for trend-following setups
🎯 The Market’s Game: Recognizing The Shift
Trends don’t die suddenly—they fade before reversing. The best traders spot the early signs and position before the crowd.
💡 Have you spotted these reversal signs before? Drop a comment with your experience! 👇🔥
📚 Always follow your trading plan regarding entry, risk management, and trade management.
Good luck!
All Strategies Are Good; If Managed Properly!
~Rich
Disclosure: I am part of Trade Nation's Influencer program and receive a monthly fee for using their TradingView charts in my analysis.

How to Find Best Supply and Demand Zones/Areas in Forex & Gold
In this article, I will show you the strongest supply and demand zones.
These zones are called confluence zones.
I will teach you to identify these areas properly and explain how to apply it in Forex and Gold trading.
Let's start with a short but important theory.
In technical analysis, there are 2 types of supports and resistances.
Horizontal structures are supports and resistance that are based on horizontal key levels.
Vertical structures are supports and resistance that are based on trend lines.
A confluence supply or demand zone, will be the area of the intersection between a horizontal and vertical structures.
Look at GBPJPY pair. I underlined a significant horizontal support and a rising trend line - a vertical support.
We see a clear crossing of both structures.
The trend line and a horizontal support will compose a narrow, contracting area. It will be a confluence demand zone.
Within, with a high probability, a high volume of buying orders will concentrate, and a strong bullish movement will initiate after its test.
Above is one more example of a powerful demand zone.
It was spotted on a Gold chart.
Now let's discuss the supply zone.
There are 2 strong structures on GBPNZD: a vertical resistance - a falling trend line and a horizontal resistance.
These 2 resistances will constitute a confluence supply zone.
That is a powerful resistance cluster that will concentrate the selling orders. Chances will be high to see a strong bearish movement from that.
There is a strong supply zone on CHFJPY that is based on the intersection of a wide horizontal resistance and a falling trend line.
Supply and demand zones that we discussed are very significant. Very often, strong bullish and bearish waves will initiate from these clusters.
Your ability to recognize these zones will help you to make accurate predictions and identify a safe point to open a trading position from
❤️Please, support my work with like, thank you!❤️

Bullish & Bearish Reversal Divergence Trading in Forex🔍 Bullish & Bearish Reversal Divergence Trading in Forex: A Detailed Overview
Divergence is a powerful concept in technical analysis — it helps spot potential trend reversals and momentum shifts. Let’s dive into the details with clear strategies and some visual flair! 🚀
🧠 What is Divergence?
Divergence happens when price action and a technical indicator (like RSI, MACD, or Stochastic) move in opposite directions. This hints that the current trend is losing strength and a possible reversal is coming.
📈 Types of Divergence
🐂 Bullish Reversal Divergence (Buy Signal)
Price: Makes lower lows ⬇️
Indicator: Makes higher lows ⬆️
Meaning: Sellers are losing momentum; buyers might take over soon.
Signal: Potential uptrend reversal ahead.
🔑 Key Confirmation Tools:
Support zone bounce 🛑
Bullish candlestick patterns (Hammer, Engulfing) 🕯️
Increased buying volume 📊
💡 Example Setup:
RSI makes a higher low while price drops lower — prepare for a long (buy) position.
🐻 Bearish Reversal Divergence (Sell Signal)
Price: Makes higher highs ⬆️
Indicator: Makes lower highs ⬇️
Meaning: Buyers are losing strength; sellers could take control.
Signal: Potential downtrend reversal ahead.
🔑 Key Confirmation Tools:
Resistance zone rejection 🚧
Bearish candlestick patterns (Shooting Star, Engulfing) 🌑
Increased selling volume 📉
💡 Example Setup:
MACD makes a lower high while price pushes higher — prepare for a short (sell) position.
🛠️ Best Indicators for Divergence Trading
RSI (Relative Strength Index) – Tracks overbought/oversold conditions. 📊
MACD (Moving Average Convergence Divergence) – Measures momentum shifts. 💥
Stochastic Oscillator – Identifies trend strength and reversals. 🎢
🎯 Divergence Trading Strategies
1️⃣ Classic Divergence Strategy
Spot bullish or bearish divergence. 🔍
Confirm with support/resistance levels. 🧱
Wait for a reversal candlestick pattern (like a Doji, Engulfing, or Pin Bar). 🕯️
Enter trade with a tight stop loss below support (for buys) or above resistance (for sells). 🎯
2️⃣ Divergence + Trendline Break Strategy
Draw a trendline following the current trend. 📐
Spot divergence as the trend loses strength. 🚨
Wait for a trendline breakout for extra confirmation. 💥
Enter trade on the break and retest of the trendline. 💯
3️⃣ Divergence + Moving Average Strategy
Spot divergence between price and indicator. 📉
Use a moving average (MA) like the 50 EMA or 200 EMA to confirm the trend shift. 📈
Buy when price crosses above the MA after bullish divergence. 💚
Sell when price crosses below the MA after bearish divergence. ❤️
⚠️ Common Mistakes to Avoid
🚫 Ignoring confirmation: Always wait for candle closes or breakouts.
🚫 Forcing divergence: Only trade when divergence is clear.
🚫 Skipping risk management: Use a stop loss and position sizing.
🚫 Overtrading small timeframes: Higher timeframes (4H, Daily) offer more reliable signals.

Best Strategies to Identify a Bearish Reversal in Gold Trading
In this article, I will explain to you 4 efficient strategies to identify a bearish reversal with technical analysis in Gold trading.
You will learn price action, SMC and technical indicator strong bearish signals.
First, let me remind you that different bearish signals may indicate a different magnitude and a degree of a potential reversal.
While some signals will be reliable for predicting short term reversals, some will be more accurate in projecting long-term ones.
One more thing to note is that one of the best time frames for bearish reversal confirmations on Gold is the daily. So, all the cases that will be explained will be on a daily time frame strictly.
XAUUSD Bearish Reversal Signal 1 - Bearish Price Action Pattern.
One of the perfect indicators of the overbought state of a bullish trend on Gold is bearish price action patterns.
I am talking about classic horizontal neckline based patterns like head & shoulders, inverted cup & handle, double/triple top and descending triangle.
Typically, these patterns leave early bearish clues and help to predict a coming downturn movement.
A strong bearish signal is a breakout of a horizontal neckline of the pattern and a candle close below.
The price may continue falling at least to the next key support then.
Above is the example of a head and shoulders pattern on Gold, on a daily. Its formation was the evidence of the overheated market. Bearish breakout of its neckline confirmed that, and the price continued falling.
Bearish Reversal Signal 2 - Rising Channel Breakout.
When the market is trading in a healthy bullish trend, it usually starts moving with the boundaries of a rising channel.
It can be the expanding, parallel or contracting channel.
Its support will represent a strong vertical structure , from where new bullish waves will initiate after corrections .
Its breakout will quite accurately indicate a change of a market sentiment and a highly probable bearish reversal.
Look at this rising parallel channel on Gold chart on a daily. The market was respecting its boundaries for more than 3 months.
A bearish violation of its support was an accurate bearish signal that triggered a strong bearish movement.
Bearish Reversal Signal 3 - Change of Character & Bearish Price Action.
One of the main characteristics of a bullish trend is the tendency of the market to set new higher highs and higher lows. Each final high of each bullish impulse is always higher than the previous. Each final low of each bearish movement is also higher than the previous.
In such a price action, the level of the l ast higher low is a very significant point.
The violation of that and a formation of a new low is an important event that is called Change of Character CHoCH.
It signifies the violation of a current bullish trend.
After that, one should pay attention to a consequent price action, because CHoCH can easily turn into just an extended correctional movement.
If the market sets a lower high and a new lower low then, it will confirm the start of a new bearish trend.
That is the example of a confirmed Change of Character on Gold on a daily. To validate the start of a new bearish trend, we should let the price set a lower high and a form a bearish impulse with a new lower low.
Bearish Reversal Signal 4 - Death Cross.
Death cross is a strong long-term bearish reversal signal that is based on a crossover of 2 moving averages.
On a daily time frame, it is usually based on a combination of 2 Simple Moving Averages: one with 50 length and one with 200 length.
The signal is considered to be confirmed when a 50 length SMA crosses below 200 length SMA.
It is commonly believed that it signifies that the market enters a long-term bearish trend.
On the chart, I plotted 2 Moving Averages. When the blue one crosses below the orange one, a global bearish trend on Gold will be confirmed
The 4 bearish signals that we discussed will be useful for predicting short term, mid term and long term bearish reversals on Gold.
While price action patterns will indicate local bearish movements, Death Cross will confirm a global trend change.
Learn to recognize all the signals that we discussed to make more accurate trading and investing decisions.
❤️Please, support my work with like, thank you!❤️

Sharing a possible great way to follow trend!!I just had to say big thanks to @KivancOzbilgic as most if not all of these combined indicators are created and shared by his wizard.
I combined various indicators into one which for me helps me greatly to find a trend and stay on trend.
