Internal and external liquidity Here's another mechanical lesson for you.
In my last post I covered a mechanical technique to identify swing ranges. Rule-based, simple and repeatable.
In this post, I want to share another little technique, again part of the mechanical series. But this time I want to talk about liquidity.
Most traders talk about liquidity, they might even have a grasp of what it is. But most do not know how liquidity forms the sentiment and how that creates a type of algo for the market.
You might have heard of Elliott wave theory. There is a saying along the lines of "you ask 10 Elliott traders for their count and you get 11 answers".
But the point is here, when you simplify the concept, it's clear to see that sentiment caused by liquidity swings is what causes a repeatable pattern in the market.
Let's take the idea of the ranges from my last post.
Now after a fair amount of accumulation, this level becomes "defended" - the price will gradually move up until old short stop losses are tagged and new long entries are entered into.
This allows the institutional players to open up their orders without setting off the alarm bells.
Price then comes back from external liquidity to find internal liquidity (more on this in a later post).
But then it looks for the next fresh highs.
As the highs are put in, we can use the range technique to move our range to the new area as seen in the image above.
Next we will be looking for an internal move, not just internal to the range, but a fractal move on the smaller timeframe that drives the pullback down. See this in blue.
The logic here is simple; on the smaller timeframes we have witnessed an accumulation at the 2 region and as we spike up for 3; we will witness a distribution on the smaller timeframes.
Wyckoff called this the accumulation, followed by a mark-up and then the distribution and a mark-down.
It is this pattern, over and over again that leads to this type of structure.
This will then be re-branded by various analysts who will call it things like a head and shoulders, smart money will see a change of character and a retest before breaking the structure.
This is all the same thing - just a different naming convention.
Again, I hope this helps some of you out there!
Disclaimer
This idea does not constitute as financial advice. It is for educational purposes only, our principal trader has over 25 years' experience in stocks, ETF's, and Forex. Hence each trade setup might have different hold times, entry or exit conditions, and will vary from the post/idea shared here. You can use the information from this post to make your own trading plan for the instrument discussed. Trading carries a risk; a high percentage of retail traders lose money. Please keep this in mind when entering any trade. Stay safe.
Commodities

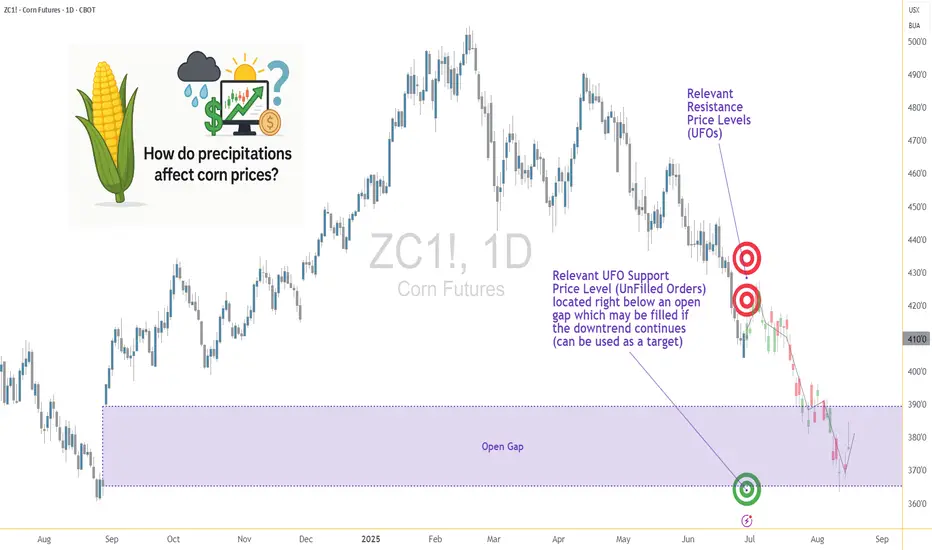
Weather and Corn: Understanding the Precipitation Factor1. Introduction: Rain, Grain, and Market Chain Reactions
In the world of agricultural commodities, few forces carry as much weight as weather — and when it comes to corn, precipitation is paramount. Unlike temperature, which can have nuanced and sometimes ambiguous effects depending on the growth stage, rainfall exerts a more direct and consistent influence on crop performance. For traders, understanding the role of rainfall in shaping market sentiment and price behavior isn't just an agricultural curiosity — it's a trading edge.
This article unpacks the relationship between weekly rainfall levels and corn futures prices. By leveraging normalized weather data and historical returns from Corn Futures (ZC), we aim to translate weather signals into actionable market insights. Whether you're managing large agricultural positions or exploring micro futures like MZC, precipitation patterns can provide vital context for your trades.
2. Corn’s Moisture Dependency
Corn is not just sensitive to water — it thrives or suffers because of it. From the moment seeds are planted, the crop enters a delicate dance with precipitation. Too little moisture during the early stages can impair root development. Too much during germination may lead to rot. And during pollination — particularly the tasseling and silking stages — insufficient rainfall can cause the plant to abort kernels, drastically reducing yield.
On the other hand, excessive rainfall isn't necessarily beneficial either. Prolonged wet periods can saturate soil, hinder nutrient uptake, and encourage fungal diseases. Farmers in the U.S. Corn Belt — particularly in states like Iowa, Illinois, and Nebraska — know this well. A single unexpected weather shift in these regions can send ripple effects across global markets, causing speculators to reassess their positions.
For traders, these weather events aren’t just environmental footnotes — they are catalysts that influence prices, volatility, and risk sentiment. And while annual production is important, it's the week-to-week rhythm of the growing season where short-term trades are born.
3. Our Data-Driven Approach: Weekly Rainfall and Corn Returns
To understand how rainfall impacts price, we collected and analyzed decades of historical weather and futures data, aligning weekly precipitation totals from major corn-growing regions with weekly returns from Corn Futures (ZC).
The weather data was normalized using percentiles for each location and week of the year. We then assigned each weekly observation to one of three precipitation categories:
Low rainfall (<25th percentile)
Normal rainfall (25th–75th percentile)
High rainfall (>75th percentile)
We then calculated the weekly percent change in corn futures prices and matched each return to the rainfall category for that week. The result was a dataset that let us measure not just general trends but statistically significant shifts in market behavior based on weather. One key finding stood out: the difference in returns between low-rainfall and high-rainfall weeks was highly significant, with a p-value of approximately 0.0006.
4. What the Numbers Tell Us
The results are striking. During low-rainfall weeks, corn futures often posted higher average returns, suggesting that the market responds to early signs of drought with anticipatory price rallies. Traders and institutions appear to adjust positions quickly when weather models hint at below-normal moisture during key growth stages.
In contrast, high-rainfall weeks displayed lower returns on average — and greater variability. While rain is essential, excess moisture raises fears of waterlogging, planting delays, and quality issues at harvest. The futures market, ever forward-looking, seems to price in both optimism and concern depending on the volume of rain.
Boxplots of these weekly returns reinforce the pattern: drier-than-usual weeks tend to tilt bullish, while wetter periods introduce uncertainty. For discretionary and algorithmic traders alike, this insight opens the door to strategies that incorporate weather forecasts into entry, exit, and risk models.
📊 Boxplot Chart: Weekly corn futures returns plotted against precipitation category (low, normal, high). This visual helps traders grasp how price behavior shifts under varying rainfall conditions.
5. Strategy: How Traders Can Position Themselves
With the clear statistical link between rainfall extremes and price behavior in corn futures, the logical next step is applying this insight to real-world trading. One straightforward approach is to incorporate weather forecast models into your weekly market prep. If a key growing region is expected to receive below-normal rainfall, that could serve as a signal for a potential bullish bias in the upcoming trading sessions.
This doesn’t mean blindly buying futures on dry weeks, but rather layering this data into a broader trading thesis. For example, traders could combine weather signals with volume surges, technical breakouts, or news sentiment to form confluence-based setups. On the risk management side, understanding how price behaves during extreme weather periods can inform smarter stop-loss placements, position sizing, or even the use of option strategies to protect against unexpected reversals.
Additionally, this information becomes particularly valuable during the planting and pollination seasons, when the corn crop is most vulnerable and the market reacts most strongly. Knowing the historical patterns of price behavior in those weeks — and aligning them with current forecast data — offers a clear edge that fundamental and technical analysis alone may not reveal.
🗺️ Global Corn Map Screenshot: A world map highlighting major corn-growing regions with weather overlay. This helps illustrate the geographic variability in rainfall and how it intersects with key production zones.
6. Corn Futures Contracts: Speculating with Flexibility
For traders looking to act on this kind of seasonal weather intelligence, CME Group provides two practical tools: the standard-size Corn Futures contract (ZC) and the Micro Corn Futures contract (MZC).
Here are some quick key points to remember:
Tick size for ZC is ¼ cent (0.0025) per bushel, equating to $12.50 per tick.
For MZC, each tick is 0.0050 equating to $2.50 per tick.
Standard ZC initial margin is approximately $1,000 and MZC margins are around $100 per contract, though this can vary by broker.
Micro contracts are ideal for those who want exposure to corn prices without the capital intensity of full-size contracts. They’re especially helpful for weather-based trades, where your thesis may rely on shorter holding periods, rapid scaling, or position hedging.
7. Conclusion: Rain’s Role in the Corn Trade
Precipitation isn’t just a farmer’s concern — it’s a trader’s opportunity. Our analysis shows that weather data, especially rainfall, has a statistically significant relationship with corn futures prices. By normalizing historical precipitation data and matching it to weekly returns, we uncovered a clear pattern: drought stress tends to lift prices, while excessive moisture creates volatility and downside risk.
For futures traders, understanding this dynamic adds another layer to market analysis.
As part of a broader series, this article is just one piece of a puzzle that spans multiple commodities and weather variables. Stay tuned for our upcoming releases, where we’ll continue exploring how nature’s forces shape the futures markets.
When charting futures, the data provided could be delayed. Traders working with the ticker symbols discussed in this idea may prefer to use CME Group real-time data plan on TradingView: www.tradingview.com - This consideration is particularly important for shorter-term traders, whereas it may be less critical for those focused on longer-term trading strategies.
General Disclaimer:
The trade ideas presented herein are solely for illustrative purposes forming a part of a case study intended to demonstrate key principles in risk management within the context of the specific market scenarios discussed. These ideas are not to be interpreted as investment recommendations or financial advice. They do not endorse or promote any specific trading strategies, financial products, or services. The information provided is based on data believed to be reliable; however, its accuracy or completeness cannot be guaranteed. Trading in financial markets involves risks, including the potential loss of principal. Each individual should conduct their own research and consult with professional financial advisors before making any investment decisions. The author or publisher of this content bears no responsibility for any actions taken based on the information provided or for any resultant financial or other losses.
Embracing Uncertainty
In trading, the illusion of certainty is often our biggest enemy.
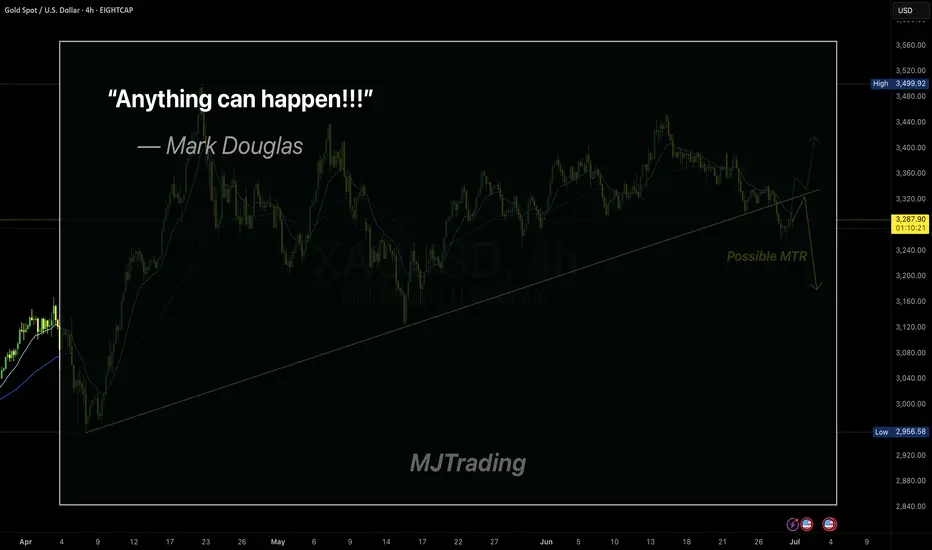
Even the cleanest setups—like a MTR (Major Trend Reversal)—can fail.
Mark Douglas said it best:
“Anything can happen.”
This simple truth is what keeps professional traders humble and disciplined.
Respect the market, manage your risk, and never assume you know what comes next.
Stay sharp.
#MJTrading
#GoldTrading #XAUUSD #TradingPsychology #AnythingCanHappen #MarkDouglas #ForexMindset #TradingQuotes #PriceAction #RiskManagement #MindOverMarkets #ChartOfTheDay #MJTrading
SMC Trading Basics. Change of Character - CHoCH (GOLD FOREX)
In the today's post, we will discuss one of the most crucial concepts in SMC - Change of Character.
Change of Character relates to market trend analysis.
In order to understand its meaning properly, first, we will discuss how Smart Money traders execute trend analysis.
🔘Smart Money Traders apply price action for the identification of the direction of the market.
They believe that the trend is bullish ,
if the price forms at least 2 bullish impulse with 2 consequent higher highs and a higher low between them.
The market trend is considered to be bearish ,
if the market forms at least 2 bearish impulses with 2 consequent lower lows and a lower high between them.
Here is how the trend analysis looks in practice.
One perceives the price action as the set of impulse and retracement legs.
According to the rules described above, USDCAD is trading in a bullish trend because the pair set 2 higher lows and 2 higher highs.
🔘Of course, trends do not last forever.
A skill of the identification of the market reversal is a key to substantial profits in trading.
Change of Character will help you quite accurately identify a bullish and bearish trend violation.
📉In a bearish trend, the main focus is the level of the last lower high.
While the market is trading below or on that, the trend remains bearish .
However, its bullish violation is a very important bullish signal,
it is called a Change of Character, and it signifies a confirmed violation of a bearish trend.
In a bearish trend, CHoCH is a very powerful bullish pattern.
Take a look, how accurate CHoCH indicated the trend reversal on Gold.
After a massive selloff, a bullish breakout of the level of the last lower high confirmed the initiation of a strong bullish wave.
📈In a bullish trend, the main point of interest is the level of the last higher low. While the price is trading above that or on that, the trend remains bullish.
A bearish violation of the last higher low level signifies the violation of a current bullish trend. It is called a Change of Character, and it is a very accurate bearish pattern.
Take a look at the example on Dollar Index below.
In a bullish trend, bearish violation of the last higher low level
quite accurately predicted a coming bearish reversal.
Change of Character is one of the simplest , yet accurate SMC patterns that you should know.
First, learn to properly execute the price action analysis and identify HH, HL, LL, LH and then CHoCH will be your main tool for the identification of the trend reversal.
❤️Please, support my work with like, thank you!❤️
I am part of Trade Nation's Influencer program and receive a monthly fee for using their TradingView charts in my analysis.

Mechanical rangesMany traders will talk about things like "Smart Money Concepts" (SMC) and think they have found something new.
The truth is, everything in trading stems back to Liquidity.
There is no "Algo" nobody is out to get you specifically. The market is always right, where you position yourself is your own choice.
I have written several posts on mechanical trading, recorded a number of streams. The more mechanical you can make the process, the less the emotions have a chance to kick your ass.
Let me give you a very simple method of being able to identify the ranges. Ignore the timeframes as this will work on any of them, on most instruments. (I say most, as some behave differently due to how it attracts liquidity). Lets assume high end crypto such as Bitcoin (BTC) and of course Forex in the general sense, stocks, commodities etc.
This is simple - only 2 rules.
You start by zooming out and giving yourself a general feel for the trend.
Let's say this looks to be an uptrend - we now need to understand the rules.
An opposing candle can simply be defined by a different colour. If the trend is up (Green) and we see a red candle - then it's an opposing candle.
The inverse is true, if we are down and the trend is Red. Then a Green candle would be opposing.
This is only half of the story. The second rule is a pullback candle or even a sequence of candles. This simply means either the very same opposing candle that doesn't make a new high or low (depending on the trend up not making fresh highs or down not taking new lows).
In this image, you can see we have in one candle both an opposing and pullback in one candle. This means we can now mark the high of the range. Working backwards to identify the swing range low.
This easy method means I can draw a range exactly the same and mechanically every single time.
Giving me a mechanical range.
We could then get a lot more technical by looking for liquidity, 50% of the range or places such as supply or demand areas.
But these are all for other posts.
For now, getting a range on the higher timeframes means you can work down and down into a timeframe you are likely to want to trade on.
These ranges will give clues to draws and runs of liquidity.
This will also help identify changes in the character and fresh breaks of structure.
Here's another post I posted on the mechanical structures and techniques.
More in the next post.
Have a great week!
Disclaimer
This idea does not constitute as financial advice. It is for educational purposes only, our principal trader has over 25 years' experience in stocks, ETF's, and Forex. Hence each trade setup might have different hold times, entry or exit conditions, and will vary from the post/idea shared here. You can use the information from this post to make your own trading plan for the instrument discussed. Trading carries a risk; a high percentage of retail traders lose money. Please keep this in mind when entering any trade. Stay safe.

Luxury, War, and Clarity – This Is the Golden Reset.🟨 The Real Gold Era: Clarity While the World Burns 🟨
"While some bleed in the streets, others sip cocktails in the Bahamas. This is not a coincidence. This is the new world."
Right now, we live in a time like no other.
People are dying in wars they never chose.
Currencies collapse. Nations threaten each other.
And yet — capital flows, gold climbs, and the rich get richer.
🕰️ A war started long ago — and most never saw it:
2020–2022: They printed trillions. COVID shut down the world. Fiat was silently devalued.
2022–2023: Russia was cut off from SWIFT. BRICS started buying gold. The dollar was no longer untouchable.
2023–2024: Gold broke $2100… then $2400… now $3400+. Even high interest rates can't stop it.
2025: U.S. and Israel strike Iran. BRICS discuss a gold-backed currency. Trust in fiat? Gone.
The Gold Era is no longer just metaphor. It’s the new battlefield.
💣 "War is loud. Wealth is silent."
While bombs fall in the East,
✨ capital quietly moves to safe havens.
While families flee,
✨ smart money finds gold, data, and sovereign positioning.
While headlines scream chaos,
✨ traders make decisions in silence.
🌍 But here's the paradox:
We also live in a world of unmatched abundance:
You can build a brand from a phone.
You can trade gold from a beach.
You can learn SMC, AI, geopolitics — and use it to build freedom.
You can escape the system, if you understand the structure.
In this gold era, the true asset isn't just metal.
It's mental clarity. Information. Sovereignty.
The gold is you.
📉 This isn’t just about trading.
It’s about knowing where we are in the timeline of collapse and rebirth.
The markets don’t lie — they expose what’s really coming.
And those who read them… can rise while others fall.
🧠 Final note:
Not everyone survives a reset.
But those who think in structure, who lead with clarity — they don’t just survive.
They reposition.
They build.
They lead.
🟡 Welcome to the Real Gold Era.
Where charts speak louder than news.
Where truth is a position.
Where you don’t wait for safety — you create it.
—
✍️ GoldFxMinds – where structure meets truth.
📢 Disclosure: This analysis was created using TradingView charts through my Trade Nation broker integration. As part of Trade Nation’s partner program, I may receive compensation for educational content shared using their tools.

AI Algo Systems vs. Manual Trading: Which Delivers Real Results?AI Algo Systems vs. Manual Trading: Which Delivers Real Results? ⚖️
________________________________________
Introduction
With the explosive rise of artificial intelligence (AI) in financial markets, traders everywhere are asking the million-dollar question:
Should I trust my trades to automation, or keep my hands on the wheel? 🧠🤖
This guide offers a real-world, side-by-side comparison between AI-powered algorithmic trading systems and traditional manual trading. We’ll highlight where each method dominates, when they fail, and how you can combine both to build a system that outperforms the rest. 💡
What Are AI Algo Systems? 🤖
AI trading systems use advanced machine learning models to:
• Analyze huge volumes of historical and real-time data 📈
• Detect patterns and trading opportunities faster than any human
• Automatically execute trades using coded logic, without emotion
🔬 Real-World Examples:
• Neural networks (LSTM, CNN): Predicting EUR/USD direction based on years of tick data
• Reinforcement learning agents: Managing position sizing dynamically in crypto scalping
• Predictive classifiers: Spotting likely trend reversals on S&P 500 based on 20+ indicators
Key Benefits:
• 🔄 Emotionless execution: No fear, no greed, just rules
• ⏱️ Lightning-fast trades: React to price action instantly
• 📊 Pattern recognition: Finds subtle correlations people miss
________________________________________
What Is Manual Trading? 👤
Manual trading is powered by human intelligence and judgment. Traders use:
• Price action and SMC/ICT techniques (e.g., order blocks, BOS)
• Fundamental analysis: News, sentiment, macro reports
• Intuition and experience: Reading between the lines the way only humans can
🧑💼 Real-World Examples:
• A trader spots an untested order block on GBP/JPY and waits for liquidity sweep before entering
• Reading a dovish tone in FOMC minutes and fading the initial spike on DXY
• Using “market structure shifts” after a big news event to catch a reversal
Key Benefits:
• 🔍 Contextual awareness: Understand the full market story
• 🎯 Real-time adaptability: Adjust plans on the fly
• 🧠 Creative edge: Find setups no algorithm can code for
________________________________________
Side-by-Side Comparison Table 📋
Feature AI Algo Trading 🤖 Manual Trading 👤
Execution Speed Instant Slower, can lag
Emotions Involved None Prone to fear/greed
Adaptability Limited (needs retrain) High
Learning Curve High (coding/tech) Medium (market logic)
Strategy Flexibility Pre-coded only Unlimited creativity
Backtesting Automated Manual/semi-auto
Session Monitoring 24/5 via server Human-limited hours
________________________________________
When AI Algo Systems Work Best 💾
AI is unbeatable when you need:
• Scalability: Watching 10, 20, or even 100+ pairs 24/5
• High-frequency execution: Entering/exiting trades within milliseconds
• Repetitive strategies: Like mean reversion, breakout scalps, or arbitrage
📈 Example:
• Strategy: EUR/USD London open breakout
• Process: AI model detects volume and volatility spike, enters trade with 0.3% risk, targets FVG
• Results: 60% win rate, 1.8R average reward over 3 months
________________________________________
When Manual Trading Wins 🧠
Manual skills shine when you need:
• Discretionary entries: Especially with complex SMC/ICT structures
• Adapting to breaking news: Sudden CPI, FOMC shocks, geopolitical headlines
• Making sense of market narrative: When volatility is off the charts and AI gets confused
🗞️ Example:
• News: Surprise ECB rate hike
• Setup: Price sweeps liquidity and forms new order block
• Action: Trader enters based on confluence of structure, sentiment, and news
• Why AI fails: Model trained on normal volatility might get stopped out or miss entry entirely
________________________________________
Hybrid Strategy: The Best of Both Worlds 🌐
Elite traders combine the power of AI with human oversight.
Hybrid Workflow:
1. AI scans markets: Flags setups (order blocks, FVGs, volume spikes)
2. You review: Confirm bias with news, sentiment, or higher time frame
3. Entry:
o Manual (you pull the trigger)
o Semi-automated (AI suggests, you approve)
🔁 You save time, avoid missing setups, but keep critical discretion and control.
________________________________________
Risk Management: Algo vs. Manual 📊
AI:
• Stops, lot size, SL/TP are auto-calculated
• Consistent, never emotional
• Example: EA manages all USD pairs with 0.5% fixed risk per trade
Manual:
• Trader might override risk plan
• Discipline needed—easy to “revenge trade” after a loss
• Example: You up your risk size after a losing streak, breaking your rules
Best Practice:
📌 Let AI calculate risk size. Manually approve or override the entry. Double safety net.
________________________________________
Trader Case Study 👤
Name: Ray – $100K funded prop trader
Style: Hybrid (AI scanner + manual ICT confirmations)
Process:
• Sets HTF bias each morning
• AI scans for OB/BOS setups during NY session
• Manual review before entry
Performance:
• Win rate: 63%
• Avg R: 2.5
• Monthly gain: 9.7%
Ray’s Words:
“AI catches what I can’t see. I catch what it can’t understand.”
________________________________________
Mistakes to Avoid ❌
• 🚫 Blindly trusting black-box AI: Always verify signals
• 🚫 Micromanaging every tick: Let automation work, don’t over-interfere
• 🚫 Running AI during high-impact news: Most bots aren’t built for chaos
• 🚫 Ignoring psychology: Even if AI executes, your mindset impacts risk and management
________________________________________
Conclusion ✅
There’s no one-size-fits-all answer. The best traders in 2025 master both worlds. Here’s the winning formula:
• Harness AI’s speed and pattern recognition
• Lean on manual judgment for narrative and nuance
• Blend them with intention and structure for a trading system that’s fast, flexible, and resilient.
💥 Don’t pick sides. Master both.
That’s how the top 1% trade today—and win. 🚀⚙️📊

Soybeans and Heat: Subtle Signals in a Volatile Market1. Introduction
Soybeans aren't just a staple in livestock feed and global cuisine—they’re also a major commodity in futures markets, commanding serious attention from hedgers and speculators alike. With growing demand from China, unpredictable yields in South America, and increasing climatic instability, the behavior of soybean prices often reflects a deeper interplay of supply chain stress and environmental variability.
Among the many weather variables, temperature remains one of the most closely watched. It’s no secret that extreme heat can harm crops. But what’s less obvious is this: Does high temperature truly move the soybean market in measurable ways?
As we’ll explore, the answer is yes—but with a twist. Our deep dive into decades of data reveals a story of statistical significance, but not dramatic deviation. In other words, the signal is there, but you need to know where—and how—to look.
2. Soybeans and Climate Sensitivity
The soybean plant’s sensitivity to heat is well documented. During its flowering and pod-setting stages, typically mid-to-late summer in the U.S., soybean yields are highly vulnerable to weather fluctuations. Excessive heat during these windows—particularly above 30ºC (86ºF)—can impair pod development, lower seed count, and accelerate moisture loss from the soil.
The optimal range for soybean development tends to hover between 20ºC to 30ºC (68ºF to 86ºF). Within this window, the plant thrives—assuming adequate rainfall and no pest infestations. Go beyond it for long enough, and physiological stress builds up. This is precisely the kind of risk that traders price into futures markets, often preemptively based on forecasts.
Yet, trader psychology is just as important as crop biology. Weather alerts—especially heatwaves—often drive speculative trading. The market may anticipate stress well before actual yield reports come out. This behavior is where we see the beginnings of correlation between temperature and market movement.
3. Quantifying Weather Impact on Soybean Futures
To test how meaningful these heat-driven narratives are, we categorized weekly temperatures into three buckets:
Low: Below the 25th percentile of weekly temperature readings
Normal: Between the 25th and 75th percentile
High: Above the 75th percentile
We then calculated weekly returns of Soybean Futures (ZS) across these categories. The results?
Despite the modest visual differences in distribution, the statistical analysis revealed a clear pattern: Returns during high-temperature weeks were significantly different from those during low-temperature weeks, with a p-value of 3.7e-11.
This means the likelihood of such a difference occurring by chance is effectively zero. But here’s the catch—the difference in mean return was present, yes, but not huge. And visually, the boxplots showed overlapping quartiles. This disconnect between statistical and visual clarity is exactly what makes this insight subtle, yet valuable.
4. What the Data Really Tells Us
At first glance, the boxplots comparing soybean futures returns across temperature categories don’t scream “market-moving force.” The medians of weekly returns during Low, Normal, and High temperature periods are closely clustered. The interquartile ranges (IQRs) overlap significantly. Outliers are present in every category.
So why the statistical significance?
It’s a matter of consistency across time. The soybean market doesn’t suddenly explode every time it gets hot—but across hundreds of data points, there’s a slightly more favorable distribution of returns during hotter weeks. It’s not dramatic, but it’s reliable enough to warrant strategic awareness.
This is where experienced traders can sharpen their edge. If you’re already using technical analysis, seasonal patterns, or supply-demand forecasts, this weather-based nuance can serve as a quiet confirmation or subtle filter.
5. Why This Still Matters for Traders
In markets like soybeans, where prices can respond to multiple fundamental factors—currency shifts, export numbers, oilseed competition—small weather patterns might seem like background noise. But when viewed statistically, these small effects can become the grain of edge that separates average positioning from smart exposure.
For example:
Volatility tends to rise during high-heat weeks, even when average return shifts are small.
Institutional players may rebalance positions based on crop health assumptions before USDA reports arrive.
Weather trading algos can push prices slightly more aggressively during risk-prone periods.
In short, traders don’t need weather to predict price. But by knowing what weather has historically meant, they can adjust sizing, bias, or timing with greater precision.
6. Contract Specs: Standard vs. Micro Soybeans
Accessing the soybean futures market doesn’t have to require big institutional capital. With the launch of Micro Soybean Futures (MZS), traders can participate at a more granular scale.
Here are the current CME Group specs:
📌 Contract Specs for Soybean Futures (ZS):
Symbol: ZS
Contract size: 5,000 bushels
Tick size: 1/4 of one cent (0.0025) per bushel = $12.50
Initial margin: ~$2,100 (varies by broker and volatility)
📌 Micro Soybean Futures (MZS):
Symbol: MZS
Contract size: 500 bushels
Tick size: 0.0050 per bushel = $2.50
Initial margin: ~$210
The micro-sized contract allows traders to scale into positions, especially when exploring signals like weather impact. It also enables more nuanced strategies—such as partial hedges or volatility exposure—without the capital intensity of full-size contracts.
7. Conclusion: A Nuanced Edge for Weather-Aware Traders
When it comes to soybeans and temperature, the story isn’t one of obvious crashes or dramatic spikes. It’s a story of consistent, statistically measurable edges that can quietly inform better trading behavior.
Yes, the return differences may look small on a chart. But over time, in leveraged markets with seasonality and fundamental noise, even a few extra basis points in your favor—combined with smarter sizing and timing—can shift your performance curve meaningfully.
Using tools like Micro Soybean Futures, and being aware of technical frameworks, traders can efficiently adapt to subtle but reliable signals like temperature-based volatility.
And remember: this article is just one piece in a multi-part series exploring the intersection of weather and agricultural trading. The next piece might just provide the missing link to complete your edge. Stay tuned. 🌾📈
When charting futures, the data provided could be delayed. Traders working with the ticker symbols discussed in this idea may prefer to use CME Group real-time data plan on TradingView: www.tradingview.com - This consideration is particularly important for shorter-term traders, whereas it may be less critical for those focused on longer-term trading strategies.
General Disclaimer:
The trade ideas presented herein are solely for illustrative purposes forming a part of a case study intended to demonstrate key principles in risk management within the context of the specific market scenarios discussed. These ideas are not to be interpreted as investment recommendations or financial advice. They do not endorse or promote any specific trading strategies, financial products, or services. The information provided is based on data believed to be reliable; however, its accuracy or completeness cannot be guaranteed. Trading in financial markets involves risks, including the potential loss of principal. Each individual should conduct their own research and consult with professional financial advisors before making any investment decisions. The author or publisher of this content bears no responsibility for any actions taken based on the information provided or for any resultant financial or other losses.

Top 5 Most Effective Forex Trading StrategiesTop 5 Most Effective Forex Trading Strategies Used by Professional Traders
Forex trading requires not just knowledge, but discipline and a clear strategy. So what are the most effective forex trading strategies that professional traders consistently use to achieve sustainable profits?
Let’s explore the 5 most trusted strategies that have stood the test of time – helping you level up your skills and reduce risk in this trillion-dollar market.
1. Breakout Strategy – Catching the Wave When the Market Explodes
A breakout occurs when price moves beyond a key support or resistance level after a period of consolidation. This usually signals the start of a new trend.
Best for: Traders who love strong momentum.
Pro tip: Confirm breakout with volume or candlestick patterns (e.g., engulfing).
Caution: Avoid entering right after the breakout – wait for a retest.
2. Trend Following Strategy – Trade with the Market, Not Against It
“Trend is your friend” – one of the most famous sayings in trading. This strategy helps traders ride the main trend, buying in uptrends and selling in downtrends.
Recommended tools: MA 20, MA 50, RSI, MACD.
Insider tip: Combine with pullback entries (enter when price retraces to dynamic support/resistance).
3. Price Action Strategy – Reading the Market Without Indicators
Price Action focuses on interpreting pure price behavior, without relying on indicators. Many pro traders prefer this approach to understand market psychology in real time.
Advantages: Clean, flexible, sharpens decision-making.
Popular candlestick patterns: Pin Bar, Inside Bar, Fakey, Engulfing.
4. News Trading Strategy – For Quick Thinkers and Fast Hands
When major news events like CPI, NFP, FOMC, or rate decisions hit the market, volatility surges. This creates both high-profit opportunities and high risks.
Common tactic: Straddle – place Buy Stop & Sell Stop before news release.
Risk warning: Watch out for slippage and widened spreads.
5. Fibonacci & Confluence Strategy – High-Probability Entries
This strategy combines tools like Fibonacci retracement, trendlines, support/resistance zones, and moving averages to find high-probability entry points.
Strength: Optimizes Risk: Reward ratio.
Tip: Focus on Fib levels 0.382 – 0.618 (commonly used retracement zones).
Conclusion: The Best Strategy is the One That Matches Your Style
There’s no perfect strategy – but understanding and applying the one that best fits your trading style will help you avoid emotional decisions and build long-term consistency.
Remember: Risk management – Emotional control – Systematic discipline = Long-term trading survival.

Intraday Gold Trading System with Neural Networks: Step-by-Step________________________________________
🏆 Intraday Gold Trading System with Neural Networks: Step-by-Step Practical Guide
________________________________________
📌 Step 1: Overview and Goal
The goal is to build a neural network system to predict intraday short-term gold price movements—typically forecasting the next 15 to 30 minutes.
________________________________________
📈 Step 2: Choosing Indicators (TradingView Equivalents)
Key indicators for intraday gold trading:
• 📊 Moving Averages (EMA, SMA)
• 📏 Relative Strength Index (RSI)
• 🌀 Moving Average Convergence Divergence (MACD)
• 📉 Bollinger Bands
• 📦 Volume Weighted Average Price (VWAP)
• ⚡ Average True Range (ATR)
________________________________________
🗃 Step 3: Data Acquisition (Vectors and Matrices)
Use Python's yfinance to fetch intraday gold data:
import yfinance as yf
import pandas as pd
data = yf.download('GC=F', period='30d', interval='15m')
________________________________________
🔧 Step 4: Technical Indicator Calculation
Use Python’s pandas_ta library to generate all required indicators:
import pandas_ta as ta
data = ta.ema(data , length=20)
data = ta.ema(data , length=50)
data = ta.rsi(data , length=14)
macd = ta.macd(data )
data = macd
data = macd
bbands = ta.bbands(data , length=20)
data = bbands
data = bbands
data = bbands
data = ta.atr(data , data , data , length=14)
data.dropna(inplace=True)
________________________________________
🧹 Step 5: Data Preprocessing and Matrix Creation
Standardize your features and shape data for neural networks:
from sklearn.preprocessing import StandardScaler
import numpy as np
features =
scaler = StandardScaler()
data_scaled = scaler.fit_transform(data )
def create_matrix(data_scaled, window_size=10):
X, y = ,
for i in range(len(data_scaled) - window_size - 1):
X.append(data_scaled )
y.append(data .iloc )
return np.array(X), np.array(y)
X, y = create_matrix(data_scaled, window_size=10)
________________________________________
🤖 Step 6: Neural Network Construction with TensorFlow
Use LSTM neural networks for sequential, time-series prediction:
import tensorflow as tf
from tensorflow.keras.models import Sequential
from tensorflow.keras.layers import LSTM, Dense, Dropout
model = Sequential( , X.shape )),
Dropout(0.2),
LSTM(32, activation='relu'),
Dense(1)
])
model.compile(optimizer='adam', loss='mse')
________________________________________
🎯 Step 7: Training the Neural Network
history = model.fit(X, y, epochs=50, batch_size=32, validation_split=0.2)
________________________________________
📊 Step 8: Evaluating Model Performance
Visualize actual vs. predicted prices:
import matplotlib.pyplot as plt
predictions = model.predict(X)
plt.plot(y, label='Actual Price')
plt.plot(predictions, label='Predicted Price')
plt.xlabel('Time Steps')
plt.ylabel('Gold Price')
plt.legend()
plt.show()
________________________________________
🚦 Step 9: Developing a Trading Strategy
Translate predictions into trading signals:
def trade_logic(predicted, current, threshold=0.3):
diff = predicted - current
if diff > threshold:
return "Buy"
elif diff < -threshold:
return "Sell"
else:
return "Hold"
latest_data = X .reshape(1, X.shape , X.shape )
predicted_price = model.predict(latest_data)
current_price = data .iloc
decision = trade_logic(predicted_price, current_price)
print("Trading Decision:", decision)
________________________________________
⚙️ Step 10: Real-Time Deployment
Automate the model for live trading via broker APIs (pseudocode):
while market_open:
live_data = fetch_live_gold_data()
live_data_processed = preprocess(live_data)
prediction = model.predict(live_data_processed)
decision = trade_logic(prediction, live_data )
execute_order(decision)
________________________________________
📅 Step 11: Backtesting
Use frameworks like Backtrader or Zipline to validate your strategy:
import backtrader as bt
class NNStrategy(bt.Strategy):
def next(self):
if self.data.predicted > self.data.close + threshold:
self.buy()
elif self.data.predicted < self.data.close - threshold:
self.sell()
cerebro = bt.Cerebro()
cerebro.addstrategy(NNStrategy)
# Add data feeds and run cerebro
cerebro.run()
________________________________________
🔍 Practical Use-Cases
• ⚡ Momentum Trading: EMA crossovers, validated by neural network.
• 🔄 Mean Reversion: Trade at Bollinger Band extremes, validated with neural network predictions.
• 🌩️ Volatility-based: Use ATR plus neural net for optimal entry/exit timing.
________________________________________
🛠 Additional Recommendations
• Frameworks: TensorFlow/Keras, PyTorch, scikit-learn
• Real-time monitoring and risk management are crucial—use volatility indicators!
________________________________________
📚 Final Thoughts
This practical guide arms you to build, deploy, and manage a neural network-based intraday gold trading system—from data acquisition through backtesting—ensuring you have the tools for robust, data-driven, and risk-managed trading strategies.
________________________________________

Trading Gold with Leverage: Smart or Dangerous?XAUUSD trading (Gold vs. US Dollar) is a popular choice among global traders due to its high liquidity, strong volatility, and profit potential. One of the tools that help traders amplify their returns is financial leverage. However, using leverage also carries significant risks if not managed properly. So, what exactly is leverage in XAUUSD trading? Should you use it? Let’s explore the advantages and disadvantages below.
1. What is Leverage in XAUUSD Trading?
Leverage is a financial tool that allows traders to control a larger position in the market than the capital they actually own. For example, with 1:100 leverage, you only need $1,000 to trade a position worth $100,000.
In the XAUUSD market, brokers often offer leverage ranging from 1:50 to 1:500, or even up to 1:2000—depending on their risk policies and regulations.
2. Pros of Using Leverage in XAUUSD Trading
🔹 Amplifies Potential Profits
Leverage allows traders to maximize profits with a relatively small amount of capital. When the market moves in the expected direction, the gains can be multiplied significantly.
🔹 Lower Capital Requirement
Instead of needing $10,000 to trade 1 lot of gold, a trader may only need $100–$500 depending on the leverage. This lowers the entry barrier and offers greater flexibility in capital management.
🔹 Enables Strategy Diversification
With the same amount of capital, traders can open multiple positions across different timeframes or strategies. Leverage allows for broader portfolio diversification while still maintaining control over total risk.
🔹 Takes Advantage of Short-Term Opportunities
Gold markets often react strongly to news and economic data. Leverage lets traders capitalize on short-term price swings, enabling faster profits without needing to hold positions long-term.
3. Cons and Risks of Using Leverage in XAUUSD Trading
Risk of Account Blowout
The higher the leverage, the lower the safety margin. A small market move against the position can trigger a margin call or stop-out, resulting in a full loss of the initial capital.
Emotional and Psychological Stress
High leverage often leads traders to gamble instead of follow a strategy, increasing the likelihood of emotional decisions and impulsive trading behaviors.
Difficult to Manage During Volatility
XAUUSD is a highly volatile asset, especially during U.S. sessions or major news releases (like CPI, Fed announcements, NFP). Over-leveraging can lead to rapid losses in seconds during sudden price spikes.
Increased Emotional Pressure
When using high leverage, every small fluctuation feels significant, causing stress and encouraging poor decisions—like exiting too early or revenge trading.
4. Conclusion: Should You Use Leverage in XAUUSD Trading?
Yes, but only with a disciplined and strategic approach.
Use moderate leverage (e.g. 1:100 or lower if you're a beginner)
Always set clear stop-loss and take-profit levels
Risk no more than 2% of your account per trade
Avoid “all-in” trades and don’t let emotions dictate position size
In Summary
Leverage in XAUUSD trading is a double-edged sword. Used wisely, it accelerates your profit potential. Used recklessly, it can wipe out your account in moments. The key is to trade with discipline, knowledge, and a solid plan to harness the power of leverage without falling into its traps.

How to Use Fibonacci Extension for Effective ProfitHow to Use Fibonacci Extension for Effective Profit-Taking in Forex.
Fibonacci Extension is a powerful tool for identifying profit-taking levels in Forex, including XAU/USD trading. Here’s a concise, SEO-optimized guide to maximize your gains:
1. Understand Fibonacci Extension Levels
The 127.2%, 161.8%, and 261.8% extension levels predict price targets after a breakout, making them ideal for setting profit goals.
2. Identify Key Price Swings
Select swing low (e.g., 3.300 USD), swing high (e.g., 3.344.70 USD), and retracement low (e.g., 3.312.570 USD) on the chart.
3. Apply Fibonacci Extension
Draw from swing low to high, then extend from the retracement low. For example, 161.8% may project to approximately 3.360 USD.
4. Set Profit-Taking Targets
Conservative: Target 127.2% (e.g., 3.350 USD).
Aggressive: Aim for 161.8% (e.g., 3.360 USD), aligning with resistance levels.
5. Manage Risk
Place a stop-loss below the retracement low (e.g., 3.300 USD) and aim for a 1:2 risk-reward ratio.
6. Pro Tips
Combine with resistance, RSI, or volume; exit early if momentum fades. Update levels with new swings.
Leverage this strategy to optimize profits in volatile Forex markets like XAU/USD!

What is a Fibonacci Sequence and Its Application in Forex?What is a Fibonacci Sequence?
The Fibonacci sequence is a series of numbers where each number is the sum of the two preceding ones, typically starting with 0 and 1 (e.g., 0, 1, 1, 2, 3, 5, 8, 13, 21, ...). In trading, the Fibonacci retracement levels are derived from key ratios (23.6%, 38.2%, 50%, 61.8%, and 100%) based on this sequence. These levels are used to identify potential support and resistance zones where price reversals or continuations may occur.
Application in Forex
In Forex trading, Fibonacci retracement is a popular technical analysis tool applied to chart price movements to predict future price action:
- Identifying Support and Resistance**: Traders draw Fibonacci levels between a significant high and low on a chart. For example, after a price drop, the 61.8% retracement level often acts as support where the price might bounce back.
- Entry and Exit Points**: Forex traders use these levels to determine optimal entry points (e.g., buying near a 50% retracement) or exit points (e.g., taking profit near a 23.6% retracement after a rally).
- Stop-Loss and Take-Profit**: Fibonacci levels help set stop-loss orders below support (e.g., below 61.8%) or take-profit targets near resistance (e.g., 38.2% or 50%).
- Trend Confirmation**: In a downtrend, if the price retraces to the 38.2% level and resumes falling, it confirms the bearish trend. Conversely, a break above this level in an uptrend may signal bullish momentum.
Example in Practice
On the XAU/USD chart, if the price drops from 3.344.70 USD to 3.312.570 USD, Fibonacci levels can be plotted. The 38.2% retracement might fall around 3.330 USD, serving as a potential support zone for traders to watch.

Heatwaves and Wheat: How Temperature Shocks Hit Prices🌾 Section 1: The Wheat–Weather Connection—Or Is It?
If there’s one crop whose success is often tied to the weather forecast, it’s wheat. Or so we thought. For decades, traders and analysts have sounded the alarm at the mere mention of a heatwave in key wheat-producing regions. The logic? Excessive heat during the growing season can impair wheat yields by disrupting pollination, shortening the grain-filling period, or damaging kernel development. A tightening supply should lead to price increases. Simple enough, right?
But here’s where the story takes an unexpected turn.
What happens when we actually analyze the data? Does heat reliably lead to price spikes in the wheat futures market? The short answer: not exactly. In fact, our statistical tests show that temperature may not have the consistent, directional impact on wheat prices that many traders believe it does.
And that insight could change how you think about risk, seasonality, and the role of micro contracts in your wheat trading strategy.
📈 Section 2: The Economics of Wheat—And Its Role in the Futures Market
Wheat isn’t just a breakfast staple—it’s the most widely grown crop in the world. It’s cultivated across North America, Europe, Russia, Ukraine, China, and India, making it a truly global commodity. Because wheat is produced and consumed everywhere, its futures markets reflect a wide array of influences: weather, geopolitics, global demand, and speculative positioning.
The Chicago Board of Trade (CBOT), operated by CME Group, is the main venue for wheat futures trading. It offers two primary wheat contracts:
Standard Wheat Futures (ZW)
Contract Size: 5,000 bushels
Tick Size: 1/4 cent per bushel (0.0025) has a $12.50 per tick impact
Margin Requirement: Approx. $1,700 (subject to change)
Micro Wheat Futures (MZW)
Contract Size: 500 bushels (1/10th the size of the standard contract)
Tick Size: 0.0050 per bushel has a $2.50 per tick impact
Margin Requirement: Approx. $170 (subject to change)
These micro contracts have transformed access to grain futures markets. Retail traders and smaller funds can now gain precise exposure to weather-driven moves in wheat without the capital intensity of the full-size contract.
🌡️ Section 3: Weather Normalization—A Smarter Way to Measure Impact
When analyzing weather, using raw temperature values doesn’t paint the full picture. What’s hot in Canada might be normal in India. To fix this, we calculated temperature percentiles per location over 40+ years of historical weather data.
This gave us three weekly categories:
Below 25th Percentile (Low Temp Weeks)
25th to 75th Percentile (Normal Temp Weeks)
Above 75th Percentile (High Temp Weeks)
Using this approach, we grouped thousands of weeks of wheat futures data and examined how price returns behaved under each condition. This way, we could compare a “hot” week in Ukraine to a “hot” week in the U.S. Midwest—apples to apples.
🔄 Section 4: Data-Driven Temperature Categories and Wheat Returns
To move beyond anecdotes and headlines, we then calculated weekly percent returns for wheat futures (ZW) for each of the three percentile-based categories.
What we found was surprising.
Despite common assumptions that hotter weeks push wheat prices higher, the average returns didn’t significantly increase during high-temperature periods. However, something else did: volatility.
In high-temp weeks, prices swung more violently — up or down — creating wider return distributions. But the direction of these moves lacked consistency. Some heatwaves saw spikes, others fizzled.
This insight matters. It means that extreme heat amplifies risk, even if it doesn't create a reliable directional bias.
Traders should prepare for greater uncertainty during hot weeks — an environment where tools like micro wheat futures (MZW) are especially useful. These contracts let traders scale exposure and control risk in turbulent market conditions tied to unpredictable weather.
🔬 Section 5: Statistical Shock—The t-Test Revelation
To confirm our findings, we ran two-sample t-tests comparing the returns during low vs. high temperature weeks. The goal? To test if the means of the two groups were statistically different.
P-Value (Temp Impact on Wheat Returns): 0.354 (Not Significant)
Conclusion: We cannot reject the hypothesis that average returns during low and high temp weeks are the same.
This result is counterintuitive. It flies in the face of narratives we often hear during weather extremes.
However, our volatility analysis (using boxplots) showed that variance in returns increases significantly during hotter weeks, making them less predictable and more dangerous for leveraged traders.
🧠 Section 6: What Traders Can Learn from This
This analysis highlights a few key lessons:
Narratives aren’t always backed by data. High heat doesn’t always mean high prices.
Volatility increases during weather stress. That’s tradable, but not in the way many assume.
Risk-adjusted exposure matters. Micro wheat futures (MZW) are ideal for navigating weather-driven uncertainty.
Multi-factor analysis is essential. Weather alone doesn’t explain price behavior. Global supply chains, speculative flows, and other crops’ performance all play a role.
This article is part of a growing series where we explore the relationship between weather and agricultural futures. From corn to soybeans to wheat, each crop tells a different story. Watch for the next release—we’ll be digging deeper into more effects and strategies traders can use to capitalize on weather.
When charting futures, the data provided could be delayed. Traders working with the ticker symbols discussed in this idea may prefer to use CME Group real-time data plan on TradingView: www.tradingview.com - This consideration is particularly important for shorter-term traders, whereas it may be less critical for those focused on longer-term trading strategies.
General Disclaimer:
The trade ideas presented herein are solely for illustrative purposes forming a part of a case study intended to demonstrate key principles in risk management within the context of the specific market scenarios discussed. These ideas are not to be interpreted as investment recommendations or financial advice. They do not endorse or promote any specific trading strategies, financial products, or services. The information provided is based on data believed to be reliable; however, its accuracy or completeness cannot be guaranteed. Trading in financial markets involves risks, including the potential loss of principal. Each individual should conduct their own research and consult with professional financial advisors before making any investment decisions. The author or publisher of this content bears no responsibility for any actions taken based on the information provided or for any resultant financial or other losses.

Harmonic AB=CD Pattern Guide for TradingViewThe Harmonic AB=CD pattern is a powerful technical analysis tool used to predict price reversals in financial markets. Based on Fibonacci ratios, it helps traders identify high-probability entry and exit points. This concise guide is designed for TradingView users to apply the pattern effectively.
Pattern Overview
- Structure: Four points (A, B, C, D). AB and CD legs are equal in length or follow Fibonacci ratios.
- Fibonacci Ratios:
- BC retraces 61.8%-78.6% of AB.
- CD equals AB (1:1) or extends 1.272/1.618 of BC.
- Types:
- Bullish: Signals a buy at point D (price rises).
- Bearish: Signals a sell at point D (price falls).
How to Identify and Trade
1. Spot AB: Find a clear price swing from A to B.
2. Measure BC: Use TradingView’s Fibonacci Retracement tool to confirm BC retraces 61.8%-78.6% of AB.
3. Project CD: Use Fibonacci Extension to project CD, matching AB’s length or extending 1.272/1.618 of BC.
4. Confirm D: Check for confluence with support/resistance, candlestick patterns (e.g., doji), or indicators (e.g., RSI divergence).
5. Trade Execution:
- Bullish: Buy at D, set stop-loss below D, target point C or A.
- Bearish: Sell at D, set stop-loss above D, target point C or A.
Tips for TradingView
- Use TradingView’s Fib tools for precision.
- Confirm signals with additional indicators (e.g., MACD, volume).
- Avoid choppy markets; focus on trending or range-bound charts.
The AB=CD pattern is a reliable method for spotting reversals when used with proper confirmation. By mastering Fibonacci tools on TradingView and combining the pattern with other signals, traders can enhance their decision-making and improve trade outcomes. Practice on historical charts to build confidence.

What are Harmonic Price Patterns?Harmonic price patterns are chart patterns based on Fibonacci ratios and market geometry, used to identify potential reversal points in Forex. They rely on Fibonacci levels (e.g., 0.618, 0.786, 1.618) to measure price structures, predicting reversal zones (PRZ - Potential Reversal Zone).
Key Features:
- Based on Fibonacci ratios.
- Geometric structure with 4-5 points (X, A, B, C, D).
- Identifies PRZ for buy/sell opportunities.
- Symmetrical, reflecting market psychology.
Key Harmonic Patterns in Forex:
1. Gartley:
- AB retraces 61.8% of XA.
- D at 78.6% of XA.
- Buy/sell at D.
2. Bat:
- AB retraces 38.2-50% of XA.
- D at 88.6% of XA.
- High-precision at D.
3. Crab:
- CD extends 161.8% of XA.
- D at extreme levels.
- Suited for strong volatility.
4. Butterfly:
- AB retraces 78.6% of XA.
- D extends 127-161.8% of XA.
- End of strong trends.
5. Shark:
- AB retraces 113-161.8% of XA.
- D at 88.6-113% of XA.
- Volatile markets.
6. Cypher:
- CD retraces 78.6% of XC.
- Short-term timeframes.
How to Use:
1. Measure Fibonacci ratios to identify the pattern.
2. Locate PRZ at D, combine with support/resistance, RSI, or candlestick patterns.
3. Set stop-loss beyond PRZ, aim for risk/reward ≥ 1:2.
4. Enter trades at D after price/indicator confirmation.
Notes:
- Requires precise measurements.
- Combine with other tools for reliability.
- Practice on a demo account first.
- Avoid during high-volatility events (e.g., news releases).
Let me know if you need details on a specific pattern!

Weather and Corn: A Deep Dive into Temperature Impact1. Introduction: Corn and Climate – An Inseparable Relationship
For traders navigating the corn futures market, weather isn't just a background noise—it's a market mover. Few agricultural commodities are as sensitive to environmental variables as corn, especially temperature. Corn is grown across vast regions, and its development is directly tied to how hot or cold the season plays out. This makes weather not just a topic of interest but a core input in any corn trader’s playbook.
In this article, we go beyond conventional wisdom. Instead of simply assuming “hotter equals bullish,” we bring data into the equation—weather data normalized by percentile, matched with price returns on CME Group's corn futures. The results? Useful for anyone trading ZC or MZC contracts.
2. How Temperature Affects Corn Physiology and Yields
At the biological level, corn thrives best in temperatures between 77°F (25°C) and 91°F (33°C) during its growth stages. During pollination—a critical yield-defining window—extreme heat (especially above 95°F / 35°C) can cause irreversible damage. When hot weather coincides with drought, the impact on yields can be catastrophic.
Historical drought years like 2012 and 1988 serve as powerful examples. In 2012, persistent heat and dryness across the US Midwest led to a national yield drop of over 25%, sending futures skyrocketing. But heat doesn't always spell disaster. Timing matters. A heat wave in early June may have little impact. That same wave during tasseling in July? Major consequences.
3. The Market Mechanism: How Traders Respond to Temperature Surprises
Markets are forward-looking. Futures prices don’t just reflect today’s weather—they reflect expectations. A dry June may already be priced in by the time USDA issues its report. This dynamic creates an interesting challenge for traders: separating noise from signal.
During July and August—the critical reproductive phase—temperature updates from NOAA and private forecasters often trigger major moves. Rumors of an incoming heat dome? Corn futures might gap up overnight. But if it fizzles out, retracements can be just as dramatic. Traders who rely on headlines without considering what’s already priced in are often late to the move.
4. Our Analysis: What the Data Reveals About Corn and Temperature
To cut through the fog, we performed a percentile-based analysis using decades of weather and price data. Rather than looking at raw temperatures, we classified each week into temperature “categories”:
Low Temperature Weeks: Bottom 25% of the historical distribution
Normal Temperature Weeks: Middle 50%
High Temperature Weeks: Top 25%
We then analyzed weekly percentage returns for the corn futures contract (ZC) in each category. The outcome? On average, high-temperature weeks showed higher volatility—but not always higher returns. In fact, the data revealed that some extreme heat periods were already fully priced in, limiting upside.
5. Statistically Significant or Not? T-Tests and Interpretation
To test whether the temperature categories had statistically significant impacts on weekly returns, we ran a t-test comparing the “Low” vs. “High” temperature groups. The result: highly significant. Corn returns during high-temperature weeks were, on average, notably different than those during cooler weeks, with a p-value far below 0.01 (4.10854357245787E-13).
This tells us that traders can't ignore temperature anomalies. Extreme heat does more than influence the narrative—it materially shifts price behavior. That said, the direction of this shift isn't always bullish. Sometimes, high heat correlates with selling, especially if it’s viewed as destructive beyond repair.
6. Strategic Takeaways for Corn Traders
Traders can use this information in several ways:
Anticipatory Positioning: Use temperature forecasts to adjust exposure ahead of key USDA reports.
Risk Management: Understand that volatility spikes in extreme temperature conditions and plan stops accordingly.
Calendar Sensitivity: Prioritize weather signals more heavily in July than in May, when crops are less vulnerable.
Combining weather percentile models with weekly return expectations can elevate a trader’s edge beyond gut feel.
7. CME Group Corn Futures and Micro Corn Contracts
Corn traders have options when it comes to accessing this market. The flagship ZC futures contract from CME Group represents 5,000 bushels of corn and is widely used by commercial hedgers and speculators alike. For those seeking more precision or lower capital requirements, the recently launched Micro Corn Futures (MZC) represent just 1/10th the size.
This fractional sizing makes temperature-driven strategies more accessible to retail traders, allowing them to deploy seasonal or event-based trades without excessive risk exposure.
Here are some quick key points to remember:
Tick size for ZC is ¼ cent (0.0025) per bushel, equating to $12.50 per tick.
For MZC, each tick is 0.0050 equating to $2.50 per tick.
Standard ZC initial margin is approximately $1,000 and MZC margins are around $100 per contract, though this can vary by broker.
8. Wrapping Up: Temperature's Role in a Complex Equation
While temperature is a key driver in corn futures, it doesn't act in isolation. Precipitation, global demand, currency fluctuations, and government policies also play crucial roles. However, by quantifying the impact of extreme temperatures, traders gain a potential edge in anticipating market behavior.
Future articles will expand this framework to include precipitation, international weather events, and multi-variable models.
This article is part of a broader series exploring how weather impacts the corn, wheat, and soybean futures markets. Stay tuned for the next release, which builds directly on these insights.
When charting futures, the data provided could be delayed. Traders working with the ticker symbols discussed in this idea may prefer to use CME Group real-time data plan on TradingView: www.tradingview.com - This consideration is particularly important for shorter-term traders, whereas it may be less critical for those focused on longer-term trading strategies.
General Disclaimer:
The trade ideas presented herein are solely for illustrative purposes forming a part of a case study intended to demonstrate key principles in risk management within the context of the specific market scenarios discussed. These ideas are not to be interpreted as investment recommendations or financial advice. They do not endorse or promote any specific trading strategies, financial products, or services. The information provided is based on data believed to be reliable; however, its accuracy or completeness cannot be guaranteed. Trading in financial markets involves risks, including the potential loss of principal. Each individual should conduct their own research and consult with professional financial advisors before making any investment decisions. The author or publisher of this content bears no responsibility for any actions taken based on the information provided or for any resultant financial or other losses.

A Brief Overview of Price Patterns in TradingPrice patterns are technical analysis tools that help identify price behavior on charts to predict future trends.
Common patterns include continuation and reversal formations. Continuation patterns such as flags, triangles, and rectangles often appear during strong trends and indicate the likelihood of the trend continuing after a period of consolidation. Reversal patterns like head and shoulders, double tops and bottoms, and wedges signal potential changes in trend direction. Recognizing these patterns allows traders to optimize entry points, stop-loss levels, and take-profit targets. The clearer the pattern and the higher the timeframe it appears on, the more reliable it tends to be. However, no pattern guarantees success, so it's important to combine them with other factors like volume, support and resistance zones, and confirmation signals before making trading decisions. Each pattern has its own identifying characteristics such as shape, length, and breakout zones, so consistent observation and practice are essential. Price patterns not only assist in technical analysis but also reflect market psychology and crowd behavior. For best results, traders should combine pattern recognition with risk management and patiently wait for clear signals instead of reacting emotionally. A deep understanding of price patterns can increase the probability of success and reduce risk in the trading process.
Wishing you effective trading and strong discipline!

Trading Gold? Know the Difference Between XAU/USD and Futures🔎 Let’s address a question I get very often:
“Should I trade spot gold (XAU/USD) or Gold futures?”
It might sound like a technical decision, but it’s actually about how you approach the market, your risk profile, and your experience level.
So let’s break it down 👇
________________________________________
🟡 Two ways to trade the same asset
Both spot and futures allow you to speculate on the price of Gold. But they’re two very different beasts when it comes to execution, capital, and strategy.
________________________________________
1️⃣ Spot gold (XAU/USD)
• Traded mostly via Forex brokers or CFD platforms
• No expiration — you can hold the position as long as you want
• Often used by retail traders for day trading or swing setups
• You can open small trades (even 0.01 lots)
• Costs include spread, swap fees if you hold overnight
• Leverage is usually high — up to 1:100 or more
• Margin is required, but typically lower than in futures
💡 Spot is flexible and accessible, but you pay the price through overnight holding costs, wider spreads during volatility, and slippage. On some brokers, especially during high-impact news, your platform might even freeze or delay execution — and that’s a serious risk if you’re not prepared.
________________________________________
2️⃣ Gold futures (GC)
• Traded on major futures exchanges like CME
• Contracts have a fixed size (usually 100 oz)
• They expire monthly, so you need to manage rollovers
• Common among hedge funds and experienced traders
• You pay commissions and exchange fees, but no swaps
• Margin is required here too — but it's much higher
💡 Futures are structured and professional — but they demand more capital, stricter execution discipline, and higher margin requirements. Just like in spot trading, margin is a collateral deposit, not a cost — but with futures, the bar is set higher.
________________________________________
⚖️ So, which one is for you?
If you're using MetaTrader or any platform offered by a Forex/CFD broker, and you're a scalper, intraday, or swing trader working with flexible position sizes...
→ You're probably better off with spot gold (XAU/USD).
If you're trading big volume, managing diversified portfolios, or involved in hedging large exposure...
→ You should consider futures — but expect to level up your game, capital requirements, and discipline.
________________________________________
🧠 Mindset:
Don’t confuse accessibility with simplicity.
Just because spot Gold is easier to open doesn’t mean it’s always the best choice.
Just because futures look “pro-level” doesn’t mean they’re always worth it for a retail trader.
Understand your tools. Pick the one that aligns with your structure. That’s how you stay in the game. 🎯
________________________________________
📚 Hope this cleared it up. If you want me to cover execution setups for each one, let me know in the comments.

OPEC Countdown: Inverted H&S Signals Potential Oil Price Rise🧭 Market Context – OPEC in Focus
As Crude Oil Futures (CL) grind in tight consolidation, the calendar reminds traders that the next OPEC meeting takes place on May 28, 2025. This is no ordinary headline event — OPEC decisions directly influence global oil supply. From quota adjustments to production cuts, their moves can rapidly shift price dynamics across energy markets. Every tick in crude oil reflects not just current flows but also positioning ahead of such announcements.
OPEC — the Organization of the Petroleum Exporting Countries — coordinates oil policy among major producers. Its impact reverberates through futures markets like CL and MCL (Micro Crude), where both institutional and retail traders align positions weeks in advance. This time, technicals are speaking loud and clear.
A compelling bottoming structure is taking shape. The Daily timeframe reveals an Inverted Head and Shoulders pattern coinciding with a bullish flag, compressing into a potential breakout zone. If momentum confirms, CL could burst into a trend move — just as OPEC makes its call.
📊 Technical Focus – Inverted H&S + Flag Pattern
Price action on the CL daily chart outlines a classic Inverted Head and Shoulders — a reversal structure that traders often monitor for high-conviction setups. The neckline sits at 64.19, and price is currently coiled just below it, forming a bullish flag that overlaps with the pattern’s right shoulder.
What makes this setup powerful is its precision. Not only does the flag compress volatility, but the symmetry of the shoulders, the clean neckline, and the breakout potential align with high-quality chart pattern criteria.
The confirmation of the breakout typically requires trading activity above 64.19, which would trigger the measured move projection. That target? Around 70.59, which is near a relevant UFO-based resistance level — a region where sellers historically stepped in with force (UnFilled Orders to Sell).
Importantly, this bullish thesis will fail if price drops below 60.02, the base of the flag. That invalidation would potentially flip sentiment and set up a bearish scenario with a target near the next UFO support at 53.58.
To properly visualize the dual scenario forming in Crude Oil, a multi-timeframe approach is often very useful as each timeframe adds clarity to structure, breakout logic, and entry/exit positioning:
Weekly Chart: Reveals two consecutive indecision candles, reflecting hesitation as the market awaits the OPEC outcome.
Daily chart: Presents a MACD bullish divergence, potentially adding strength to the reversal case.
Zoomed-in 4H chart: Further clarifies the boundaries of the bullish flag.
🎯 Trade Plan – CL and MCL Long/Short Scenarios
⏫ Bullish Trade Plan:
o Product: CL or MCL
o Entry: Break above 64.19
o Target: 70.59 (UFO resistance)
o Stop Options:
Option A: 60.02 (tight, under flag)
Option B: ATR-based trailing stop
o Ideal for momentum traders taking advantage of chart pattern combined with fundamental data coming out of an OPEC meeting
⏬ Bearish Trade Plan:
o Trigger: Break below 60.02
o Target: 53.58 (UFO support)
o Stop Options:
Option A: 64.19 (tight, above flag)
Option B: ATR-based trailing stop
o Ideal for momentum traders fading pattern failures
⚙️ Contract Specs – CL vs MCL
Crude Oil can be traded through two futures contracts on CME Group: the standard CL (WTI Crude Oil Futures) and the smaller-sized MCL (Micro WTI Crude Oil Futures). Both offer identical tick structures, making MCL a powerful instrument for traders needing more flexibility in position sizing.
CL represents 1,000 barrels of crude per contract. Each tick (0.01 move) is worth $10, and one full point of movement equals $1,000. The current estimated initial margin required to trade one CL contract is approximately $6,000 per contract, although this may vary based on market volatility and brokerage terms.
MCL, the micro version, represents 100 barrels per contract — exactly 1/10th the size of CL. Each 0.01 tick move is worth $1, with one point equaling $100. The estimated initial margin for MCL is around $600, offering traders access to the same technical setups at significantly reduced capital exposure.
These two contracts mirror each other tick-for-tick. MCL is ideal for:
Testing breakout trades with lower risk
Scaling in/out around events like OPEC
Implementing precise risk management strategies
Meanwhile, CL provides larger exposure and higher dollar returns but requires tighter control of risk and account drawdowns. Traders can choose either—or both—based on their strategy and account size.
🛡️ Risk Management – The Foundation of Survival
Technical setups don’t make traders profitable — risk management does.
Before the OPEC meeting, traders must be aware that volatility can spike, spreads may widen, and whipsaws can invalidate even the cleanest chart pattern.
That’s why stop losses aren’t optional — they’re mandatory. Whether you choose a near level, a deeper stop below the head, or an ATR-based trailing method, the key is clear: define risk before entry.
MCL helps mitigate capital exposure for those testing breakout confirmation. CL demands higher margin and greater drawdown flexibility — but offers bigger tick rewards.
Precision also applies to exits. Targets must be defined before entry to maintain reward-to-risk discipline. Avoid adding to losers or chasing breakouts post-event.
And most importantly — never hold a losing position into an event like OPEC, hoping for recovery. Risk is not a gamble. It’s a calculated variable. Treat it with respect.
When charting futures, the data provided could be delayed. Traders working with the ticker symbols discussed in this idea may prefer to use CME Group real-time data plan on TradingView: www.tradingview.com - This consideration is particularly important for shorter-term traders, whereas it may be less critical for those focused on longer-term trading strategies.
General Disclaimer:
The trade ideas presented herein are solely for illustrative purposes forming a part of a case study intended to demonstrate key principles in risk management within the context of the specific market scenarios discussed. These ideas are not to be interpreted as investment recommendations or financial advice. They do not endorse or promote any specific trading strategies, financial products, or services. The information provided is based on data believed to be reliable; however, its accuracy or completeness cannot be guaranteed. Trading in financial markets involves risks, including the potential loss of principal. Each individual should conduct their own research and consult with professional financial advisors before making any investment decisions. The author or publisher of this content bears no responsibility for any actions taken based on the information provided or for any resultant financial or other losses.

Automate Gold Trading with Machine Learning and LLMS: FULL Guide🚀 Harnessing Machine Learning and Large Language Models (LLMs) to Automate Gold Trading: A Practical Guide
Gold 🥇 has long been considered a safe-haven asset and a cornerstone of investment portfolios worldwide. The advent of advanced technologies like machine learning (ML) 🤖 and large language models (LLMs) 🧠 has opened new avenues for automating gold trading, enhancing accuracy, and improving profitability.
🌟 Why Automate Gold Trading with ML and LLMs?
Machine learning algorithms excel at detecting complex patterns, analyzing vast amounts of market data swiftly, and predicting price movements more reliably than traditional methods. LLMs, such as GPT-4, further augment trading strategies by interpreting news sentiment, macroeconomic data, and global geopolitical events in real-time, offering nuanced insights into gold market movements.
🛠️ Step-by-Step Practical Implementation
1. 📊 Data Acquisition and Preparation:
Historical gold price data (open, close, high, low).
Economic indicators: inflation rates 📈, currency valuations (USD strength 💵), and interest rates 📉.
News sentiment analysis 📰 derived from financial headlines using GPT-4.
Example Application:
Use APIs like Alpha Vantage or Yahoo Finance to pull historical gold prices.
Integrate financial news from Bloomberg or Reuters and summarize sentiments using GPT-4 API.
2. 🎯 Choosing the Right ML Model:
Time Series Forecasting Models: LSTM ⏳ (Long Short-Term Memory), GRU 🔄 (Gated Recurrent Units).
Classification Models: Random Forest 🌳, Gradient Boosting Machines (GBM), and XGBoost 🚀 for predicting upward/downward price movements.
Example Application:
Use Python libraries such as TensorFlow, Keras, and XGBoost to build and train these models.
Predict price changes for the next trading session to make informed entry and exit decisions.
3. 🤖 Integrating Large Language Models (LLMs):
Employ GPT-4 or similar LLMs to perform real-time sentiment analysis on financial news.
Translate sentiment results into numerical signals (e.g., +1 positive, 0 neutral, -1 negative).
Example Application:
Daily analyze major news headlines related to gold using GPT-4 to capture market sentiment.
Incorporate these signals into your ML model to refine price movement predictions.
4. 📈 Training and Validation:
Train models on historical datasets using cross-validation to prevent overfitting.
Optimize parameters using genetic algorithms 🧬 or grid search techniques.
Example Application:
Use scikit-learn’s GridSearchCV or genetic algorithms in libraries like DEAP for parameter tuning.
5. ⚙️ Automating Trades with Expert Advisors (EA) on MetaTrader 5:
Integrate ML and LLM-derived signals into MetaTrader 5 Expert Advisors.
Implement position-sizing logic, risk management, and automatic lot scaling.
Example Application:
Write custom MQL5 scripts that execute trades based on ML model predictions and sentiment analysis outputs.
Dynamically adjust position size based on account equity and market volatility.
🛡️ Practical Considerations for Robustness
Risk Management: Always integrate dynamic stop-losses 🛑, trailing stops, and overall account-level risk management.
Flat Market Detection: Employ advanced techniques like Hurst Exponent, ADX/DMI compression, or Bollinger Band squeezes 🔍.
Continuous Optimization: Regularly retrain models and update sentiment analysis parameters.
🌐 Benefits of Combining ML and LLMs
Enhanced predictive accuracy 📈 through combined numerical and textual data analysis.
Improved adaptability 🔄 in dynamic market conditions.
Reduced emotional bias 😌 and human errors in trading.
⚠️ Challenges and Solutions
Data Quality and Overfitting: Rigorous preprocessing and cross-validation.
Market Regime Shifts: Continuous monitoring and periodic recalibration of models.
📌 Real-World Application Examples
Example 1:
Combine sentiment analysis with price data to predict significant market movements around economic announcements (e.g., Fed rate decisions).
Example 2:
Deploy an ML-driven EA on MetaTrader 5, adjusting positions based on both predictive analytics and real-time news sentiment shifts, significantly improving trade timing and results.
Example 3:
Use an adaptive ML model that retrains weekly with the latest market data, ensuring the trading algorithm remains relevant to current market conditions.
🎉 Conclusion
Automating gold trading using machine learning and LLMs presents an exciting frontier for traders. By leveraging these technologies, traders can significantly enhance decision-making, effectively manage risk, and achieve consistent profitability. The future of gold trading automation lies in blending cutting-edge algorithms with insightful real-time analysis, making now the perfect time to integrate ML and LLMs into your trading toolkit. 🥇🤖💹

Understanding the Economic Calendar: A Must-Have Tool for EveryThe economic calendar is an essential tool that helps traders track economic events and indicators that may impact financial markets such as Forex, gold, and stock indices.
Common data listed in the calendar include interest rates, GDP, inflation (CPI), unemployment rates, retail sales, consumer confidence, FOMC minutes, and speeches from central bank officials. Each event shows the release time, the issuing country, detailed content, and an impact rating from low to high. Traders need to check the economic calendar daily to anticipate periods of high market volatility.
For example, when the U.S. releases interest rate decisions or the Non-Farm Payroll (NFP) report, CAPITALCOM:GOLD gold and USD pairs often experience fast and strong price movements. Based on the calendar, traders can avoid trading right before major news to reduce risk, or take advantage of the volatility if they have experience. In addition, the economic calendar supports building medium- and long-term strategies based on economic cycles. Understanding macroeconomic trends allows traders to be more proactive and confident instead of reacting to price movements. Combining the economic calendar with technical analysis improves decision-making and risk management. Traders can access the calendar for free on reputable websites like Forex Factory, Investing, or directly within MT4 and MT5 platforms. This is a must-use tool for anyone aiming to trade professionally and with discipline.
Wishing you success and clarity in every trade.

MT4 User Guide for BeginnersMetaTrader 4 (MT4) is a popular trading platform for Forex and gold markets. To get started, download the software from your broker’s website or install the MT4 app from the App Store or Google Play.
After installation, open the platform and log in using your account number, password, and the server provided by your broker. Once the bottom right corner shows “Connected,” you’re successfully logged in.
The MT4 interface includes: Market Watch (price list), Chart (candlestick chart), Terminal (order management), and Navigator (accounts and indicators). To open a chart, right-click on a symbol in Market Watch and select “Chart Window.” To add technical indicators, go to the Insert menu > Indicators.
To place an order, press F9 or right-click on the chart and choose “New Order,” then enter the volume and select Buy or Sell. You can also set Stop Loss and Take Profit levels if needed. For pending orders, choose the order type under “Pending Order,” set your desired price, and confirm.
To manage your trades, go to the “Trade” tab at the bottom where you can modify or close orders by right-clicking them. Trading history is available under the “Account History” tab.
MT4 supports chart customization, saving templates, and using advanced indicators. It’s a flexible platform suitable for both beginners and experienced traders. Practice regularly to master its features.
Good luck with your trading journey!
