April 2025 Market Crash: Causes, Impact, and Strategic ResponseApril 2025 will go down in financial history as one of the most turbulent months of the past decade. A large-scale market crash, triggered by geopolitical escalation and intensified trade tensions, revealed just how fragile the global investment landscape remains—even after a relatively stable start to the year.
What Happened?
On April 6, 2025, the U.S. administration announced sweeping tariffs of up to 145% on all Chinese imports. This decision, though preceded by months of political strain, took the markets by surprise. Panic-selling ensued almost immediately. The Dow Jones plummeted over 4,000 points within two days—the steepest decline since the COVID-era crash of 2020. The S&P 500 and Nasdaq followed suit, dropping 6–9% in a matter of hours.
Asian and European indices mirrored the collapse: Japan’s Nikkei 225 fell by 7.8%, and Germany’s DAX dropped by 5.4%. The synchronized reaction emphasized the ongoing interdependence of global markets, even in an era of growing protectionism.
Why It Matters
For GeldVision clients and institutional investors worldwide, such events highlight the importance of risk-managed portfolio strategies. The April crash wasn’t solely a reaction to tariffs—it was also driven by fears of a potential recession and uncertainty surrounding central bank policies.
Another destabilizing factor was the automatic response of algorithmic trading systems, which exited positions en masse as technical indicators were breached—amplifying volatility and accelerating the selloff.
How GeldVision Responded
Since early 2025, we at GeldVision have implemented a strategy of “adaptive conservatism,” gradually reducing equity exposure in client portfolios and reinforcing positions in defensive assets such as gold, investment-grade bonds, and liquid currency instruments.
During the height of the market turmoil, our team activated internal stress protocols, including temporary order freezes on automated buy-ins and direct client communications for real-time portfolio reviews. This proactive approach allowed us to minimize losses and maintain client confidence.
What’s Next?
We expect volatility to persist at least through Q3. For investors, the key is to avoid reactive decisions and maintain a long-term perspective. GeldVision will continue to expand its macroeconomic monitoring, enhance risk models, and provide clients with the tools needed to navigate uncertain markets safely.
Trend Analysis

European Stocks Rise Amid Positive NewsEuropean stock markets are experiencing a steady rise, buoyed by a series of encouraging developments that have boosted investor confidence and driven share prices higher. This wave of optimism is being fueled by both internal economic signals and an improving global environment, including stabilized interest rates and signs of a business rebound.
What's Driving the Growth?
One of the primary catalysts behind the rally is recent economic data showing a slowdown in inflation across the eurozone, alongside a revival in consumer demand. These indicators have strengthened expectations that the European Central Bank may soon pivot from a tight monetary stance to a more accommodative approach. Investors have welcomed these signals as evidence that the regional economy is adjusting well to challenging conditions and avoiding a deeper downturn.
Additionally, stronger-than-expected quarterly earnings reports have played a key role in lifting stock prices, particularly in the banking, technology, and industrial sectors. Major players such as Siemens, BNP Paribas, and SAP have posted solid gains, reflecting broader confidence in corporate resilience.
Renewed Investor Interest in Europe
Improving macroeconomic indicators are drawing renewed attention to European assets. With risks appearing more contained and equity yields remaining attractive, many investors are beginning to view the region as a compelling opportunity. Stock exchanges in Germany, France, and the Netherlands have stood out, showing consistent growth and high trading volumes.
Geopolitical factors are also contributing to the market’s upbeat tone. Gradual normalization of trade relations with key partners and the strengthening of the euro on foreign exchange markets are adding to investor enthusiasm.
What’s Next?
Analysts suggest that if current trends continue, European indices could reach new yearly highs. Key factors to watch in the near term include upcoming central bank decisions and fresh data on GDP growth and employment. Nevertheless, the present sentiment points toward confidence in the ongoing recovery.
Conclusion
The European stock market is entering a phase of stable growth, driven by favorable economic indicators, manageable inflation, and an improving business climate. Positive news continues to give investors reasons for optimism, and if momentum holds, Europe could emerge as one of the top-performing investment regions in the coming months.

Impatience Tax in Trading: The Costs of Clicking Too SoonHave you ever thought that maybe some of your losses don’t come from bad trades? Rather, they come from good trades, timed badly?
You see the setup, the signal’s almost there, the MACD is leaning in, the candle is flirting with support — and boom, you click. Early. Too early.
Price dips a bit more and then shoots upward like a rocket. Your stop gets triggered — you just paid the impatience tax.
Welcome to the place where you get taxed for being impatient — a very real, very expensive fee traders pay when their fingers move faster than their reasoning.
🤫 The Impatience Tax — A Silent Killer Dressed as Urgency
The impatience tax doesn’t appear on your statement. You won’t see it listed in your commissions, or under slippage, or labeled in red ink like a realized loss. But rest assured, it’s there — nibbling away at your P&L every time you front-run your own strategy.
And the worst part? It feels productive. You’re taking initiative, showing conviction, being bold. Except what you're really doing is lighting good setups on fire because you couldn’t wait for one more candle to close.
🧬 The Anatomy of an Early Click
Here’s how it usually goes:
You spot a setup.
You get excited.
You skip the checklist.
You enter on the 3rd candle instead of the 5th.
The market fakes out.
You get stopped out.
The market then does exactly what you expected — without you.
Every trader has lived this story. And it hurts more than a loss from a bad trade. Because this wasn’t a bad idea. It was a good idea butchered by bad timing.
🤝 Impatience Loves Company (And Volatility)
Impatience tends to thrive in fast markets. When the price is moving, you feel like you need to act. You notice some breaking news that moves markets, charts start to jiggle and tickers flash — suddenly your FOMO glands kick in.
You’re not waiting for confirmation. You’re reacting — to price, to emotion, to fear of missing out.
It’s not just beginners either. Even seasoned traders occasionally get sucked in. Why? Because the brain is wired to avoid missing opportunities more than it’s wired to avoid losses. We want in. Now. Before it's “too late.”
But here’s a pro secret: the markets tend to always give second chances. You just have to be around to take them.
⏰ Why the Best Traders Wait
Let’s talk about patience. Not the zen-monk, meditate-in-a-cave-for-years kind. The market kind.
The kind that says: “Nope, not yet.”
The kind that closes the platform until the London session starts.
The kind that lets a trade go because it didn’t meet all the criteria — even if it was close.
Top traders aren’t paid for activity. They’re paid for precision. The entry is 90% of the battle. If you win there, the rest is just management.
🧐 How to Identify an Impatience Habit
Want to know if you’re paying the impatience tax regularly? Try this:
Look at your last 10 triggered stop loss orders: How many were within a few ticks of reversal?
Count your trades per day: Are you averaging more than your strategy demands?
Review your entry notes: Did you say things like “close enough” or “looks good”?
If the answer is yes, you’re a tax-paying member of the Impatience Society.
👷♂️ Build a Buffer: Taming the Trigger Finger
So how do you stop paying the Impatience Tax?
Start with structure:
Use time-based confirmations. Wait for the candle to close. A candle halfway formed is a lie detector test mid-question.
Have a rule-based checklist. If a trade doesn’t meet every item, you don’t take it. No exceptions.
Use alerts , not entries. Let the price come to you. Your job is to hunt, not chase.
Trade fewer setups, better. Less is more when each trade has meaning and clarity.
And when in doubt? Wait. The worst that happens is you miss one trade. The best that happens is you finally stop losing money edge by edge.
💵 Impatience Is Expensive. Patience Is Profitable.
The market is designed to reward discipline, not urgency. Speed might help you scalp news reactions, but even that requires planned execution. Unchecked impatience is just impulse with a brokerage account.
It's important to always remember that you’re not trying to win this trade. You’re trying to win this game for the long run.
And winning the game means surviving long enough to let your edge play out — with patience, not panic.
💎 Final Thoughts: Don’t Confuse Action with Progress
The financial markets are a cruel place for dopamine seekers. They offer constant motion, flashing lights, and infinite temptation to click before thinking.
But progress isn’t about how many trades you take — it’s about how many good ones you wait for.
So next time your mouse finger twitches, ask yourself: Is this the plan? Or is this impatience disguised as opportunity seeking instant gratification?
Because every early click is a donation to someone else’s P&L.
👉 Your turn : What’s your best (or worst) story of jumping the gun? How have you built patience into your process — or are you still wrestling with the trigger? Let us know in the comments!

Why Gold Is Pulling Back Now – May 2025 Update⚡️After surging above $3,500/oz in late April, gold has since declined over 8%, recently breaking below key levels and now trading near $3,210. The retracement reflects fading panic buying and growing attention to fundamental drivers: U.S. monetary policy, the strong dollar, easing geopolitical risks, and completed trade agreements. Here’s a breakdown of the leading catalysts and their current impact (ranked 0–10).
1. Fed “Higher for Longer” Bias Strength: 9/10 The Fed kept interest rates at 4.25–4.50% at its June policy meeting and reiterated its cautious stance. The absence of cuts combined with persistent inflation pressure is lifting real yields and undercutting gold’s appeal as a non-yielding asset.
2. U.S. Dollar Resurgence Strength: 8/10The U.S. Dollar Index (DXY) has climbed above 101 as investors digest the Fed’s hawkish tone. A stronger dollar reduces global gold demand, especially from non-USD buyers.
3. U.S.–China Trade Agreement Reached in Switzerland Strength: 7.5/10 A formal trade deal was announced in Geneva in May, easing longstanding tariff tensions. While specific tariff rollback details are pending, markets welcomed the de-escalation, pushing investors away from gold and into risk assets.
4. U.S.–U.K. Trade Deal Signed Strength: 7/10 The U.S. and U.K. finalized a bilateral trade agreement in early May, boosting global sentiment and further reducing the geopolitical premium priced into gold.
5. India–Pakistan Border De-escalation Strength: 6.5/10 After brief clashes in Kashmir in mid-May, both sides have since released statements of restraint. The calm has helped cap gold’s safe-haven bids.
6. Iran–U.S. Nuclear Talks Update Strength: 6/10 Talks resumed in Vienna in May with cautious optimism. While no concrete deal has been signed, progress and diplomatic language from both sides have eased fears of escalation.
7. Russia–Ukraine Ceasefire Developments Strength: 5.5/10 Localized ceasefires in eastern Ukraine, brokered by Turkey and the UN, have lowered near-term geopolitical risk. However, skepticism remains around long-term stability.
8. ETF Inflows & Institutional Demand Strength: 5/10 ETF inflows slowed in May (up just 48.2 tonnes), reflecting waning retail momentum. Still, central bank buying—especially from China—offers a medium-term cushion.
Catalyst Strength Rankings (May 2025)
🔸Fed “higher for longer” bias 9
🔸U.S. dollar rebound 8
🔸U.S.–China trade agreement 5.5
🔸U.S.–U.K. trade deal signed 5
🔸India–Pakistan border easing 6.5
🔸Iran–U.S. nuclear diplomacy 6
🔸Russia–Ukraine ceasefire 5.5
🔸Global gold ETF & central-bank inflows 5
Where Next for Gold?
⚡️Current price: ~$3,210/oz
📉Recent support levels broken: $3,300 and $3,250
🎯Next technical floor: $3,150/oz
✨Upside triggers: Renewed dollar weakness, inflation surprise, or geopolitical flare-up
Gold’s recent drop reflects the market's rotation out of fear-driven trades into yield-bearing and risk assets. While the Fed and the dollar remain dominant forces, any shock—whether geopolitical or inflationary—could quickly reignite interest in gold as a hedge.

Golden Rejection Candle Strategy–Catch Explosive Intraday Moves!Hello Trader!
Are you tired of buying options and watching premiums die slowly?
Or chasing breakouts that reverse the moment you enter?
Here’s your solution – the Golden Rejection Candle Strategy , designed especially for option buyers who want timed entries, fast momentum, and defined risk .
What is a Golden Rejection Candle?
A special candlestick that forms when price hits a strong level (like VWAP, trendline, or demand/supply zone) and gets instantly rejected.
It leaves behind a long wick (shadow), showing that buyers or sellers stepped in with force .
This candle often marks the start of a sharp intraday reversal .
It's not just a random wick — it’s a smart money footprint .
Live Chart Example – Nifty Spot vs Option Premium (23950 CE)
Date: 9th May 2025
Timeframe: 1 min (Spot), 1 min (Options)
Spot Chart Setup: Nifty approached a marked green support zone and created a strong wick rejection with a small body candle — classic sign of buyers defending the level.
Confirmation Candle: The next candle broke above the rejection candle’s high, confirming the reversal setup.
Premium Reaction: On the 1-min ATM Option chart (23950 CE), premiums jumped from 270 to 344 – a clean 26% gain within few minutes.
Risk-Reward Snapshot: Entry was at breakout, SL just below rejection wick, and target hit in a single momentum burst — the kind of move option buyers live for.
How to Trade It as an Option Buyer
Choose the Right Strike: Use ATM or slightly ITM options to get faster movement when price reverses.
Entry Strategy: Wait for the next candle to break the rejection candle’s high/low. No break = No trade.
SL Placement: Keep it just beyond the wick. Small loss if wrong, big reward if right.
Exit Plan: Aim for intraday resistance/support or spike-based exits — option premiums often give quick moves post-rejection.
What NOT to Do:
Don’t enter on the rejection candle itself — wait for confirmation.
Avoid trading this pattern in low volume or middle of the range.
Don’t hold blindly — if premium spikes, take the money and run!
Rahul’s Tip:
“Sudden reversals are where option buyers make money — not slow trends. The rejection candle shows intent. The breakout shows confirmation. Combine both.”
Conclusion:
The Golden Rejection Candle Strategy gives you an edge that most random trades lack — timing, context, and structure.
If you're an option buyer, this can be your go-to setup to avoid traps and enter only when smart money steps in.
No more guessing. No more fear.
Just clean, price-action-based entries that make sense.
👇 Have you ever used rejection-based setups? Drop your favorite trade below! Let’s learn together.
If you found this post valuable, don't forget to LIKE and FOLLOW!
I regularly share real-world trading setups, actionable strategies, and learning-focused content — all from real trading experience , not theory . Stay connected if you're serious about growing as a trader!

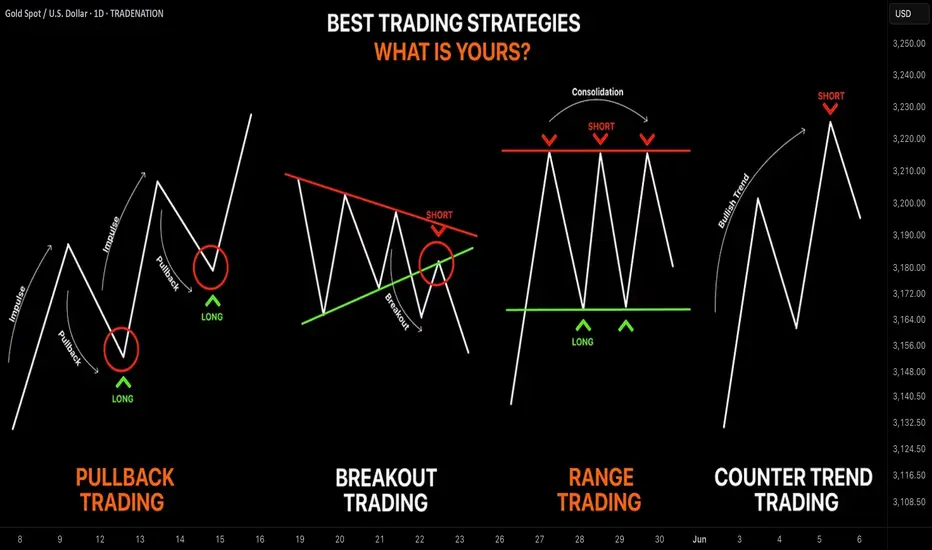
Learn the 4 Best Strategies to Maximize Your Profits in Trading
In the today's article, we will discuss 4 classic yet profitable forex and gold trading strategies.
1️⃣Pullback Trading
Pullback trading is a trend-following strategy where you open the positions after pullbacks.
If the market is trading in a bullish trend, your goal as a pullback trader is to wait for a completion of a bullish impulse and then let the market correct itself. Your entry should be the assumed completion point of a correctional movement. You expect a trend-following movement from there.
In a bearish trend, you wait for a completion of the bearish impulse, let the market retrace, and you look for short-entry after a completion of the retracement leg.
Here is the example of pullback trading.
On the left chart, we see the market that is trading in a bearish trend.
A pullback trader would short the market upon completion of the correctional moves.
On the right chart, I underlined the buy entry points of a pullback trader.
That strategy is considered to be one of the simplest and profitable and appropriate for newbie traders.
2️⃣Breakout Trading
Breakout trading implies buying or selling the breakout of a horizontal structure or a trend line.
If the price breaks a key support, it signifies a strong bearish pressure.
Such a violation will trigger a bearish continuation with a high probability.
Alternatively, a bullish breakout of a key resistance is a sign of strength of the buyers and indicates a highly probable bullish continuation.
Take a look, how the price broke a key daily resistance on a daily time frame. After a breakout, the market retested the broken structure that turned into a support. A strong bullish rally initiated from that.
With the breakout trading, the best entries are always on a retest of a broken structure.
3️⃣Range Trading
Range trading signifies trading the market that is consolidating .
Most of the time, the market consolidates within the horizontal ranges.
The boundaries of the range may provide safe points to buy and sell the market from.
The upper boundary of the range is usually a strong resistance and one may look for shorting opportunities from there,
while the lower boundary of the range is a safe place to buy the market from.
EURCAD pair is trading within a horizontal range on a daily.
The support of the range is a safe zone to buy the market from.
A bullish movement is anticipated to the resistance of the range from there.
Taking into considerations, that the financial instruments may consolidate for days, weeks and even months, range trading may provide substantial gains.
4️⃣Counter Trend Trading
Counter trend trading signifies trading against the trend.
No matter how strong is the trend, the markets always trade in zig-zags. After impulses follow the corrections , and after the corrections follow the impulses.
Counter trend traders looks for a completion of the bullish impulses in a bullish trend to short the market, and for a completion of bearish impulses in a downtrend to buy it.
Here is the example of a counter trend trade.
EURJPY is trading in a bullish trend. However, the last 3 bearish moves initiated from a rising trend line. For a trader, shorting the trend line was a perfect entry to catch a bearish move.
Such trading strategy is considered to be one of the most complicated , because one goes against the crowd and overall sentiment.
With the experience, traders may combine these strategies.
❤️Please, support my work with like, thank you!❤️
I am part of Trade Nation's Influencer program and receive a monthly fee for using their TradingView charts in my analysis.
You want to be a trader but you have a 9-5 Educational purpose only. You want to be a day trader but can't trade market open because you have a job or you are too busy. The daily bar can give you just as much profits as the 5 min charts. In this video ill teach you how to find support and resistance zone on any market. Opening a line chart starting from the weekly and then looking for areas where price has repeatedly reverse gives you a clue of where price may go in the future on a daily chart. Watch till the end to see how this strategy is applied to all markets.

7 reasons why people may still struggle to make money in crypto Why people may still struggle to make money in #crypto
1. ** #Market Volatility**
- The cryptocurrency market is highly volatile, with prices fluctuating dramatically. This can lead to significant losses if investments are not timed well.
2. **Lack of Information**
- Insufficient information can hinder investment decisions, making it difficult to identify profitable opportunities.
3. **Fraud and Scams**
- The crypto space is rife with scams and fraudulent schemes. It's crucial to be able to distinguish between legitimate projects and scams.
4. **Lack of Long-term Perspective**
- Many investors focus on short-term gains, which can lead to impulsive decisions and losses, rather than holding for the long term.
5. **Emotional Trading**
- Emotional reactions to market changes can lead to poor decision-making, such as panic selling or chasing after trends.
6. **Regulatory Uncertainty**
- Ongoing regulatory changes can impact the market and create uncertainty, affecting investment strategies.
7. **High Transaction Fees**
- Transaction fees can eat into profits, especially for smaller trades.
Conclusion
Investing in cryptocurrency requires careful research, a clear strategy, and an understanding of the risks involved.

Support and Resistance Levels: A Beginner Trader's GuideSupport and Resistance Levels: A Beginner Trader's Guide
Hello!
If you’re just starting your journey in trading, you’ve probably already heard about "support" and "resistance." These terms might sound intimidating, but their essence is simple. Think of an asset’s price as a ball bouncing between a floor and a ceiling. The floor is support , and the ceiling is resistance . Let’s break down how this works and how to use these levels in your trading.
1. What Are Support and Resistance?
- Support is a price level where buyers (bulls) are strong enough to halt a decline.
→ Example: Suppose the GBP/USD price drops to resistance line multiple times but bounces back each time. This line is a strong support level.
- Resistance is a level where sellers (bears) take control, preventing the price from rising further.
Why is this important?
These levels help you anticipate where the price might reverse or continue moving. They’re like road signs on your chart!
2. How to Identify Support and Resistance on a Chart
Start by analyzing price history. Support and resistance levels form where the price has repeatedly stalled.
- Step 1: Open a daily or hourly chart . The larger the timeframe, the more significant the level.
- Step 2: Look for points where the price reversed . For example, lows (for support) and highs (for resistance).
- Step 3: Draw horizontal lines through these points.
→ Visual Example:
On the GBP/USD chart, the price tested the level multiple times and bounced. This is clear support. The resistance level, where upward momentum stalled, acts as resistance.
3. How to Trade Using Support and Resistance
There are two main scenarios: *bouncing off a level* and *breaking through a level*.
Scenario 1: Bouncing Off Support or Resistance
- If the price approaches support, consider opening a long position (buying), expecting a rebound.
- If the price nears resistance, consider opening a short position (selling), anticipating a drop.
Scenario 2: Breaking Through a Level
If the price breaks support or resistance with high volume, it’s a signal to act:
- Breaking resistance → Buy.
- Breaking support → Sell.
→ Example:
GBP/USD breaks above resistance at 2.01050. You enter a short position, placing a stop-loss below 2.04040 order-block.
4. Common Beginner Mistakes to Avoid
- Overloading the chart with lines . Don’t mark every minor swing—focus on key levels.
- Ignoring volume . A breakout without increasing volume is often a false signal.
- Impatience . The price may test a level repeatedly—wait for confirmation before trading.
5. Practice Is the Key to Success
1. Study historical data . Open past charts and practice identifying levels retrospectively.
2. Use a demo account . Test your strategies risk-free.
3. Keep a trading journal . Note why you chose specific levels and analyze your mistakes.
6.Conclusion
Support and resistance levels are your best allies in trading. They reveal market structure and guide your decisions. Don’t get discouraged if it feels challenging at first—practice will sharpen your intuition. Remember, even professionals make mistakes. Focus on risk management and continuous learning.
Good luck! You’ve got this!

Fibonacci Extensions: Mapping Market Psychology Beyond the TrendHello, traders! 💫
Fibonacci numbers have traveled far from ancient Italian math to modern trading charts. In technical analysis, Fibonacci Extensions aren’t just mystical ratios; they’re a structured way to project potential price targets based on crowd psychology and trend continuation.
But what are they really, and why do so many traders draw those lines with near-religious fervor?
🧠 A Quick Historical Detour
Leonardo Fibonacci introduced the sequence to the West in the 13th century based on patterns he observed in Indian mathematics. The key idea is that each number in the sequence is the sum of the two before it: 1, 1, 2, 3, 5, 8, 13, 21...
When you divide specific numbers in the sequence, you get ratios that repeat throughout nature — and, intriguingly, financial markets. These include:
0.618 (the “golden ratio”)
1.618
2.618, and so on.
While Fibonacci Retracements look backward to gauge potential pullbacks, Fibonacci Extensions look forward to mapping possible continuation levels after a price move.
📊 Fibonacci Extensions
To use Fibonacci Extensions, you need three points:
The Start of a Trend (Point A)
The End of the Trend or Impulse Move (Point B)
A Retracement Low/High Where Price Bounces or Consolidates (Point C)
This ABC move applies Fibonacci ratios to project levels beyond point B, helping traders visualize where the price might go if the trend continues.
Common Extension Levels Include:
1.272
1.618 (golden ratio)
2.0
2.618
Each level acts as a kind of psychological milestone — not a guarantee, but a place where market participants may take profits, reassess, or react.
🔎 Let’s Take a Real Example: BTC/USDT Weekly
It's not that Fibonacci numbers have magical power. The theory is based on self-fulfilling behavior. When enough traders watch the same levels — and act on them — they can influence real outcomes.
The chart illustrates how Fibonacci retracement levels can be used to understand the depth and structure of a correction during a bullish cycle.
Low (~$4,783) in March 2020 (COVID-19 Сrash)
to the High (~$65,834) in November 2021 (Bull Market Peak)
From there, the price corrected throughout 2022–2023. Let’s look at what happened at each level — and what it tells us on the graph.
🔍 Why This Matters
Your retracement levels aren’t just lines — they mapped the psychology of the market:
Investors Testing Conviction at 0.5
Panic at 0.618
Capitulation Near 0.786 — but Without Full Breakdown
And Finally: A Rebound in 2023, Leading to New Highs in 2025
This kind of structure is textbook Fibonacci behavior — and is part of why retracement levels remain a core part of institutional technical analysis.
⚖️ Final Thought
Fibonacci Extensions are not about telling you where the price will go — they’re about framing where the price might go if the current trend keeps moving. It’s a lens through which to read market psychology, momentum, and expectation. Combined with volume, structure, and broader trend context, they potentially help analysts build a more nuanced market narrative.
And maybe Leonardo Fibonacci would have appreciated that his 800-year-old math is still trying to decode modern human emotion, just on candlestick charts.

BTCUSDT 13R Trade Breakdown: Deep Crab Pattern + SMC Precision Hello Traders!
If you enjoyed my previous post on combining Harmonic Patterns with Smart Money Concepts (SMC) for high-precision, high-risk-to-reward trades, then you're going to love this breakdown on BTCUSDT.
If you haven’t checked out my earlier content, make sure to scroll below this post and see that first—it sets the foundation for what we’re diving into here.
📈 BTCUSDT Trade Breakdown: Harmonic x SMC Precision Entry
This analysis was originally shared around three weeks ago on my YouTube channel, and if you were with me live, you’ll remember I was closely watching for a Bullish Deep Crab Pattern to complete before considering a LONG position.
Let’s walk through the setup and outcome step-by-step:
🕰 WEEKLY TIMEFRAME:
Price was reacting to a Weekly Fair Value Gap (FVG) and had filled the imbalance.
As shown in the chart:
🔍 SETUP: Strategy Confirmation
Important Reminder:
Just because price hits a key level doesn’t mean we jump in to buy or sell.
✅ There must be a confirmed Harmonic Pattern that aligns with the key SMC level.
On the Daily Chart, we identified a valid Bullish Deep Crab Pattern:
B-point at 0.886
PRZ (Potential Reversal Zone) at 1.618 FIB Extension
This PRZ aligned perfectly with the key level identified on the Weekly chart.
🎯 ENTRY STRATEGY (15-Minute Chart):
We zoomed into the 15M chart for an SMC-based entry.
Supply-to-demand flip confirmed with a visible liquidity inducement—textbook confirmation.
Entry was just a few pips below the recent swing low to limit downside risk in case of invalidation.
Take Profits (TPs) were set using standard Deep Crab targets, based on FIB retracements from A to D:
✅ TP1 at 0.382
✅ TP2 at 0.618
✅ TP3 at 0.786
✅ TRADE OUTCOME:
Entry was cleanly triggered and the price followed through as expected.
All three profit levels were successfully hit:
✅ TP1
✅ TP2
✅ TP3
We secured an impressive 13R on this single BTCUSDT trade —a solid example of what happens when Harmonics and Smart Money Concepts are aligned.
💬 Your Turn:
Did you take this BTC trade using a different strategy?
Or did you spot the pattern and enter alongside me?
Drop your thoughts and experiences below this analysis—let’s learn together!

Mastering Fair Value Gaps (FVG) - How to use them in trading?In this guide, I’ll explain the concept of the Fair Value Gap (FVG), how it forms, and how you can use it to identify high-probability trading opportunities. You'll learn how to spot FVGs on a chart, understand their significance in price action, and apply a simple strategy to trade them effectively.
What will be explained:
- What is a FVG?
- How can a FVG occur?
- What is a bullish FVG?
- What is a bearish FVG?
- How to trade a FVG?
-------------------------------
What is a FVG?
A FVG is a technical concept used by traders to identify inefficiencies in price movement on a chart. The idea behind a fair value gap is that during periods of strong momentum, price can move so quickly that it leaves behind a "gap" where not all buy and sell orders were able to be executed efficiently. This gap creates an imbalance in the market, which price may later revisit in an attempt to rebalance supply and demand.
A fair value gap is typically observed within a sequence of three candles (or bars). The first candle marks the beginning of a strong move. The second candle shows a significant directional push, either bullish or bearish, often with a long body indicating strong momentum. The third candle continues in the direction of the move, opening and closing beyond the range of the first candle. The fair value gap itself is defined by the price range between the high of the first candle and the low of the third candle (in the case of a bullish move), or between the low of the first candle and the high of the third (in a bearish move). This range represents the area of imbalance or inefficiency.
-------------------------------
How can a FVG occur?
There are several factors that can trigger a fair value gap
- Economic news and announcements
- Earnings reports
- Market sentiment
- Supply and demand imbalances
-------------------------------
What is a bullish FVG?
A bullish FVG is a specific type of price imbalance that occurs during a strong upward move in the market. It represents a zone where the price moved so aggressively to the upside that it didn’t spend time trading through a particular range, essentially skipping over it.
This gap usually forms over the course of three candles. First, a bullish candle marks the beginning of upward momentum. The second candle is also bullish and typically has a large body, indicating strong buying pressure. The third candle opens higher and continues moving upward, confirming the strength of the move. The bullish fair value gap is the price range between the high of the first candle and the low of the third candle. This area is considered an imbalance zone because the market moved too quickly for all buyers and sellers to interact at those prices.
-------------------------------
What is a bearish FVG?
A bearish FVG is a price imbalance that forms during a strong downward move in the market. It occurs when price drops so rapidly that it leaves behind a section on the chart where little to no trading activity happened.
This gap is identified using a three-candle formation. The first candle typically closes bearish or neutral, marking the start of the move. The second candle is strongly bearish, with a long body indicating aggressive selling pressure. The third candle opens lower and continues the move down. The bearish fair value gap is the price range between the low of the first candle and the high of the third candle. That range is considered the imbalance zone, where price skipped over potential trade interactions.
-------------------------------
How to trade a FVG?
To trade a FVG effectively, wait for price to retrace back into the gap after it has formed. The ideal entry point is around the 50% fill of the FVG, as this often represents a balanced level where price is likely to react.
During the retracement, it’s helpful to see if the FVG zone aligns with other key technical areas such as support or resistance levels, Fibonacci retracement levels, or dynamic indicators like moving averages. These additional confluences can strengthen the validity of the zone and increase the probability of a successful trade.
Enter the trade at the 50% level of the FVG, and place your stop loss just below the most recent swing low (for a bullish setup) or swing high (for a bearish one). From there, manage the trade according to your risk-to-reward preferences—whether that’s 1:1, 1:2, or a higher ratio depending on your strategy and market conditions.
-------------------------------
Thanks for your support.
- Make sure to follow me so you don't miss out on the next analysis!
- Drop a like and leave a comment!

GOLD: The Timeless Asset Every Trader Should Master"Empires rise, currencies fall—but Gold never forgets its value."
From ancient temples to central bank vaults, Gold has stood as a pillar of wealth and power. But beyond its glitter lies a dynamic market driven by tradition, emotion, and macroeconomic forces. Today, we explore Gold's deeper story, from its roots to its geopolitical and cultural drivers and why it continues to be one of the most fascinating instruments in the financial world.
🏛️ A Brief History: When Gold Became a Tradable Asset
Gold has been used as money for over 5,000 years, but it became a formal trading instrument in modern financial markets in the 1970s, after the collapse of the Bretton Woods system. This shift allowed Gold to float freely against the US Dollar, opening it up to speculative trading.
Initially dominated by institutions, Gold became accessible to retail traders in the early 2000s, thanks to:
The rise of online trading platforms
The introduction of CFDs (Contracts for Difference)
Brokerages offering leveraged accounts with low capital requirements
📈 Gold was then added to TradingView, empowering global traders with institutional-grade tools to analyze and trade Gold markets in real time.
📍 COMEX vs Spot Gold: What’s the Difference?
Many traders don’t realize they’re looking at two closely related—but different—Gold markets.
🔍 Why it matters:
Spot Gold is what most retail traders buy and sell via brokers. COMEX Gold futures show institutional positioning and often lead the trend during high-volume sessions.
🔁 Pro Tip: Spot Gold (XAU/USD) and COMEX Futures (GC1!) typically move together, but watching both can help spot:
Volume spikes before big moves
Divergences in short-term sentiment
Roll-over or expiration volatility
🧭 Consider charting both together to better understand market dynamics across retail and institutional flows.
China & India: The Powerhouses Behind Physical Demand
Together, India and China account for over 50% of global consumer Gold demand, making their influence enormous, especially during cultural and seasonal peaks.
India: Gold as Religion, Wealth & Legacy
In India, Gold is more than an investment, it’s sacred. It plays a central role in:
Weddings: Millions of marriages occur annually, with families gifting large amounts of Gold.
Festivals: Especially Diwali and Akshaya Tritiya, where buying Gold is seen as auspicious.
Dowries & inheritance: Gold is passed down across generations, reinforcing cultural and financial value.
Gold demand spikes seasonally from September to February, driven by marriage season and religious celebrations, creating bullish tailwinds globally.
China: From Tradition to Strategic Reserve
China, the world’s top Gold producer, is also one of its biggest consumers. Gold plays both a traditional and tactical role:
Cultural: Common gifts for births, weddings, Lunar New Year, and other key events.
Strategic: Used to hedge wealth amid real estate slowdowns, market turbulence, or strict capital controls.
Demand peaks during Lunar New Year (Jan–Feb) and Golden Week (Oct)—key seasonal catalysts in Gold’s annual cycle.
🌍 Seasonal Demand Windows: The Cultural Gold Cycle
Gold’s demand is deeply seasonal due to traditions in China and India:
Jan–Feb: Chinese New Year buying
Aug–Oct: Indian festival prep + wedding season
Nov: Diwali in India
Dec: Global rebalancing, safe-haven inflows
These cycles often precede bullish waves in price, even before macroeconomic news hits the wires.
🧭 What Moves Gold? (Beyond Culture)
Cultural demand isn’t the only force. Gold is influenced by:
📉 Interest rates & inflation
💵 US Dollar strength/weakness
🌍 Geopolitical tension
🏦 Central bank buying (especially from Russia, China, and Turkey)
These macro drivers make Gold both a defensive hedge and a speculative asset.
🏦 Top Global Gold Reserves (2025)
Central banks continue to accumulate Gold, a clear sign of long-term strategic value amid de-dollarization and rising debt.
📈 Long-Term Bullish Outlook: The Golden Momentum
Zooming out on the monthly chart, Gold remains in a long-term bullish momentum considering the factors we have just discussed with continued demand from both East and West.
🔮 Many analysts project a bullish long term continuation, especially if inflation resurges or geopolitical risk intensifies.
🔚 Final Thoughts
Gold is not just a metal, it’s a mirror reflecting culture, history, and human fear. As retail traders, understanding its deep-rooted demand, global influences, and institutional dynamics gives us an edge.
✅ Quick recap:
Gold trading exploded post-1970s and became retail-accessible in the 2000s.
China and India’s seasonal cycles create repeatable opportunities.
Spot vs COMEX adds clarity for traders.
The long-term trend remains bullish with macro support.
💬 How do you use seasonal demand or futures sentiment in your Gold analysis? Drop your thoughts in the comments below.

BTC Bulls vs Bears – Critical Level Tested, What’s Next?🚀📈 BTC Bulls vs Bears – Critical Level Tested, What’s Next? 🐂🐻
Hi everyone! New day, new charts – and once again, our levels played out beautifully! 🎯 The 102,777 zone was the battleground, and after nearly 40 price interactions at that level, the bulls took control. However, all is not settled yet!
We are currently observing multiple divergences across key indicators:
📉 MACD
📉 Histogram
📉 RSI
📉 MOM (Momentum)
📉 MFI
This suggests caution despite the bullish momentum. My expectation is for a retest of the 102,777 level, which remains the key decision point.
Here’s the updated probability outlook:
➡️ 65% chance we push higher toward the next target at 105,962, with sights ultimately set on 113,000.
⬅️ 35% chance we see a rejection and head lower.
Keep an eye on these key levels:
⚔️ 102,777 – The battleground (Bulls vs Bears)
📌 105,962 – Next target
🎯 113,000 – Ultimate target
Before I wrap up, even on the 8-hour chart, there are signs of divergences, so let’s stay sharp and move carefully. Step by step, we’ll navigate this market together!
One Love,
The FXPROFESSOR 💙
ps. WE ARE STAYING LONG! OK?

An Example Of How To Trade When You Live A Busy LifeIn this video, I demonstrate a swing trading approach that requires very little time in your day.
This type of trading, using limit orders, allows you to locate a strategy set-up, place your order in the market, set an alert, and then just let the market do it's thing.
I hope it's insightful!
The Meditrader

Bitcoin Bulls Aim for $102K – Breakout or Rejection Ahead?🚀📈 Bitcoin Bulls Aim for $102K – Breakout or Rejection Ahead? 🔍🧠
Good morning, good afternoon, or good evening — wherever you are in the world, Bitcoin is pumping, and that’s always a good sign for the bulls! 🐂
In my last BTC update, we anticipated a bounce from the key support zone around $93,600–$93,800, and price respected this level to the dot, rocketing upward just as expected. 🔥✅ That level acted as a strong springboard, and now BTC is climbing through a well-respected ascending channel on the 15-min chart.
📊 Key levels to watch:
Middle of the channel: ~$98,689
Top of the channel: ~$100,636
Psychological level: $100,000
Projected breakout target: $102,774 (60% probability 🚦)
Major resistance beyond: $113,000
However, there's always the alternate scenario: a 40% chance that we reject under $97,400, re-enter the lower end of the channel, and potentially drop toward $92,000 if that support fails. This would flip the bullish structure short-term — something to keep on your radar. ⚠️
This is a high-momentum situation, and I’ll be watching for confirmation of breakout or breakdown. Stay alert, keep your risk in check, and let the chart guide your trades. 📉📈
Let me know your thoughts in the comments — are we headed for $113K or due for a cooldown?
One Love,
The FXPROFESSOR 💙

Futures on CME and Launch of XpFinance DeFi PlatformOn May 7, 2025, the XRP ecosystem received two major developments that signal a new chapter in its evolution. First, the Chicago Mercantile Exchange (CME) announced the launch of futures contracts for XRP. Shortly thereafter, developers behind the XRP Ledger unveiled XpFinance — the first non-custodial lending platform built on the network. These two events are poised to reshape XRP's market perception and could attract a wave of new investment.
XRP Futures on CME: A Leap Toward Institutional Adoption
Set to go live on May 19, the new CME product will enable investors to trade XRP through regulated futures contracts. This is a major milestone. With similar contracts already in place for Bitcoin and Ethereum, XRP becomes the third digital asset to gain such legitimacy in institutional markets.
The introduction of futures means greater liquidity, risk management tools, and a clear path for hedge funds, pension managers, and banks to engage with XRP — without needing to custody the underlying token directly. Analysts anticipate that this added market structure could drive up demand, especially if the rollout is smooth and met with trading interest.
XpFinance and the XPF Token: DeFi Comes to XRP Ledger
The second big announcement came from XpFinance, a new decentralized lending protocol. What sets it apart is its non-custodial model — users can lend assets and earn interest while retaining full control of their private keys. At a time when centralized platforms are under scrutiny, this approach appeals to security-conscious users.
XpFinance is powered by a new token, XPF, which will be used for staking rewards, fee payments, and governance. The pre-sale of XPF has already begun and is generating buzz, especially among XRP community members eager to participate in the first major DeFi initiative on the ledger.
Market Outlook and Analyst Forecasts
Reactions from analysts have been positive. According to a report from DigitalMetrics, if both the CME futures and XpFinance platforms gain traction, XRP could see a sharp upward move — potentially reaching $10 by summer 2025. That would represent a fourfold increase from its current price.
However, risks remain. Ripple Labs continues to face regulatory pressure in the U.S., and crypto markets overall remain volatile. Still, the general tone has shifted. With increasing institutional interest and expanding utility, XRP appears to be entering a new phase of growth.
Conclusion
The combination of institutional infrastructure and decentralized finance innovation makes May 2025 a pivotal moment for XRP. If these initiatives succeed, XRP could transition from a mid-cap altcoin to a primary digital asset in the eyes of both institutional investors and the broader crypto community. Whether this momentum will translate into long-term market dominance remains to be seen — but the foundation is clearly being laid.

Simple Break of Structure BoS Trading Strategy Explained
One of the best and reliable strategies to trade break of structure BoS is to apply multiple time frame analysis.
In this article, I will teach you my break of structure gold forex trading strategy. You will get a complete step-by-step guide with examples.
Let's start with a quick theory and let me explain to you what is break of structure BoS in Smart Money Concept SMC trading.
In a bullish trend, break of structure BoS is an important event that signifies a continuation of an uptrend. It is based on a violation and a candle close above the level of the last higher high (HH).
After a breakout, the broken level becomes the first strong support for trend-following buying.
Check multiple examples of confirmed breaks of structure BoS on GBPNZD forex pair on a weekly time frame.
In a downtrend, Break of Structure BoS means a bearish trend continuation . Break of Structure is considered to be confirmed when a candle closes below the level of the last lower low (LL).
The broken key level becomes the closest strong support for buying.
That's the example of a healthy downtrend on USDJPY forex pair on a daily. Each break of structure BoS pushed the prices lower, providing a strong signal to sell.
What newbie traders do incorrectly, they trade break of structure without a confirmation strategy, and it leads to substantial losses.
Though GBPCHF is trading in a bullish trend and though each BoS provided a trend-following signal. The price retraced significantly lower below the broken structure before the growth resumed.
When the price retests a broken structure after BoS in a bullish trend, start lower time frame analysis.
If you identified a break of structure on a daily, analyze 4h/1h time frames.
If on a 4H, then 30/15 minutes.
After the price sets a new higher high with BoS in uptrend, it usually starts trading in a minor bearish trend on lower time frames.
With our strategy, your signal to buy will be a retest of a broken structure and a consequent bullish Change of Character CHoCH . That will provide an accurate bullish signal.
In a bearish trend, analyze the lower time frames after a retest of a broken structure. Your signal to sell will be a bearish Change of Character CHoCH.
Look at a price action on EURCHF on a daily.
We see a strong bullish trend and a confirmed Break of Structure BoS.
According to the rules of our trading strategy, we start analyzing 4h/1h time frames after a retest of a broken level of the last Higher High.
Our signal to buy is an intraday bullish CHoCH. We open a long trade after that with the stop loss below the intraday lows and take profit being a current high.
That's how simple this strategy is.
Multiple time frame analysis provides the extra level of security.
Strong lower time frame confirmation substantially increases the win ratio of a trading setup.
❤️Please, support my work with like, thank you!❤️
I am part of Trade Nation's Influencer program and receive a monthly fee for using their TradingView charts in my analysis.

Ultimate Guide to Master CISDCISD stands for Consolidation, Inducement, Stop Hunt, Displacement. It’s a simple, repeatable structure that shows how smart money sets up traps in the market to grab liquidity and then make a clean move in the opposite direction.
If you’re serious about trading the ICT style, this is one of the most useful frameworks to learn. It helps you avoid chasing bad breakouts and teaches you to wait for real setups that come after stop hunts and proper market structure shifts.
But there’s one rule that’s non-negotiable — a CISD setup is only valid after a liquidity sweep. If the market hasn’t taken out a clear high or low where stops are sitting, then the rest of the model doesn’t mean anything. No sweep, no trade.
1. Start With the Liquidity Sweep
Everything begins with the liquidity grab. If price hasn’t taken out a high or low where stops are stacked, you should walk away from the setup. Don’t try to front-run a move before smart money has done its job.
The liquidity sweep is what gives the rest of the move power. That’s when price runs through obvious levels, swing highs, swing lows, the Asian range, New York session highs or lows and hits stop losses. Those stops give smart money fuel to enter in the opposite direction.
When you’re watching the market, ask yourself this:
"Who just got stopped out?"
If you can’t answer that, then it’s not a sweep. And if it’s not a sweep, it’s not a CISD.
2. Consolidation — Where Liquidity Builds
This is the first part of the structure. Price starts to move sideways in a tight range, usually during Asian session or during parts of London where volume is low. It can last for hours or even across sessions.
The key here is to understand what’s happening. Traders are placing buys above the highs and sells below the lows. Liquidity is building on both sides. It’s a trap being set. Retail traders are expecting a breakout, but smart money is waiting to use that breakout to their advantage.
Your job in this phase is to identify the range and mark out the highs and lows. That’s where stops will be sitting. You’re not looking to trade during this phase. You’re watching and planning
3. Inducement (sweep)— Fake Break to Trap Traders
After the range is set, price gives a small push out of the range just enough to get people to commit. This is the inducement. It’s the bait.
Let’s say the range high is being tested. Price breaks just above it, traders think it’s a breakout, and they go long. Maybe it holds for a couple of minutes, even gives a small push in their favor. But then it rolls over. That’s the trap. Now those traders are caught, and their stops are sitting below.
Sometimes the inducement comes before the real sweep. Other times, the inducement is the sweep. What matters is that traders have been lured into bad positions and their stops are exposed.
As a trader, your job is not to take the bait. Watch how price reacts to these fake moves. Often, they come with weak volume or are followed by an immediate sharp reversal.
4. Stop Hunt — The Sweep That Validates the Setup
This is where the real move starts to form. Price aggressively runs through the level that holds liquidity, usually below the low or above the high you marked earlier.
This is when smart money takes out the traders who were induced during the fake move. Their stops get hit, and that gives institutions the volume they need to get into the opposite side.
You should be actively watching for a reaction here. Do you see rejection? Does the candle close with a strong wick? Are there signs of absorption or order flow flipping?
This is your validation point. Once price sweeps liquidity and starts to reject the level, that’s your cue to get ready for the next part, the actual shift.
5. Displacement — The Real Move Begins
Once the sweep happens, price doesn’t just drift, it snaps back hard. This is called displacement.
Displacement is a sharp, clean move in the opposite direction of the stop hunt. This is when market structure breaks, momentum shifts, and a fair value gap usually forms.
This is your confirmation that the setup is live. The sweep happened, smart money entered, and now the market is moving with intent.
You don’t want to chase the displacement candle itself. Instead, wait for the retrace. Look for price to come back into the fair value gap or an order block left behind by the impulse. That’s your entry point.
Make sure:
Structure is broken in your direction
The move away is impulsive, not choppy
You’re not forcing an entry on a weak pullback
This is the only part of CISD where you actually take the trade. Everything else is just setup.
How to Manage Risk and Entries
Once you’ve got a valid setup, here’s how to manage it:
Entry: Enter on the CISD or wait for the pullback into the fair value gap or order block. Enter on the reaction or confirmation.
Stop Loss: Place it just past the low or high that got swept. If you’re long, your stop goes below the stop hunt candle. If you’re short, it goes above.
Take Profit: Target the next liquidity level. That could be the other side of the range, a swing high or low, or an inefficiency in price.
You can scale out if price approaches a session high or low, or hold for a full range expansion depending on the session.
Final Thoughts
The CISD model works because it’s built on how the market actually moves, not indicators, not random patterns, but liquidity.
Don’t jump in early. Don’t guess. Wait for the sweep. Wait for the displacement. That’s where the edge is.
Once you get used to watching this play out in real time, you’ll start to see it everywhere. It’s in Forex, crypto, indices, any market that runs on liquidity.
Stick to the rules. Let the model do its job. And remember: no sweep, no setup!
___________________________________
Thanks for your support!
If you found this guide helpful or learned something new, drop a like 👍 and leave a comment, I’d love to hear your thoughts! 🚀
Make sure to follow me for more price action insights, free indicators, and trading strategies. Let’s grow and trade smarter together! 📈

What Is Random Walk Theory and Its Implications in Trading? What Is Random Walk Theory and Its Implications in Trading?
Random walk theory argues that market prices move erratic, making it difficult to analyse past data for an advantage. It suggests that technical and fundamental analysis provide little to no edge, as prices instantly reflect all available information. While some traders embrace this idea, others challenge it. This article explores the theory, its implications, criticisms, and what it means for traders navigating financial markets.
What Is Random Walk Theory?
Random walk theory reflects the idea that financial markets move erratic, making it impossible to analyse past price data for an advantage. The theory argues that price changes are random and independent, meaning past movements don’t influence future direction. This challenges both technical and fundamental analysis, arguing traders who attempt to time the market are essentially guessing.
The concept was first introduced by Maurice Kendall in 1953, who found no meaningful patterns in stock prices. Later, Burton Malkiel popularised it in A Random Walk Down Wall Street (1973), arguing that a blindfolded monkey throwing darts at a stock list would perform as well as professional traders. The underlying principle is that markets are efficient, instantly reflecting all available information.
The theory states that prices truly follow a random path, so a trader analysing charts or company reports has no statistical edge. It’s like flipping a coin—the next move is unrelated to the last. This has major implications: active trading strategies become questionable, and passive investing (e.g., index funds) may be a more logical approach.
However, while randomness can explain short-term price movements, longer-term trends still emerge. Factors like liquidity, institutional flows, and investor psychology create periods where price action deviates from pure randomness. This is where the debate arises—are markets entirely random, or do trends exist that skilled traders can take advantage of?
Understanding random walk theory helps frame this debate, offering insight into why some traders dismiss traditional analysis while others continue searching for patterns in price action.
Theoretical Foundations and Key Assumptions
The random walk hypothesis is based on mathematical models and probability, arguing that financial markets follow a stochastic process—where future price movements are independent of past trends. It builds on several key principles that shape how economists and traders view market efficiency and price behaviour.
Market Efficiency and Information Absorption
A core assumption of random walk models is that markets are efficient, meaning all available information is already reflected in asset prices. If new data emerges, prices adjust instantly, making it impossible to gain an edge through analysis. This aligns with the Efficient Market Hypothesis (EMH), which classifies efficiency into three forms:
- Weak form: Prices already reflect past movements, rendering technical analysis ineffective.
- Semi-strong form: Fundamental data (e.g., earnings reports) is priced in immediately, limiting the usefulness of research.
- Strong form: Even insider information is priced in, meaning no trader has an advantage.
Brownian Motion and Stochastic Processes
The theory borrows from Brownian motion, a model describing random movement, often used in random walk algorithms to simulate stock price fluctuations. Prices are treated as a series of independent events, much like molecules colliding in a gas.
No Clear Patterns
If prices truly follow a random walk, trends and cycles do not exist in a statistically significant way. This challenges traders who attempt to use historical data to analyse future movements.
Implications for Traders and Investors
If random walks in trading are truly the norm, then analysing market movements using historical price data is no more effective than flipping a coin. This has significant implications for both traders and long-term investors.
For traders relying on technical analysis, random walk theory presents a major problem. If price changes are independent, then tools like support and resistance, trendlines, and moving averages hold no real value. The same applies to fundamental analysis—if all available information is instantly priced in, then even detailed financial research doesn’t offer an edge.
This would mean day traders and swing traders aren’t consistently able to generate higher returns than the broader market. It’s why proponents of the theory often argue that attempting to time the market is a losing battle in the long run.
However, many supporters of the random walk theory advocate for passive investing, arguing that since, for example, individual stock movements are erratic, holding a diversified index fund is a more rational approach. Instead of trying to outperform the market, investors simply track it, reducing costs associated with frequent trading.
Criticism and Counterarguments
While random walk theory argues that market movements are independent, real-world trading data argues that markets are not entirely random. Critics point to patterns, inefficiencies, and the effectiveness of certain trading strategies as evidence that price action isn’t purely a coin flip.
Market Inefficiencies Exist
One of the biggest challenges to random walk theory is that markets display recurring inefficiencies. Certain price behaviours, like momentum effects, mean reversion, and seasonal trends, suggest that past movements do have an impact on future price action. For example:
- Momentum strategies: Studies show that assets that have performed well over the past three to twelve months tend to continue in the same direction. If price action were purely random, these trends wouldn’t exist.
- Earnings reactions: Stock prices often drift in the direction of an earnings surprise for weeks after the announcement. If markets were perfectly efficient, all adjustments would happen instantly.
Real Results
Random walk theory suggests that no trader can systematically outperform the market over time. Yet, some fund managers and proprietary traders have done exactly that. Warren Buffett’s long-term track record is often cited as evidence that skill, not just luck, plays a role in investing and trading. Similarly, hedge funds employing quantitative strategies have consistently generated returns, challenging the idea that price movements are entirely random.
The Adaptive Markets Hypothesis
A more flexible alternative is Andrew Lo’s Adaptive Markets Hypothesis, which seeks to reconcile the EMH’s claim that markets are rational and efficient with behavioural economists’ argument that markets are, in reality, irrational and inefficient. Instead of being entirely random, markets evolve based on participants’ actions, allowing patterns to emerge.
While random walk theory provides a useful framework, real market behaviour often deviates from its assumptions, leaving room for traders to find potential opportunities beyond pure randomness.
Practical Considerations for Traders
Even if markets exhibit randomness in the short term, traders still need a structured approach to analysing price action and managing risk. While random walk theory challenges traditional methods, it doesn’t mean traders should abandon analysis altogether. Instead, it highlights the importance of probabilistic thinking, risk control, and understanding market conditions.
Short-Term vs. Long-Term Price Behaviour
Markets may behave randomly on a daily or weekly basis, but longer-term trends can emerge due to liquidity shifts, institutional positioning, and macroeconomic factors. Traders focusing on short-term moves often work with probabilities, using statistical models and historical tendencies to assess risk and potential trade opportunities.
Risk Management in an Uncertain Market
If price movements are largely unpredictable, risk control becomes even more important. Traders typically limit their exposure using stop losses, position sizing, and diversification to avoid being caught on the wrong side of market volatility. Instead of focusing on certainty, they manage the probability of different outcomes.
The Role of Quantitative Strategies
While traditional chart patterns may be questioned under random walk theory, quantitative and algorithmic strategies analyse large datasets to identify inefficiencies. High-frequency trading firms, for example, exploit microsecond price discrepancies that aren’t visible to the human eye.
Rather than proving whether markets are fully random, traders adapt by testing, refining, and adjusting their strategies based on what works in real conditions. The most experienced traders accept uncertainty but structure their approach around probabilities and risk management.
The Bottom Line
Random walk theory challenges the idea that past price movements provide an edge, arguing that markets move erratically. While some traders accept this and focus on passive investing, others analyse inefficiencies to find potential opportunities.
FAQ
What Is the Random Walk Theory?
Random walk theory suggests that asset prices move unpredictably, with past movements having no influence on future direction. It argues that markets are efficient, meaning all available information is instantly reflected in prices. This challenges the idea that traders can consistently outperform the market using technical or fundamental analysis.
What Is the Meaning of the Random Walk Fallacy?
Critics of the theory argue that the random walk fallacy is the mistaken belief that financial markets move in a completely random manner, disregarding factors such as fundamental analysis, technical patterns, and behavioural finance that can influence price trends. This misconception may cause traders to overlook potential opportunities for strategic analysis.
What Are the Criticisms of Random Walk Theory?
Critics argue that markets display patterns, inefficiencies, and behavioural biases that contradict pure randomness. Studies on momentum, mean reversion and liquidity effects show that past price movements do influence future trends.
This article represents the opinion of the Companies operating under the FXOpen brand only. It is not to be construed as an offer, solicitation, or recommendation with respect to products and services provided by the Companies operating under the FXOpen brand, nor is it to be considered financial advice.

Japanese Yen Pairs: A Short Guide on Relative StrengthIndicators are a popular choice among many traders, and they certainly have their place in my own toolkit. But sometimes it is best to simply look the price to gauge strength. And doing so, it can help us scenario plan for future events. After I take a quick look at Japanese yen pairs, I wrap up on my preferred setup.
Matt Simpson, Market Analyst at Forex.com and City Index

Trading Strategy and CEX Screen
Hello, traders.
If you "Follow", you can always get new information quickly.
Please click "Boost" as well.
Have a nice day today.
-------------------------------------
CEX(Centralized Exchange): Centralized Exchange
DEX(Decentralized Exchange): Decentralized Exchange
As coin futures trading becomes active, I think they started classifying the coin futures charts of CEX exchanges.
-
Tradingview supports various screeners.
There are several screeners in the menu at the bottom, so check them out.
-
As the coin market grows, it is being classified into various themes.
I think this movement means that it is evolving into a form similar to the existing stock market.
If this classification continues to be segmented, it is likely that individual investors will eventually find it increasingly difficult to make profits.
Therefore, in order to adapt to these changes, your investment style, that is, your trading strategy, must be clear.
The trading strategy must be clear on 1. Investment period, 2. Investment size, 3. Trading method and profit realization method.
The above 1-3 must be clear.
You must classify the coin (token) you want to trade by investment period, and determine the investment size according to the investment period.
And, you must proceed with the transaction by determining the trading method and profit realization method accordingly.
-
To create a trading method, you must check whether there is support near the HA-Low and HA-High indicators and create a trading method accordingly.
Basically, when the HA-Low indicator rises, it is a buying period, and when the HA-High indicator is met, it is a selling period.
In most cases, trading occurs in the HA-Low ~ HA-High indicator range as above.
If it is supported by the HA-High indicator and rises, it will show a stepwise upward trend, and if it is resisted by the HA-Low indicator and falls, it will show a stepwise downward trend.
-
If you can trade in decimals like the coin market, you can set a different profit realization method.
Basically, you will sell the number of coins (tokens) you purchased and earn cash profits.
However, if you can trade in decimals, you can increase the number of coins (tokens) by selling the amount of the purchase principal.
In this way, you can increase the number of coins (tokens) corresponding to the profit and earn large profits in the mid- to long-term.
You can decide whether to earn cash profits right now or increase the number of coins (tokens) for the future depending on your investment style.
For example, I think it is a good idea to increase the number of coins (tokens) corresponding to the profit for coins (tokens) that can be held for the long term, such as BTC and ETH.
Therefore, you should think about which coin (token) to hold for the long term and decide on the profit realization method accordingly.
This method can reduce the pressure on funds even if the trading period is long because the investment money is rotated.
-
Thank you for reading to the end.
I hope you have a successful transaction.
--------------------------------------------------

trading supply and demand with a little touch of my strategythis is a 2 week trade, using just supply and demand and my confirmation entry, tell me what you thing.
