Alma SD SuperTrend | OquantAlma SD SuperTrend | Oquant
The "Alma SD SuperTrend | Oquant" is a trend-following indicator that integrates the Arnaud Legoux Moving Average (ALMA) with a SuperTrend calculation based on standard deviation (SD). Designed to quickly identify and follow market trends while reducing noise, this script provides buy and sell signals for traders across various assets and timeframes.
This script offers a unique approach by combining ALMA with a SuperTrend framework that uses standard deviation instead of the traditional Average True Range (ATR). This implementation focuses on fast trend detection with minimized noise, making it suitable for trend-following or swing trading strategies. The script’s customizable parameters allow traders to adapt it to their preferred trading style.
How It Works
Arnaud Legoux Moving Average (ALMA): ALMA is an advanced moving average that applies a Gaussian filter to smooth price data, reducing market noise while preserving responsiveness to price changes. It uses three parameters:
Length: Sets the lookback period for smoothing. Longer periods produce smoother results.
Offset: Shifts the moving average toward recent prices. Higher offsets emphasize newer data for faster trend detection.
Sigma controls the smoothness and lag of the Alma by adjusting the spread of the Gaussian distribution used in the calculation.
Standard Deviation (SD) Calculation: The script calculates the standard deviation of the price over a specified period to measure volatility. SD measures how much the prices deviate from its mean, offering a statistical perspective on market volatility. This is used to create dynamic upper and lower bands around the ALMA line, adjusted by a user-defined factor. The bands expand in volatile markets and contract in stable conditions, helping in trend detection.
SuperTrend Logic: The script generates a SuperTrend line that dynamically tracks market trends by switching between upper and lower volatility bands based on price movement. Here's how it works:
The SuperTrend line is calculated using the ALMA (Arnaud Legoux Moving Average) as a baseline, with upper and lower bands created by adding and subtracting a multiple(Factor) of the standard deviation (SD) from the ALMA.
When the price moves above the upper band, the SuperTrend line shifts to the lower band, indicating a bullish trend (potential buy signal).
When the price falls below the lower band, the SuperTrend line switches to the upper band, signaling a bearish trend (potential sell signal).
To avoid quick, unreliable changes, this script intelligently adjusts the SuperTrend bands for stability. While the SuperTrend line dynamically follows market movements, it's designed to hold at its previous level if the price doesn't cross a band or confirm a new trend direction. This approach ensures the SuperTrend quickly identifies and follows genuine market trends, providing clear signals while effectively reducing false alerts from short-term price swings.
Differences from Traditional SuperTrend:
Baseline: The traditional SuperTrend typically uses a hl2((high + low)/2)as its baseline, while this script employs ALMA for a smoother, noise-filtered trend foundation.
Volatility Measure: Instead of ATR, this script uses standard deviation to calculate the bands. Standard deviation measures how much the prices vary or spread out from its mean.
Visualization: The script plots the SuperTrend line, colors candles to match the trend, and fills the area between the price and the SuperTrend line for visual clarity, helping traders quickly identify trend direction and strength (green for bullish, purple for bearish).
How to Use It
Add to Chart: Apply the indicator to any market and timeframe.
Interpret Signals:
Green Line and Candles: Bullish trend (price above the SuperTrend line). Consider long entries.
Purple Line and Candles: Bearish trend (price below the SuperTrend line). Consider short entries.
Filled Area: The shaded area between price and the SuperTrend line highlights trend direction(green for bullish, purple for bearish).
Adjust Inputs:
Source: Select the price data to use (e.g., close, open, high, low).
Factor: Adjusts band width. Higher values widen bands, reducing sensitivity.
SD Length: Period for calculating standard deviation. Longer periods smooth volatility.
ALMA Length: Period for ALMA. Longer periods increase smoothness.
Alma Offset: Shift the moving average toward recent or older prices. Higher offsets emphasize newer data for faster trend detection.
ALMA Sigma control the smoothness and lag of the Alma by adjusting the spread of the Gaussian distribution used in the calculation.
Alerts
This indicator includes optional built-in alert conditions that notify you when the signal crosses above 0 (long signal, price above upper band) or below 0 (short signal, price below lower band). Enable these alerts to get timely updates on potential trend shifts without constantly monitoring the chart.
⚠️ Disclaimer: This indicator is intended for educational and informational purposes only. Trading/investing involves risk, and past performance does not guarantee future results. Always test and evaluate indicators/strategies before applying them in live markets. Use at your own risk.
Indicators and strategies

London Reversal + LazyAlgoLondon Reversal Strategy with FS Entry
This script detects trend reversals during the London session, following the Asian session, using technical signals based on moving averages, Asian range breakouts, and multi-timeframe trend filters. It includes a system of visual signals and alerts, with customizable Stop Loss and Take Profit levels.

GOLD Auto-Alert Strategy [Enhanced+Signals+UT Bot]New Version The Indicator
✅ BUY Signal Triggers Only If:
UT Buy signal flips (from down to up)
ADX > Threshold → market has strength
RSI is outside the 40–60 range
Volume is spiking above 20-bar average × 1.2
EMA Fast > EMA Slow → uptrend confirmed
Close > EMA Fast → price above short-term trend
Bullish Engulfing candle
🔻 SELL Signal Triggers Only If:
UT Sell signal flips (from up to down)
ADX > Threshold → market has strength
RSI is outside the 40–60 range
Volume is spiking above average
EMA Fast < EMA Slow → downtrend confirmed
Close < EMA Fast → bearish structure
Bearish Engulfing candle

Checklist Dashboard Table# Checklist Dashboard Table – ICT/SMC Trading Helper
Overview
The “Checklist Dashboard Table” is a TradingView indicator designed to help traders structure, organize, and validate their market analyses following the ICT/SMC (Inner Circle Trader / Smart Money Concepts) methodology. It provides a visual and interactive checklist directly on your chart, ensuring you never miss a crucial step in your decision-making process.
Key Features
- Visual Checklist : All your trading criteria are displayed as color-coded checkboxes (green for validated, red for not validated), making your analysis process both clear and efficient.
- Clear Separation Between Analysis and Confirmations :
- Analysis : Reminders for your routine, such as timeframe selection (M3 to H4), trend analysis via RSI, and identification of key zones (Midnight Open, SSL/BSL, Asian High/Low).
- Confirmations : Six customizable criteria to check off as you validate your setup (clear trend, OB + FVG, OTE zone, Premium/Discount, R/R > 1:2, CBDR/Midnight).
- Personal Notes Section : Keep your trade entries, observations, or comments in a dedicated field in the indicator’s settings. Your notes are displayed right in the checklist for quick reference and journaling.
- Elegant and Compact Display : The table is styled for readability and can be positioned anywhere on your chart.
- Quick Customization : Instantly update any criterion or your personal notes via the script settings.
How to Use
1. Add the indicator to your chart.
2. Review the “Analysis” section as your pre-trade routine reminder.
3. Check off the “Confirmations” criteria as you validate your entry strategy.
4. Write your trade notes or comments in the provided notes section.
5. Use the checklist to reinforce discipline and repeatability in your trading.
Why Use This Checklist?
- Prevents you from skipping important steps in your analysis.
- Reinforces trading discipline and consistency.
- Allows you to document and review your trade decisions for ongoing improvement.
Who Is It For?
Perfect for ICT/SMC traders, but also valuable for anyone looking to organize and systematize their trading process.
Happy trading!

Useful Open Price Lines - Multi-Timeframe SupportDisplay important opening price levels on your chart with this comprehensive indicator.
KEY FEATURES:
✓ Track up to 6 different opening prices simultaneously
✓ Support for intraday time-based opens (any hour:minute)
✓ Higher timeframe opens: Daily, Weekly, Monthly, Quarterly, Semi-Annual, Yearly
✓ Automatic line extension with customizable cutoff
✓ Clean chart option - hide previous day's lines
✓ Full timezone support for global markets
✓ Customizable colors, labels, and line styles
USE CASES:
- Day traders: Track key session opens (Asian, London, NY)
- Swing traders: Monitor weekly and monthly opens
- Position traders: Track quarterly and yearly opens
- Multi-timeframe analysis: See all key levels at once
CUSTOMIZATION:
- Choose any time for intraday opens (00:00 - 23:00)
- Select from multiple timeframes (D, W, M, 3M, 6M, 12M)
- Customize labels, colors, and line styles
- Adjust label offset and size
- Set line extension cutoff time
The indicator is optimized for performance and works smoothly on all timeframes.

Fibonacci retracementHi all!
This indicator will show you the most recent Fibonacci retracement in the current trend. So if the trend is bullish the Fibonacci retracement will be drawn from swing low to high and from swing high to low in a bearish trend.
The uniqueness in this script lies in the adaptation to trend. To only plot the Fibonacci retracements according to the current market trend.
The trend is determined through break of structures (BOS) and change of characters (CHoCH). A change of character can be of type change of character plus (with a failed swing) and will then be shown as CHoCH+. This is possible through my library 'MarketStructure' (). It only uses break of structures and change of characters to be able to determine the trend, if you want a more detailed picture of the market structure you can use my script 'Market structure' ().
History and what to look for
Fibonacci retracement levels are used by many traders and are levels that are not Fibonacci sequence numbers themselves but they deriver from them. Some examples are:
23,6% - Divide a number by one three places ahead (e.g. 13/55)
38,2% - Divide a number by the one two places ahead (e.g. 21/55)
50% - Not from the Fibonacci sequence, but it's a number that price has reacted from in the past. Markets tend to retrace half a move before continuing
61,8% - The "golden retracement level". It derives from the "golden ratio" and is a core component of the Fibonacci sequence. The further you go in the Fibonacci sequence the preceding number divided by the current number will get closer and closer to this "golden ratio". This level is considered the most important Fibonacci retracement level by many traders
78,6% - Square root of 61.8%. This is often considered a deep correction (but not a trend reversal) and are often used for late entries
These levels are considered "key" and most significant. You want to look for a retracement of the price (down in a bullish trend and up in a bearish trend) to give you good entries.
Settings
For the trend you can set the pivot/swing lengths (right and left) and use the checkbox if you want these pivots to have labels. This can be done in the 'Market strucure' section.
In the 'Fibonacci retracement' section there is settings for the actual Fibonacci retracement. You can enable the trendline, set the color and the style of it. You can select which levels that should be shown by the indicator. There are 11 levels enabled by default, they are; 0-4.236. All settings in this section tries to be as similar to the "Fib Retracement" tool in Tradingview. You can also select the style of these lines (solid, dashed or dotted) and if you want them to extend to the right or not.
After this you can select if the Fibonacci retracement should be reversed or not, if prices should be displayed, if levels should be displayed and if to show the decimal levels or percentages and lastly the font size of these labels.
All defaults are based on the "Fib Retracement" tool by Tradingview.
Visualization
This indicator aims to be as visually similar to the default ("Fib Retracement") tool here on Tradingview. It will plot the Fibonacci retracement (called Auto Fibonacci/Auto fib) according to the trend from the library 'MarketStrucure'. The big differences from the "Fib Retracement" tool by Tradingview is that it's automatic (that adapts to trend), the market structure is visualized through lines and labels (showing 'BOS' for break of structures and 'CHoCH'/'CHoCH+' for change of characters) and that the labels showing information about the levels are positioned to be highly visible (left if <50% otherwise right if in a bullish trend, vice versa in a bearish trend or if reversed).
Don't hesitate if you have any feedback or nice feature suggestions!
Best of trading luck!

Capitalife IndexCapitalife Index
Jahres Rendite seit 2008 basierend auf Backtesting & Live Ergebnisse

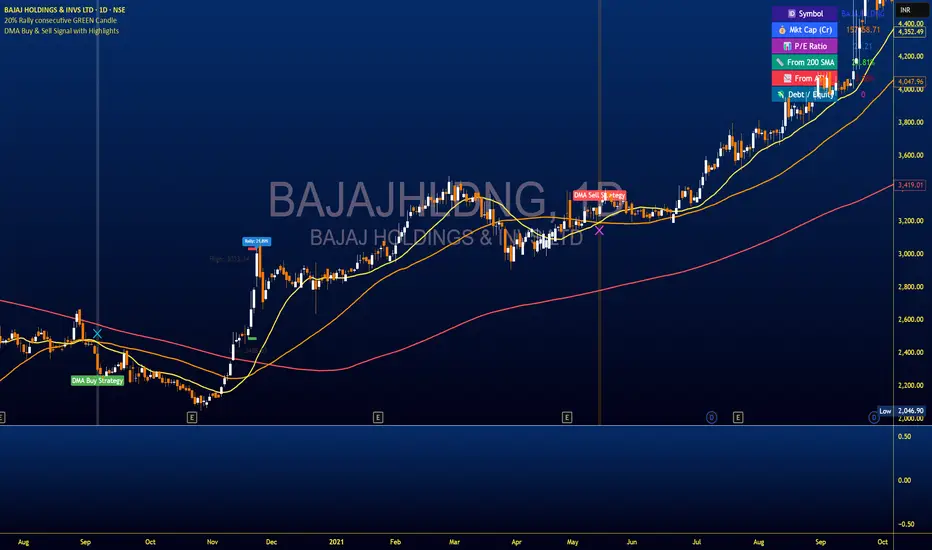
DMA Buy & Sell Signal with AlertsThis script identifies **BUY** signals when the 20 DMA crosses **below** the 50 DMA, with the alignment: `200 DMA > 50 DMA > 20 DMA > Price`.
It also plots **SELL** signals when the 20 DMA crosses **above** the 50 DMA, with the alignment: `Price > 20 DMA > 50 DMA > 200 DMA`.
Each signal is plotted on the chart with green "BUY" and red "SELL" labels.
The script includes alert conditions for both signals.
It uses simple moving averages (SMA) of 20, 50, and 200 periods.
Manipulation Candle SignalsManipulation Candle signal. Good signal to be aware when there is a liquidity sweep from the previous candle high or low, and a continuation in the trend. Most recomended in 30 min and 1HR time frame for day trade

Supply/Demand Market Structure (SMA Multi-Timeframe)Supply/Demand Based Market Structure
Structure + Order Blocks from Synthetic SMA Candles
Overview:
The SMA Supply/Demand Market Structure indicator combines market structure analysis with supply/demand logic, powered by SMA-based synthetic candles . Instead of relying on raw candle data, this tool generates smoothed higher-timeframe candles using simple moving averages to identify more stable zones and cleaner structure shifts.
It detects bullish and bearish breaks of structure (BoS) , highlights swing points like HH, HL, LH, LL , and plots institutional-style supply and demand zones formed from aggressive rallies or drops. The result is a precise and noise-filtered view of market intent, perfect for trend-following or smart money strategies.
How It Works:
- Synthetic candles are created using SMA of OHLC values on your selected timeframe (HTF).
- A bullish break occurs when price closes above the high of the last bearish synthetic candle.
- A bearish break occurs when price closes below the low of the last bullish synthetic candle.
- Upon break confirmation:
- A demand zone is drawn using the last bearish candle.
- A supply zone is drawn using the last bullish candle.
- Each zone is extended forward for a user-defined number of bars and optionally deleted upon mitigation.
- Zigzag-based internal structure connects valid swing points and classifies them as HH, HL, LH, LL , including Liquidity Sweeps (LS) .
- BoS levels are highlighted with lines that automatically reset when new structure forms.
Key Features:
- Synthetic SMA Candles : Smooth and reliable structure from average-based HTF candles
- Break Modes : Choose between raw HTF closes or SMA closes for break logic
- Custom Timeframe Selection : Analyze structure across any HTF you choose
- Dynamic Supply/Demand Zones : Auto-plot boxes from valid rallies/drops
- Mitigation Detection : Optionally fade or delete zones when price trades through
- Zigzag Structure Mapping : Automatically connect structural highs/lows
- BoS Detection : Real-time breakout of swing points with visual confirmation
- Smart Labels : Marks HH, HL, LH, LL, and LS directly on the chart
- Multi-timeframe Alert System : Notify for all structural changes, BoS, and new zones
How to Use:
- Set your desired HTF and SMA Length for synthetic candle smoothing.
- Use SMA=1 for raw candles
- Select a Break Mode :
- Raw Close : Uses standard HTF close values
- SMA Close : Uses smoothed closes from SMA
- Watch for bullish or bearish breaks — zones are plotted when price confirms breakout structure.
- Use demand zones as long entry areas and supply zones as short setups on retests.
- Rely on internal shifts and zigzag swings to monitor structure continuity.
- Enable alerts for swing formations, BoS, and liquidity sweeps to trade hands-free.
Recommended Strategies:
- Smart Money & ICT Models : Use synthetic demand/supply + BoS for mitigation or continuation plays
- Swing Trading : Align with higher timeframe structure and use zones for entry triggers
- Trend Trading : Confirm structure alignment and wait for pullbacks into zones
- Reversal Entries : Trade structure breaks when zones fail and a BoS confirms the shift
Customization Options:
- Timeframe input for custom HTF control
- SMA Length to adjust candle smoothing
- Zone Style : Control zone color, transparency, and duration
- Structure Display : Toggle swing labels and zigzag visuals
- Alert Mode : Choose between LTF, MTF, or HTF alerts
Summary:
SMA Supply/Demand Market Structure provides a clean, flexible view of price structure and institutional intent by fusing market structure with SMA-based synthetic candles. It’s ideal for anyone seeking reduced noise, visually guided entries, and rule-based trading based on structural shifts and real-time demand/supply dynamics.

Gabriel's Relative Strength IndexGabriel’s RSI—The Reinvention of Relative Strength
Not your average RSI.
This is a fully reengineered Relative Strength Index that merges the power of advanced signal processing, adaptive smoothing, volume dynamics, and intelligent divergence detection into a single, modular toolkit designed for precision trading across all markets.
Whether you’re scalping crypto, swing trading equities, or dissecting futures contracts—Gabriel’s RSI adapts to your strategy with unrivaled control and clarity.
⚙️ 1. RSI Settings
RSI Length (Jurik): Set to 51 by default to mimic a 21-period standard RSI when Jurik smoothing is applied. Adjust lower (e.g., 22) to mimic a 9-period RSI. 32 would be almost ~14, 13.33 RSI.
RSI Source: The default is hlc3 for smoother RSI. Can be changed to any price-based series (close, open, etc.) for customization.
📡 VIX-Aware: Automatically switches to high/low/close during VIX spikes using a custom Z-score model if toggled. (I backtested it, and it catches bottoms better.) 📡
🎯 2. RSI Smoothing Options
MA Type: Smoothing applies to both RSI and its MA overlay simultaneously. I used to use the 56 EMA RSI, and it works well too.
Options: JMA, T3, Kalman, Laguerre, Super Smoother, ALMA, VWMA, LSMA, etc.
JMA: Best for adaptive recursive smoothing. A power of 2 and a phase of 50 are used.
T3: Smooth and lag-reduced, suitable for trend detection. The alpha is 0.7.
SMA + Bollinger Bands: Adds deviation-based envelopes for volatility spotting. BB StdDev: Only relevant if BBs are used. Controls bandwidth for overbought/oversold zones.
MA Length: Affects how smooth or reactive the RSI signal is.
📉 3. MACD Settings
Fast/Slow Length: Defaults (21/81) optimized for smoother MACD with SMA or T3. For Algo trading, EMA/JMA is best.
Signal Length: Shorter (e.g., 2) gives more reactive crossover signals; it can be increased.
Source: Default is close. Close works best for the settings I input. I also tuned some of the other MA types that worked for it.
MA Types: JMA and EMA reduce noise and increase signal generation. Select SMA for simplicity or T3 for trend-following.
Histogram: Bar colors signal strength and trend of MACD directly on your chart.
🔀 4. Directional Movement Index (DMI)
ADX Smoothing: High values (e.g., 100) offer strong trend confirmation with Hann Window smoothing 12, or 14 for either regular RMA or double smoothed.
DI Length: Affects DI+/- sensitivity. 100 ADX - 12/14 DI or 15 ADX - 35 DI are suggested, the latter for quicker boot time, as 100 bars is quite long.
Smoothing Type: Choose Hann Window for refined smoothing; RMA (SMMA) for simplicity. Double-smoothing is RMA -> Hann window, best of both types.
Volatility Type: ATR includes gaps for a full-range volatility; ADR is useful for gapless strategies, particularly OTC markets and intraday.
Plotted as area fills, 0 to 100 scaled.
Color-coded as Red (ADX), Orange (DI-), Blue (DI+).
📊 5. Volume Z-Score
%R Length: Normalizes volume to percentile range (73 swing, 112 exhaustion).
Z-Score Lengths: Compares short-term and long-term volume trends with Z-scores of volume.
Fast Z-Score < Slow Z-Score = Gives a Volume Squeeze.
Fast MA > Slow MA = Bullish Volume Divergence; volume has been fired. Not via Z-score, but instead via SMA, ALMA, and RMA of volume.
WPR Volume: Weighted %R used to highlight exhaustion/pivot points.
Plot volume bars after a volume squeeze has been fired; if bars aren't plotted, then it's under squeeze. Backtest on ES1! Prove it's good for catching bottoms below 15 minutes as well.
🧠 6. Divergence Engine
Pivot Settings: Pivot Period (12), Divergence minval Lookback (5), and max Lookback Bars (100) control sensitivity. Works well on any asset class; these are the optimal settings for the RSI.
Source Options: RSI, MACD, ADX, DI difference, or Volume %R.
Divergence Types: Regular (Mean Reversal), Hidden (Trend Continuation).
Heikin Ashi Mode: Enables use of HA candles on normal charts for smoother pivots. May distort values if your chart is H.A. so leave it unchecked then.
💥 7. Squeeze Momentum System (SQZMOM PRO)
Squeeze Types:
⚫ Wide (Black) — Regular Compression
🔴 Normal (Red) — Standard squeeze
🟡 Narrow (Yellow) — Golden squeeze
🟣 Very Narrow (Purple) — Extreme compression
🟢 Fired (Green) — Fired Squeeze = Breakout
Plotted on the very bottom of my indicator.
Momentum Bars:
🔷 Cyan = Rising
🔵 Blue = Pullback
🔴 Red = Falling
🟡 Yellow = Corrective
Plotted on the top of my indicator.
Reversal Signals: Dashed lines on momentum–JMA crossovers (DM-style pivot logic) ploted directly on the chart.
📈 8. Rate of Change (RoC)
RoC of Momentum: EMA-smoothed RoC on momentum for leading signals. Double smoothed, once and then another time for smoother signals.
RoC of Momentum → EMA → EMA → JMA Signal.
Signal Line: JMA used to filter noise and generate reversal signals.
Crossovers: Bullish/bearish signals based on RoC vs. signal line are plotted as triangles directly on your chart.
Optimized: Backtested for short-term setups like 1H or faster. Works on Daily timeframes as well for Futures and 24/7 Markets.
🕰️ 9. Multi-Timeframe Squeeze Settings
Each timeframe (Hourly, 4H, Daily, Weekly, Monthly) has:
Reversal Toggle: Enables dashed line DM-style pivots on crossovers.
MA Length: For Jurik MA smoothing on momentum.
BB/KC Thresholds: Define squeeze sensitivity per timeframe. A shorter BB/KC length, 17-14-12, responds better on lower timeframes.
Momentum Length: Tailors oscillator responsiveness; 20 is ideal.
🧮 10. BB Std. Deviation Scaling
Low-Pass Super Smoother : Smooths noise for BBs.
High-Pass Butterworth : Extracts cycles for BB Stdv. blend.
Root Mean Squared : Dynamic BB width adjustment based on market activity. True-range-based.
LP -> HP -> RMS -> Bollinger Band Multiplier (2.0)
Optional Intensify: Increases the squeeze rate * 4. Can be used for some option pricing strategies.
🧵 11. Moving Average Ribbon
4 optional MAs with full customization:
Choose from 13 MA types (incl. Kalman, Laguerre, T3, ALMA)
Color-coded for trend analysis (MA1–MA4 mimicking 9/21/50/200 periods)
Optional crossover alerts
🔔12. Alerts
RSI: Overbought/oversold reversals. Several types. (🦅 / 🕊️)
MACD: Histogram shift through zero line. (🐘 / 🐴)
DMI/ADX: Crossovers and strength conditions. The key level is the level where if DI/ADX is past this threshold, then it's considered to be trending. (🐬 / 🐋 / 🛡️)
Volume: Smart Money alerts on low-volume zones. May concentrate on ICT sessions. (🚨)
Squeeze: Alerts on all 5 squeeze states. (⚫, 🔴, 🟡, 🟣, 🟢)
Momentum: Momentum / JMA crosses and reversals. (🐂 / 🐻)
RoC: Bullish and bearish crosses. (📈 / 📉)
Divergences: Regular, hidden, and combined. (🐂 / 🐻 / 🐾 / 🐼)
MA Ribbon: Cross alert (⚔️)
VIX: VIX Z-Score past 2.0 (🏴☠️)
📊 13. Visual Output Summary
RSI Line + MA + Optional BB
MACD Histogram (Color Adaptive)
DMI/ADX Area Fills
%R Volume Bars (Smart Money)
Squeeze Dots (Circles)
Momentum Bars (Squares)
RoC Arrows (Cross Signals)
Pivot Break Lines (Dashed)
Auto-Divergence Lines & Labels
MA Ribbon Overlay (Optional)
✅ Best Practices ✅
Watch the slope of the RSI for pullbacks on a strong trend. Combine it with squeeze for exit timing.
Combine RSI Divergence with MACD histogram cross and Squeeze firing for precise entry.
Use Volume Z-Score to filter for institutional activity, and enter Long. Watch for reversals as well.
Watch RoC crossovers for fast, leading signals.
Enable Reversal Lines on 1H+ charts for breakout or breakdown pivots.
Use multi-timeframe thresholds for swing confirmation. The TFs I use the most are 2-5-15 minutes for futures and swinging with 1 hour daily and weekly. Those are the TFs I backtested.
An optional MA Ribbon is here as well; it supports 13 MA types.
🌎 Asset-Agnostic
MACD Automatically adjusts for Crypto, Forex, Stocks, Commodities, and Indices.
Custom ALMA, T3, Kalman, and Laguerre filters optimized per asset class and timeframe.
📚 Tech Highlights
Over 15,000 lines of modular, structured Pine Script v6 code.
Integration of Ehlers Cycle Theory and various other filters, one for each indicator.
Designed for visual clarity, multi-dimensional signal stacking, and low lag/high accuracy.
🌀 All 64 outputs are filled, so there might not be any more future updates. It's also a bit slow to load due to that.

BBOB: Breaker + Order + Overlapping Blocks + Buy/Sell💎 Smart OBX Premium – Order Block, Breaker Block & Overlap Zones
Unleash the power of institutional trading levels with Smart OBX Premium, a next-generation indicator designed to identify Order Blocks, Breaker Blocks, and Overlap Zones with pinpoint precision and stunning visuals.
🔷 Key Features:
✅ Order Blocks (OB)
Detects bullish and bearish order blocks from smart money footprints. Zones are colored elegantly with clear, labeled boxes for instant recognition.
✅ Breaker Blocks (BB)
Identifies failed OBs that act as strong reversal or continuation zones. Visually distinct with premium-quality styling and easy-to-read tags.
✅ Overlap Zones
Highlights powerful confluence areas where OB and BB intersect — the most high-probability reaction zones. These are shaded uniquely with gold gradient tones for instant visual edge.
✅ Zone Labels & Reactions
All blocks are clearly labeled on chart with names like:
• 🔵 Bullish OB
• 🔴 Bearish OB
• 🟢 Bullish Breaker
• 🟠 Bearish Breaker
• ⭐ Overlap Zone
✅ Professional Design
Ultra-clear visuals with soft shadows, rounded edges, transparent layers, and precise alignment. Perfect for content creators and serious traders.
✅ Buy/Sell Signal Points
Automatic arrows or labels appear above/below candles whenever price reacts strongly to OB/BB/Overlap zones.
🧠 Smart Money Concept-Based
Built entirely on institutional price behavior — the same logic used by banks, hedge funds, and top-level smart money traders.

Rally/Drop Market Structure (Multi-Timeframe)Rally/Drop Market Structure
Supply and Demand Zones from Bullish/Bearish Breaks
Overview:
The Rally/Drop Market Structure indicator is a powerful price action tool that identifies key structural turning points in the market by detecting bullish and bearish breaks . After each confirmed break, it plots either a demand zone (following a bullish break or rally) or a supply zone (following a bearish break or drop). These zones represent institutional footprints — areas where price is likely to react due to imbalance or unfilled orders.
The indicator is based on synthetic higher timeframe (HTF) candles to provide a more stable and smoothed structural map, improving clarity and signal quality over raw candles.
How It Works:
- A bullish break is defined when price makes a higher high and a higher low (or closes above the previous high depending on your selected mode).
- A bearish break is defined when price makes a lower high and a lower low (or closes below the previous low).
- After a bullish break, the indicator plots a demand zone based on the low and high of the most recent bearish candle — representing where demand stepped in.
- After a bearish break, the indicator plots a supply zone from the most recent bullish candle — indicating where supply took control.
- Optional mitigation logic marks zones as mitigated (or deletes them) once price trades into the opposing side.
- Internal shift detection highlights swing highs and lows , labels structural points (HH, HL, LH, LL), and identifies potential liquidity sweeps .
Features:
- Dynamic plotting of rally-based demand zones and drop-based supply zones
- Toggle to use Highs/Lows or Close-based breaks for structure
- Support for LTF, MTF, and HTF analysis (with selectable timeframe)
- Zone mitigation logic with optional automatic cleanup
- Labeling of key swing points: HH , HL , LH , LL , and LS (Liquidity Sweep)
- Zigzag visualization for structure flow
- Alert-ready for internal shifts, BoS, and zone creation
- Separate styling options for BoS lines, internal shift shapes, and zone colors
How to Use:
- Set your desired HTF candle source (e.g., 1H or 4H) depending on your trading style.
- Use Highs/Lows mode for pure price action structure or Close mode for more conservative signals.
- Observe when a bullish break occurs — a demand zone will form where price previously dropped before rallying. Look for long opportunities if price revisits this zone.
- After a bearish break , a supply zone forms where the rally failed — use this to scout short entries on retests.
- Use BoS lines to confirm structure shifts and validate entry triggers or trend direction.
- Monitor mitigated zones for reduced reliability or avoid them completely by enabling automatic deletion.
- Use alerts to stay notified about key changes without watching the chart constantly.
Recommended Strategies:
- Smart money or ICT-style trading : identify institutional footprints and mitigation setups
- Reversal trading : catch price rejecting off unmitigated zones after structure break
- Trend continuation : enter in the direction of internal structure after pullbacks into zones
- Liquidity sweep confirmation : filter out false breaks using HH/LL with LS detection
Tips:
- Combine this indicator with a higher timeframe bias tool (e.g., moving average, higher timeframe market structure).
- For scalping, use tighter HTFs and reduce the zone duration.
- For swing trading, use larger HTFs (1H, 4H, Daily) and increase zone persistence.
Summary:
The Rally/Drop Market Structure indicator gives you an actionable framework for understanding price structure, market intent, and supply/demand imbalances. Whether you're looking for precision entries, trend confirmation, or smart money concepts, this tool helps simplify complex price behavior into clean, usable structure and zones.

Ralph Indicator - ZaraTrust Smart MoneyThe Ralph Indicator – ZaraTrust Smart Money is a powerful yet simple Smart Money Concepts (SMC) based tool designed for traders who want to trade like institutions. It auto-detects high-probability Buy/Sell zones, Support/Resistance levels, and Demand/Supply areas on the chart — giving you clear, visual, and actionable signals without the clutter.
⸻
🔍 Key Features:
✅ Smart Money Structure
• Uses pivot-based logic to identify potential structure points
• Helps you understand market flow (e.g., BOS, CHoCH simplified logic)
✅ Automatic Support & Resistance
• Plots major levels based on significant highs and lows
• Helps catch key reversal or breakout zones
✅ Demand & Supply Zones
• Visually shows areas where price may react strongly
• Based on smart pivot detection from recent swings
✅ Buy/Sell Trade Signals
• Highlights buy when price breaks resistance (possible bullish shift)
• Highlights sell when price breaks support (possible bearish shift)
✅ Clean & Easy UI
• Toggle features on/off from settings panel
• Labels and shapes are plotted clearly on the chart for instant reading
⸻
🛠️ Recommended Use:
• Use on 15min to 4H timeframe for intraday or swing trading
• Combine with price action (e.g., confirmation candles, liquidity grab)
• Works best when paired with institutional logic (OBs, FVG, liquidity)
⸻
⚠️ Disclaimer:
This indicator is a tool, not a signal service.
It does not guarantee 98% accuracy, but it’s designed to highlight smart money zones and high-probability areas. Always do your own risk management and backtest before using on a live account.

Eulers Exponential VolatilityRImplements an approximation to Patrik's Euler's Exponential for BTC
See X @GallantCryptoYT

20% Rally - All Green CandlesThis indicator detects rallies where the price rises 20% or more using only consecutive green candles. It marks the rally's start with a green dashed line and "Entry" label, and the end with a red solid line and "Target" label. Ideal for identifying strong bullish momentum on daily charts.

RB3 DEMO – Rejection Blocks Visual ExampleThis is a simplified demo version of a custom Rejection Block (RB) visual indicator. It identifies potential bullish and bearish rejection zones based purely on candle structure, without using any time-based or algorithmic filters.
🧠 What it does:
• Detects Bullish and Bearish Rejection Blocks using clean price action logic
• Highlights those zones with boxes, optional lines, and labels
• Designed to help traders visually study price rejections and market structure
⚙️ How it works:
• Bullish RB = red candle with a lower low than the previous and next candle
• Bearish RB = green candle with a higher high than the previous and next candle
• No time filters or hidden logic are used — this tool is purely structural
🎯 Best used by:
• Traders who want to visualize potential rejection zones
• Beginners studying price action and structural reversals
• Visual learners who prefer clean chart-based confirmations
✅ This demo does **not** include institutional filters, time anchors (e.g., TRAL‑03), or sequence-based validation.
📌 A more advanced version with time-reactive filtering logic is available privately.
ℹ️ To use: enable "Boxes" and/or "Labels" to highlight rejection blocks clearly. Works on all timeframes.

Std.dev [AY¹]İşte TradingView için uygun açıklama metni:
Std.dev - Extended Range Deviation Indicator
This indicator calculates and displays standard deviation levels based on a custom session's high and low range, with lines extending until the next session start.
Key Features:
Custom Session Definition: Set your preferred session time (default: 09:00-11:30)
Extended Lines: Deviation lines extend from session end until next day's session start (09:00)
Flexible Deviation Types: Choose between full deviations (1.0, 2.0, 3.0...) or half deviations (0.5, 1.0, 1.5, 2.0...)
Visual Differentiation: Half deviation levels are displayed with dashed lines for easy identification
Anchor Point Options: Calculate deviations based on wicks or candle bodies
Session Visualization: Optional session range boxes and vertical start/end lines
Equilibrium Line: Optional mid-point line between session high and low
How it Works:
Identifies the specified session period each day
Captures the highest and lowest prices during that session
Calculates the range (high - low)
Draws multiple deviation levels above and below the range
Extends all levels until the next session begins
Use Cases:
Support and resistance level identification
Price target projections
Range-based trading strategies
Market structure analysis
Settings:
Session time configuration
Number of deviation levels (1-10)
Line styles and colors
Show/hide session boxes and labels
Customizable anchor points (wicks vs bodies)
The indicator preserves historical levels, allowing traders to analyze multiple sessions simultaneously for comprehensive market structure analysis.

NY HIGH LOW BREAKNY HIGH LOW BREAK: A New York Session Breakout Strategy
The "NY HIGH LOW BREAK" indicator is a powerful TradingView script designed to identify and capitalize on breakout opportunities during the New York trading session. This strategy focuses on the initial price action of the New York market open, looking for clear breaches of the high or low established within the first 30 minutes. It's particularly suited for intraday traders who seek to capture momentum-driven moves.
Strategy Logic
The core of the "NY HIGH LOW BREAK" strategy revolves around these key components:
New York Session Opening Range Identification:
The script first identifies the opening range of the New York session. This is defined by the high and low prices established during the first 30 minutes of the New York trading session (from 7:01 AM GMT-4 to 7:31 AM GMT-4).
These crucial levels are then extended forward on the chart as horizontal lines, serving as potential support and resistance zones.
Breakout Signal Generation:
Long Signal: A buy signal is generated when the price breaks above the high of the New York opening range. Specifically, it looks for a candle whose open and close are both above the highLinePrice, and importantly, the previous candle's open was below and close was above the highLinePrice. This indicates a strong upward momentum confirming the breakout.
Short Signal: Conversely, a sell signal is generated when the price breaks below the low of the New York opening range. It looks for a candle whose open and close are both below the lowLinePrice, and the previous candle's open was above and close was below the lowLinePrice. This suggests strong downward momentum confirming the breakdown.
Supertrend Filter (Implicit/Future Enhancement):
While the supertrend and direction variables are present in the code, they are not actively used in the current signal generation logic. This suggests a potential future enhancement where the Supertrend indicator could be incorporated as a trend filter to confirm breakout directions, adding an extra layer of confluence to the signals. For example, only taking long breakouts when Supertrend indicates an uptrend, and short breakouts when Supertrend indicates a downtrend.
Second Candle Confirmation (Possible Future Enhancement):
The close_sec_candle function and openSEC, closeSEC variables indicate an attempt to capture the open and close of a "second candle" (30 minutes after the initial New York open). Currently, closeSEC is used in a specific condition for signal_way but not directly in the primary longSignal or shortSignal logic. This also suggests a potential future refinement where the price action of this second candle could be used for further confirmation or specific entry criteria.
Time-Based Filtering:
Signals are only considered valid within a specific trading window from 8:00 AM GMT-4 to 8:00 AM GMT-4 + 16 * 30 minutes (which is 480 minutes, or 8 hours) on 1-minute and 5-minute timeframes. This ensures that trades are taken during the most active and volatile periods of the New York session, avoiding late-session chop.
The script also highlights the New York session and lunch hours using background colors, providing visual context to the trading day.
Key Features
Automated New York Open Range Detection: The script automatically identifies and plots the high and low of the first 30 minutes of the New York trading session.
Clear Breakout Signals: Visually distinct "BUY" and "SELL" labels appear on the chart when a breakout occurs, making it easy to spot trading opportunities.
Timeframe Adaptability: While optimized for 1-minute and 5-minute timeframes for signal generation, the opening range lines can be displayed on various timeframes.
Customizable Risk-to-Reward (RR): The rr input allows users to define their preferred risk-to-reward ratio for potential trades, although it's not directly implemented in the current signal or trade management logic. This could be used by traders for manual trade management.
Visual Session and Lunch Highlights: The script colors the background to clearly delineate the New York trading session and the lunch break, helping traders understand the market context.
How to Use
Apply the Indicator: Add the "NY HIGH LOW BREAK" indicator to your chart on TradingView.
Select a Relevant Timeframe: For optimal signal generation, use 1-minute or 5-minute timeframes.
Observe the Opening Range: The green and red lines represent the high and low of the first 30 minutes of the New York session.
Look for Breakouts: Wait for price to decisively break above the green line (for a buy) or below the red line (for a sell).
Confirm Signals: The "BUY" or "SELL" labels will appear on the chart when the breakout conditions are met within the active trading window.
Implement Your Risk Management: Use your preferred risk management techniques, including stop-loss and take-profit levels, in conjunction with the signals generated. The rr input can guide your manual risk-to-reward calculations.
Potential Enhancements & Considerations
Supertrend Confirmation: Integrating the supertrend variable to filter signals would significantly enhance the strategy's robustness by aligning trades with the prevailing trend.
Stop-Loss and Take-Profit Automation: The rr input currently serves as a manual guide. Future versions could integrate automated stop-loss and take-profit placement based on this ratio, potentially using ATR for dynamic sizing.
Volume Confirmation: Adding a volume filter to confirm breakouts would ensure that only high-conviction moves are traded.
Backtesting and Optimization: Thorough backtesting across various assets and market conditions is crucial to determine the optimal settings and profitability of this strategy.
Session Times: The current session times are hardcoded. Making these user-definable inputs would allow for greater flexibility across different time zones and trading preferences.
The "NY HIGH LOW BREAK" is a straightforward yet effective strategy for capturing initial New York session momentum. By focusing on clear breakout levels, it aims to provide timely and actionable trading signals for intraday traders.

NY Open ATR System - Tick Range Filter### **New York Open ATR System - Brief Overview**
#### **🎯 Core Purpose**
Identifies **high-potential breakout setups** at the New York open (13:30 UTC) by combining:
1. **Volatility filters** (dual ATR periods)
2. **Tick-based range analysis**
3. **Time-specific triggers**
---
### **⚙️ Key Components**
| **Feature** | **Function** |
|---------------------------|-----------------------------------------------------------------------------|
| **ATR Filters** | Dual volatility checks (short + long periods) at 13:25 UTC |
| **Tick Range Limit** | Highlights candles with range < user-defined ticks (default: 150) |
| **Time Precision** | Focuses exclusively on 13:30 UTC weekday candles |
| **Visual Markers** | Yellow highlight + tick count label (e.g., "147/150 ticks") |
| **Info Panel** | Real-time display of settings and current tick count |
---
### **📊 How It Works**
1. **Pre-Open Check (13:25 UTC)**
- Verifies market volatility using 2 ATR values
- Requires both to exceed user-defined thresholds
2. **Open Analysis (13:30 UTC)**
- Measures exact tick count: `(high - low) / instrument_mintick`
- Compares against your max tick limit (adjustable 1-5000)
3. **Visual Trigger**
- Highlights candle yellow if:
```tick_count < your_set_limit```
- Labels show exact performance vs limit (e.g., "142/150 ticks")
---
### **⚡ Trading Signals**
| **Condition** | **Visual Feedback** |
|----------------------------|---------------------------------------------|
| High volatility + tight range | Yellow candle + tick count label |
| All other scenarios | No marking |
---
### **🛠️ Customization**
```pine
// Key Adjustable Parameters:
maxTicks = input.int(150) // Set 1-5000 ticks
atrPeriod1 = input.int(14) // Short ATR (2-5000)
atrPeriod2 = input.int(161) // Long ATR (2-5000)
candleColor = input.color(color.yellow) // Highlight color
```
---
### **💡 Practical Use Cases**
1. **Breakout Anticipation**
- Tight ranges after volatility spikes often precede strong moves
2. **Session Scalping**
- Identify low-range opens for mean-reversion plays
3. **Volatility Filtering**
- Avoid trading when ATR thresholds aren't met
---
### **📈 Suggested Settings**
| **Market** | **Max Ticks** | **ATR Periods** |
|------------------|--------------|----------------|
| Forex (EUR/USD) | 100-200 | 14/161 |
| Stocks (SPY) | 50-120 | 10/200 |
| Crypto (BTC) | 300-500 | 20/100 |
---
### **✅ Benefits**
- **Precision Timing**: Focused on NY open liquidity surge
- **Quantitative Filtering**: Exact tick measurement + volatility thresholds
- **Clean Visuals**: No chart clutter - only marks qualifying candles
- **Adaptable**: Works across all markets and timeframes
This system helps traders spot high-probability breakout setups by combining volatility anticipation with precise range measurement at the market's most liquid opening window.

Initial Balance Wave MapThis indicator visualizes the Initial Balance (IB) range for any session, marking the first hour's high and low. It includes optional midpoints, extensions (e.g. 1.5x IB, 2x IB), and customizable time windows. Additional features allow users to display session open, high, low, close, and VWAP reference points. Designed to support price action and session structure analysis, it adapts to various global futures and FX market opens. All display elements are optional and fully configurable.
This updated indicator builds upon the open-source foundation by @noop-noop with enhancements and user-facing labels tailored for Auction Market Theory, scalping, and structure-based trade setups.
Key updated Featured: Multiple previous day's IB levels carry forward into the current day's chart, as opposed to just the previous day's levels carrying forward to the new IB time.
🙌 Credits:
This script builds upon the excellent open-source work by @noop-noop. Original script available here .

Dominance Candle Raja Saien (Detector with Alerts)Dominance Candle Finder with Alerts by Raja Saien
This powerful indicator is designed to detect dominance candles—those strong-bodied candles that often signify momentum and trend strength. Whether you're trading breakouts, trend continuations, or reversals, this tool helps you identify key market moves in real time with optional alerts.
🔍 Features:
Automatic Detection of Dominance Candles: Highlights candles with strong body size, showing decisive market movement.
Customizable Thresholds: Adjust sensitivity according to your strategy or asset volatility.
Built-in Alerts: Get notified the moment a dominance candle forms—no need to stare at charts all day!
Multi-Timeframe Compatibility: Works on any timeframe from 1-minute to daily or higher.
📊 Use Cases:
Entry confirmation on breakouts
Trend strength analysis
Volatility surge detection
Combine with support/resistance or order block zones for powerful setups
Tip: Best used with strong support/resistance levels or price action strategies for confluence

RSI Multi-Frame Multi-Asset
✅ Key Features:
Multi-Asset: Simultaneously analyze Bitcoin, SP500, Nasdaq, DXY, Gold, Oil, VIX and more
Multi-Timeframe: Configure any timeframe for all RSI calculations
Smart Average RSI: Automatically calculates the mean of all active RSI values
Special Data: Includes Bitcoin Hashrate, 10Y-2Y Spread, and US Interest Rates
Built-in Alerts: Automatic notifications on overbought/oversold crossovers
🎯 Why is it Unique?
Instead of looking at 10 different charts, you get an instant macro view of the market. The average RSI shows you the overall strength/weakness of global markets, while individual RSI values let you identify divergences and specific opportunities.
🚀 Perfect For:
Traders seeking correlations between assets
Global markets macro analysis
Identifying divergences between Bitcoin and traditional markets
Multi-timeframe breakout trading
