15m EMA 50 CloudDescription:
The 15m EMA 50 Cloud is a simple but powerful tool designed for scalpers and intraday traders who hunt for low timeframe patterns while staying anchored to higher timeframe trend context.
This indicator displays the 50-period EMA and its volatility cloud from the 15-minute chart on any timeframe - including 1m, 3m, or 5m. The cloud adapts dynamically and remains visible even when you zoom into lower timeframes, helping you instantly see whether price is trading above, below or within the 15m trend structure.
Features:
* Plots the 15-minute 50 EMA Cloud on any chart, regardless of your selected timeframe.
* Cloud width is based on 15m price volatility (standard deviation), inspired by the popular "Traders Reality" indicator.
* Option to enable or hide the EMA line for a cleaner look.
* Customizable colors for the cloud fill, border, and EMA line.
* Works with all markets and all symbols.
How to Use:
* Perfect for scalpers who want to spot micro patterns (e.g., on 1m or 3m charts) while keeping
the 15m EMA cloud as a visual "road map".
* Use the cloud as a dynamic support/resistance zone or to define higher timeframe trend bias.
* Combine with your favorite price action or orderflow setups for multi-timeframe confluence.
Settings:
* Toggle EMA line ON/OFF.
* Adjust cloud and border colors for your chart style.
For educational purposes only. This indicator does not provide financial advice or signals. Always use proper risk management.
⚠️ Important Notice
This tool is provided for educational and informational purposes only . It is designed to assist in technical analysis learning and visual chart study.
It is not intended to be used as financial advice, a buy/sell signal, or any form of investment recommendation .
By using this indicator, you acknowledge that all actions you take are your own and you assume full responsibility for any decisions made.
Indicators and strategies


Ultimate JLines & MTF EMA (Configurable, Labels)## Ultimate JLines & MTF EMA (Configurable, Labels) — Script Overview
This Pine Script is a comprehensive, multi-timeframe indicator based on J Trader concepts. It overlays various Exponential Moving Averages (EMAs), VWAP, inside bar highlights, and dynamic labels onto price charts. The script is highly configurable, allowing users to tailor which elements are displayed and how they appear.
### Key Features
#### 1. **Multi-Timeframe JLines**
- **JLines** are pairs of EMAs (default lengths: 72 and 89) calculated on several timeframes:
- 1 minute (1m)
- 3 minutes (3m)
- 5 minutes (5m)
- 1 hour (1h)
- Custom timeframe (user-selectable)
- Each pair can be visualized as individual lines and as a "cloud" (shaded area between the two EMAs).
- Colors and opacity for each timeframe are user-configurable.
#### 2. **200 EMA on Multiple Timeframes**
- Plots the 200-period EMA on selectable timeframes: 1m, 3m, 5m, 15m, and 1h.
- Each can be toggled independently and colored as desired.
#### 3. **9 EMA and VWAP**
- Plots a 9-period EMA, either on the chart’s current timeframe or a user-specified one.
- Plots VWAP (Volume-Weighted Average Price) for additional trend context.
#### 4. **5/15 EMA Cross Cloud (5min)**
- Calculates and optionally displays a shaded "cloud" between the 5-period and 15-period EMAs on the 5-minute chart.
- Highlights bullish (5 EMA above 15 EMA) and bearish (5 EMA below 15 EMA) conditions with different colors.
- Optionally displays the 5 and 15 EMA lines themselves.
#### 5. **Inside Bar Highlighting**
- Highlights bars where the current high is less than or equal to the previous high and the low is greater than or equal to the previous low (inside bars).
- Color is user-configurable.
#### 6. **9 EMA / VWAP Cross Arrows**
- Plots up/down arrows when the 9 EMA crosses above or below the VWAP.
- Arrow colors and visibility are configurable.
#### 7. **Dynamic Labels**
- On the most recent bar, displays labels for each enabled line (EMAs, VWAP), offset to the right for clarity.
- Labels include the timeframe, type, and current value.
### Customization Options
- **Visibility:** Each plot (line, cloud, arrow, label) can be individually toggled on/off.
- **Colors:** All lines, clouds, and arrows can be colored to user preference, including opacity for clouds.
- **Timeframes:** JLines and EMAs can be calculated on different timeframes, including a custom one.
- **Label Text:** Labels dynamically reflect current indicator values and are color-coded to match their lines.
### Technical Implementation Highlights
- **Helper Functions:** Functions abstract away the logic for multi-timeframe EMA calculation.
- **Security Calls:** Uses `request.security` to fetch data from other timeframes, ensuring accurate multi-timeframe plotting.
- **Efficient Label Management:** Deletes old labels and creates new ones only on the last bar to avoid clutter and maintain performance.
- **Conditional Plotting:** All visual elements are conditionally plotted based on user input, making the indicator highly flexible.
### Use Cases
- **Trend Identification:** Multiple EMAs and VWAP help traders quickly identify trend direction and strength across timeframes.
- **Support/Resistance:** 200 EMA and JLines often act as dynamic support/resistance levels.
- **Entry/Exit Signals:** Crosses between 9 EMA and VWAP, as well as 5/15 EMA clouds, can signal potential trade entries or exits.
- **Pattern Recognition:** Inside bar highlights aid in spotting consolidation and breakout patterns.
### Summary Table of Configurable Elements
| Feature | Timeframes | Cloud Option | Label Option | Color Customizable | Description |
|----------------------------|-------------------|--------------|--------------|--------------------|-----------------------------------------------|
| JLines (72/89 EMA) | 1m, 3m, 5m, 1h, Custom | Yes | Yes | Yes | Key trend-following EMAs with cloud fill |
| 200 EMA | 1m, 3m, 5m, 15m, 1h | No | Yes | Yes | Long-term trend indicator |
| 9 EMA | Any | No | Yes | Yes | Short-term trend indicator |
| VWAP | Chart TF | No | Yes | Yes | Volume-weighted average price |
| 5/15 EMA Cloud (5m) | 5m | Yes | No | Yes | Bullish/bearish cloud between 5/15 EMAs |
| Inside Bar Highlight | Chart TF | No | N/A | Yes | Highlights price consolidation |
| 9 EMA / VWAP Cross Arrows | Chart TF | No | N/A | Yes | Marks EMA/VWAP crossovers with arrows |
This script is ideal for traders seeking a robust, multi-timeframe overlay that combines trend, momentum, and pattern signals in a single, highly customizable indicator. I do not advocate to subscribe to JTrades or the system they tout. This is based on my own observations and not a copy of any JTrades scripts. It is open source to allow full transparency.

HY-LevelsA very simple indicator that draws the previous 1H, 4H and 1D high and low levels
It's typically used when trading the 1M charts
The various levels can be turned on and off and the line can be extended left, right or in both directions as you prefer.
The code is simple and should be easy to modify to your preferences

Efficient Options Entry Signals (Call/Put/Spreads)Add to TradingView as a new Indicator Script.
Works on all timeframes, but defaults are tuned for daily/5m/15m.
Arrows and labels will show precise entries/exits for calls, puts, and debit spreads based on volatility.
Only efficient, trend-confirmed trades—no whipsaw overload!
All input parameters adjustable in the script UI.

3 Consecutive Same Color CandlesThis TradingView Pine Script detects when three consecutive candlesticks are either all bullish (green) or all bearish (red). It plots a triangle marker above or below the candle to visually signal the pattern and optionally triggers alerts.
How It Works:
A green signal (triangle up) appears below the third candle if the last 3 candles closed higher than they opened (bullish).
A red signal (triangle down) appears above the third candle if the last 3 candles closed lower than they opened (bearish).
Alerts can be set up to notify you immediately when the pattern forms.
Use Case on the 10-Minute Chart:
On the 10-minute chart, this script helps you spot short-term momentum buildups in either direction.
Bullish Signal (3 Green Candles):
Suggests buyers are gaining control.
Can be used to:
Enter breakout trades
Confirm trend continuation
Prepare for scalp entries or momentum trades
Bearish Signal (3 Red Candles):
Indicates sellers are applying pressure.
Can help:
Spot pullbacks or trend reversals
Set up for short positions
Warn of potential breakdowns
Example Trading Ideas:
Pair with EMA or support/resistance for confirmation.
Use as a momentum filter in scalping systems.
Combine with volume or RSI divergence to gauge strength or exhaustion.

SMCX Morning Signal (v6) - Previous Day Confirmed (non-repaint)Paints (no repaint) either a buy or not buy signal for every day based on 3 conditions that pretty accurately predict a green candle day, and it's been tested accurate on just about anything. The 3 conditions are price above 4 hour vwap, price above 8 hour vwap, and 4 hour rvol > 1. We can change the title but I labeled it SMCX morning signal because I was originally trying to shark big moves for SMCX, but then when I got the indicator to work, I saw how rare a green signal was, which I suppose it should be, I needed to backtest it across a wide range of stocks and ETFs. The results were incredible (have stats in a spreadsheet that ranks which leveraged ETFs I should check a signal for by day of the week). Would be great to have this officially published. We could call it VWAP and RVOL market structure confirmation signal.

CandelaCharts - HTF Sweeps📝 Overview
This indicator lets you overlay a higher timeframe (HTF) onto your current chart, giving you a clearer view of broader market movements without switching timeframes.
This indicator also detects liquidity sweeps and plots them on both the higher timeframe (HTF) and the current lower timeframe (LTF), helping traders clearly spot potential reversal points. It adds LTF dividers for better structure clarity, making it easier to align with HTF shifts and refine entry timing with greater precision.
📦 Features
This indicator identifies price sweeps and their invalidations, helping traders spot potential liquidity grabs and failed breakout attempts.
Overlay a configurable higher timeframe (HTF) on the current chart
Detects and plots liquidity sweeps on both HTF and LTF
Adds lower timeframe (LTF) dividers for improved structure clarity
Ideal for ICT-style top-down analysis and precision entries without switching charts
⚙️ Settings
Customize the indicator to suit your strategy. Alert options are also available, so you can stay informed when key market events are triggered.
Timeframes: Select the higher timeframe (HTF) to overlay on your current chart.
HTF Coloring: Customize the color scheme for HTF candles.
HTF Offset: Space of HTF Candles and current chart.
HTF Size: Adjust the size of HTF candles.
HTF Labels: Toggle labels for HTF.
LTF H/L Line: Show or hide high/low lines from the lower timeframe.
LTF O/C Line: Display open/close lines from the lower timeframe.
Sweep: Enable detection and plotting of liquidity sweeps.
I-sweep: Toggle invalidated sweep detection.
Alerts: Enable Sweep Formation or Invalidation alerts
⚡️ Showcase
See the indicator applied in live market scenarios, illustrating how sweep detections and invalidations unfold on various charts.
HTF Candles
HTF Sweeps
LTF Sweeps
Invalidated Sweeps
🚨 Alerts
This indicator includes built-in alert functionality to keep you informed of key market events in real time. It supports the following customizable alerts on TradingView:
Sweep Detection: Notifies you when a price sweep is detected—either a liquidity sweep above recent highs or below recent lows. This can be a strong signal of potential reversals or liquidity grabs by larger market participants.
Sweep Invalidation: Alerts you when a previously detected sweep becomes invalidated due to price action moving beyond a defined threshold. This helps traders stay adaptive and avoid acting on outdated signals.
These alerts are fully integrated with TradingView’s native alert system, so you can receive notifications via app, email, or pop-up—ensuring you're always up to date, even when you're away from the chart.
⚠️ Disclaimer
Trading involves significant risk, and many participants may incur losses. The content on this site is not intended as financial advice and should not be interpreted as such. Decisions to buy, sell, hold, or trade securities, commodities, or other financial instruments carry inherent risks and are best made with guidance from qualified financial professionals. Past performance is not indicative of future results.

MA Signal IndicatorMA Signal Indicator
The MA Signal Indicator is a customizable designed to identify potential trading opportunities based on price interactions with a Simple Moving Average (SMA). It incorporates risk management features such as stop-loss (SL), take-profit (TP), and breakeven levels, calculated using the Average True Range (ATR). The indicator is visually intuitive, overlaying trade signals, price levels, and colored zones directly on the chart.
Key Features:
1. Moving Average-Based Signals:
• Generates buy (long) signals when the price crosses above a user-defined SMA (default: 55 periods).
• Generates sell (short) signals when the price crosses below the SMA.
• Long and short trades can be independently enabled or disabled via input settings.
2. Risk Management:
• Stop-Loss (SL): Set as a multiple of the ATR (default: 1x ATR) below the entry price for long trades or above for short trades.
• Take-Profit (TP): Set as a multiple of the ATR (default: 5x ATR) above the entry price for long trades or below for short trades.
• Breakeven Level: A trigger level (default: 2x ATR) where traders may choose to move their stop-loss to breakeven, optionally displayed on the chart.
3. Visual Feedback:
• SMA Line: Plotted in orange (default: 55-period SMA) for trend reference.
• Trade Zone: Highlights the area between the stop-loss and take-profit levels with a semi-transparent green (long) or red (short) background.
• Price Lines: Displays entry price (white), stop-loss (red), take-profit (green), and breakeven level (gray, optional) as horizontal lines during active trades.
• Signal Markers: Triangular markers indicate entry points (green triangle up for long, red triangle down for short).
• Exit Markers: Labels show when a trade hits the take-profit (green checkmark) or stop-loss (red cross).
4. Trade Logic:
• Only one trade is active at a time (long or short).
• Trades are exited when either the stop-loss or take-profit is hit, resetting the indicator for the next signal.
• Ensures signals are only triggered when not already in a trade, avoiding duplicate entries.
Inputs:
• MA Period: Length of the SMA (default: 55).
• ATR Period: Period for ATR calculation (default: 5).
• SL Multiplier: ATR multiplier for stop-loss (default: 1.0).
• TP Multiplier: ATR multiplier for take-profit (default: 5.0).
• Move to Breakeven After: ATR multiplier for breakeven trigger (default: 2.0).
• Show Break Even Line: Option to display the breakeven level (default: true).
• Allow Long Trades: Enable/disable long signals (default: true).
• Allow Short Trades: Enable/disable short signals (default: true).
Use Case:
This indicator is ideal for trend-following traders who want a clear, visual system for entering and exiting trades based on SMA crossovers, with predefined risk and reward levels. It suits both manual and automated trading strategies, providing flexibility to adjust parameters for different markets or timeframes.
Notes:
• The indicator is overlaid on the price chart for easy integration with other analysis tools.
• Users should test and adjust parameters (e.g., MA length, ATR multipliers) to suit their trading style and market conditions.
• The breakeven line is a visual guide; manual adjustment of stops is required as the indicator does not automatically modify trade positions.
This indicator provides a robust framework for disciplined trading with clear entry, exit, and risk management visuals.
SCPEM - Socionomic Crypto Peak Model (0-85 Scale)SCPEM Indicator Overview
The SCPEM (Socionomic Crypto Peak Evaluation Model) indicator is a TradingView tool designed to approximate cycle peaks in cryptocurrency markets using socionomic theory, which links market behavior to collective social mood. It generates a score from 0-85 (where 85 signals extreme euphoria and high reversal risk) and plots it as a blue line on the chart for visual backtesting and real-time analysis.
#### How It Works
The indicator uses technical proxies to estimate social mood factors, as Pine Script cannot fetch external data like sentiment indices or social media directly. It calculates a weighted composite score on each bar:
- Proxies derive from price, volume, and volatility data.
- The raw sum of factor scores (max ~28) is normalized to 0-85.
- The score updates historically for backtesting, showing mood progression over time.
- Alerts trigger if the score exceeds 60, indicating high peak probability.
Users can adjust inputs (e.g., lengths for RSI or pivots) to fine-tune for different assets or timeframes.
Metrics Used (Technical Proxies)
Crypto-Specific Sentiment
Approximated by RSI (overbought levels indicate greed).
Social Media Euphoria
Based on volume relative to its SMA (spikes suggest herding/FOMO).
Broader Social Mood Proxies
Derived from ATR volatility (high values signal uncertain/mixed mood).
Search and Cultural Interest Proxied by OBV trend (rising accumulation implies growing interest).
Socionomic Wildcard
Uses Bollinger Band width (expansion for positive mood, contraction for negative).
Elliott Wave Position
Counts recent price pivots (more swings indicate later wave stages and exhaustion).

Price PivotsThis indicator tracks price pivots and displays the high / low value.
You can select the number of candles to look back.
You can select how many candles range before the next pivot is printed.
Text size and colours are user defined.

LANZ Strategy 5.0🔷 LANZ Strategy 5.0 — Intraday BUY Signals, Dynamic Lot Size per Account, Real-Time Dashboard and Smart Execution
LANZ Strategy 5.0 is a powerful intraday tool designed for traders who need a visual-first, data-backed BUY system, enhanced with risk-aware lot size calculation and a real-time performance dashboard. This indicator intelligently detects strong momentum setups and provides visual and statistical clarity throughout the session.
📌 This is an indicator, not a strategy — It does not place trades automatically but provides precise conditions, alerts, and visual guides to support execution.
🧠 Core Logic & Features
BUY Entry Conditions (Signal Engine)
A BUY signal is triggered when:
The current price is above the EMA200 (trend filter)
The last 3 candles are bullish (candle body close > open)
You are within the defined session window (NY time)
When all conditions are met and you haven’t reached the daily trade limit, a signal appears on the chart and an optional alert is triggered.
Operational Hours Filter (NY Time)
You define:
Start time (e.g., 01:15 NY)
End time (e.g., 16:00 NY)
The system only evaluates and executes signals within this period. If a BUY setup occurs outside the window, it’s ignored. The chart is also highlighted with a transparent teal background to visually show active trading hours.
Lot Size Panel with Per-Account Risk Management
Designed for traders managing multiple accounts or capital sources. You can enable up to 5 accounts, each with:
Its own capital
Its own risk percentage per trade
The system uses the defined SL in pips, plus the instrument’s pip value, to calculate the lot size per account. All values are shown in a dedicated panel at the bottom-right, automatically updating with each new trade.
The emojis (🐣🦊🦁🐲🐳) distinguish each account visually.
Trade Visualization with Customizable Lines
When a signal is triggered:
An Entry Point (EP) line is drawn at the candle’s close.
A Stop Loss (SL) line is placed X pips below the entry.
A Take Profit (TP) line is placed Y pips above the entry.
All three lines are fully customizable in style, color, and thickness. You define how many bars the lines should extend.
Outcome Tracking & Real-Time Dashboard
Each trade outcome is measured:
SL hit = –1.00%
TP hit = +3.00%
Manual close = calculated dynamically based on price at close time
Each result is labeled on the chart near its level, and stored.
The top-right dashboard updates in real time:
✅ Number of trades
📈 Cumulative % gain/loss of the day (color-coded)
Alerts You Can Trust:
You’ll get a Buy Alert when a valid signal is formed
You’ll get a Trade Executed Alert when the visual operation is plotted
You’ll get a SL/TP Hit Alert with price and result
You’ll get a Manual Close Alert if the configured time is reached and the trade is still active
⚙️ Step-by-Step Execution Flow
At every bar, the system checks:
Are we within the session time window?
Is price above EMA?
Are the last 3 candles bullish?
✅ If yes:
A BUY signal is plotted
Entry/SL/TP lines are drawn
Lot sizes are calculated and displayed
Trade is added to the daily count
🕐 At the configured Manual Close time (e.g., 16:00 NY):
If the trade is still open, it's closed
A label is added with the exact result in %
💡 Ideal For:
Intraday traders who operate within fixed time sessions
Traders managing multiple accounts or capital pools
Anyone who wants full visual clarity of every decision point
Traders who appreciate dynamic lot size calculation and clean execution tracking
👨💻 Credits:
💡 Developed by: LANZ
🧠 Strategy concept & execution model: LANZ
🧪 Tested on: 1H charts with visual-only execution
📈 Designed for: Clarity, adaptability, and full intraday control

Apex Edge - VantageApex Edge – Vantage
Quarter-Wick Reversal System | Price Action Based | Non-Repainting | Visual Confirmation Tool
Overview:
Apex Edge – Vantage is a precision price action indicator built to assist traders in identifying high-probability reversal entries — not based on indicators, but on how candles behave at their extremes.
This tool implements a clean, repeatable framework that reflects how I personally trade:
Spot a candle that closes with strong directional intent,
Then wait for a controlled pullback into the outer quarter,
And strike — only if price respects that line.
There’s no magic here — just raw, tactical logic visualized clearly on your chart. It's not designed to predict the market — it's built to respond when price offers you Vantage.
Core Logic:
Dot Detection – Final Quarter Close Candles
A green dot prints below a bullish candle if it closes within the top 25% of its wick-to-wick range.
A red dot prints above a bearish candle if it closes within the bottom 25% of its range.
These dots signify candles that made a strong, deliberate move in one direction — where price was pushed to an extreme and held that extreme into the close. These candles often signal institutional intent or momentum imbalance.
Entry Confirmation – Controlled Wick Rebalance
On the very next candle only, price must wick into the prior dot candle's outer quarter — but must not pass beyond it.
For buy entries, the wick must enter the bottom 25% of the previous green dot candle, but not dip below it.
For sell entries, the wick must reach into the top 25% of the red dot candle, but not exceed it.
This wick into the quarter is seen as a controlled rebalancing — a tactical reaction back into the origin zone before potential continuation.
Arrow Printing – Visual Entry Signal
Once the entry criteria are confirmed, an arrow is printed after the candle closes.
This arrow continues to print on each new candle as long as price does not violate the original entry zone — giving visual confirmation that the trade thesis is still valid.
If price breaks above/below the quarter range, the arrow disappears.
This ongoing confirmation is useful for staying in trades, managing risk, or spotting failed setups early.
Automatic Stop Loss Level
A horizontal Stop Loss line is drawn from the extreme wick of the original dot candle.
For buy entries, SL is placed below the green dot candle's low.
For sell entries, SL is placed above the red dot candle's high.
This provides immediate risk context — perfect for traders using limit orders or looking to scale in.
Coding Logic:
This script uses plotshape() and plot() functions for all visual elements.
Dot candles are identified using quarter-range logic via:
pinescript
Copy
Edit
close >= high - (high - low) * 0.25 // for bullish
close <= low + (high - low) * 0.25 // for bearish
Entry validation logic triggers only on the next candle, using:
pinescript
Copy
Edit
low >= quarterLine and low <= high // for buy entries
high <= quarterLine and high >= low // for sell entries
Arrows and SL lines are plotted only on closed candles, ensuring non-repainting behavior.
alertcondition() is used for real-time alerts on valid buy/sell triggers.
How I Personally Use It:
I wait for a dot to print — this shows directional conviction.
On the next candle, I watch for a tap into the outer quarter.
If the wick meets the criteria and the candle closes, I’ll execute manually at the close of that candle.
As long as the arrow remains on the chart, I know the setup hasn’t been invalidated.
I combine this with market structure, session timing, and liquidity context to build confluence around each trade.
Alerts Included:
Buy Entry Alert: When a green arrow prints (entry confirmed)
Sell Entry Alert: When a red arrow prints (entry confirmed)
These fire once per confirmed signal, allowing you to react in real-time or automate if desired.
Who This Is For:
Manual traders who want clean price-based entries
Anyone who uses market structure, SMC, or liquidity concepts
Traders looking to replace indicators with pure candle logic
Discretionary or semi-systematic traders who want visual tools to guide their decisions
Final Word
Apex Edge – Vantage doesn’t predict price — it shows you where price is offering you control.
This is a surgical tool designed to help you act only when the market gives you a measurable edge — and to stay in the trade as long as that edge holds.
If you're ready to stop chasing trades and start striking from a position of Vantage, then this tool belongs on your chart.

N-Pattern Detector (Advanced Logic)Introduction
The N-Pattern Detector (Advanced Logic) is a powerful Pine Script-based tool designed to identify a specific price structure known as the "N-pattern", which often indicates trend continuation or potential breakout points in the market. This pattern combines zigzag pivot logic, retracement filters, volume confirmation, and trend alignment, offering high-probability trading signals.
It is ideal for traders who want to automate pattern detection while applying smart filters to reduce false signals in various markets — including stocks, forex, crypto, and indices.
What is the N-Pattern?
The N-pattern is a 3-leg price formation consisting of points A-B-C-D. It typically follows this structure:
Bullish N-Pattern:
A → Low Pivot
B → Higher High (Impulse)
C → Higher Low (Retracement)
D → Breakout above B (Confirmation)
Bearish N-Pattern:
A → High Pivot
B → Lower Low (Impulse)
C → Lower High (Retracement)
D → Breakdown below B (Confirmation)
The pattern essentially reflects a trend–pullback–breakout structure, making it suitable for continuation trades.
Key Features
1. Intelligent ZigZag Pivot Detection
Uses pivot highs/lows to define key swing points (A, B, C).
Adjustable ZigZag depth to control pattern sensitivity.
Filters noise and avoids false signals in volatile markets.
2. Retracement Validation
Validates the B→C leg as a proper pullback using Fibonacci-based thresholds.
User-defined min and max retracement settings (e.g., 38.2% to 78.6% of A→B leg).
3. Trend Filter via EMA
Filters patterns based on trend direction using a customizable EMA (e.g., 200 EMA).
Only detects bullish patterns above EMA and bearish patterns below EMA (optional).
4. Volume Confirmation
Ensures that impulse legs (A→B, C→D) are supported by stronger volume than the correction leg (B→C).
Adds another layer of confirmation and reliability to detected patterns.
5. Target Projections
Automatically draws 100% A→B projected target from point C.
Optional Fibonacci extensions at 1.272 and 1.618 levels for take-profit planning.
Visually plotted on the chart with colored dashed/dotted lines.
6. Clear Visuals & Labels
Connects all pattern points with colored lines.
Clearly labels points A, B, C, D on the chart.
Uses customizable colors for bullish and bearish patterns.
Includes real-time alerts when a valid pattern is detected.
How to Use It
Add to Chart
Apply the indicator to any chart and time frame. It works across all asset classes.
Adjust Inputs (Optional)
Set ZigZag Depth to control pivot detection sensitivity.
Define Min/Max Retracement levels to match your trading style.
Enable or disable Trend and Volume filters for cleaner signals.
Customize EMA length (default: 200) for trend validation.
Wait for Pattern Confirmation
The indicator constantly scans for valid N-patterns.
A pattern is confirmed only after point D forms (breakout or breakdown).
You’ll see the full pattern drawn with target levels.
Set Alerts
Alerts trigger automatically on confirmation of a bullish or bearish pattern.
You can customize these in TradingView’s alerts panel.

TeeLek-BestPositionThis indicator is used to indicate the best buying and selling points.
This indicator will calculate the best buying points (blue) and selling points (orange). The working principle is that the blue point is the point where the RSI is Over Sold, the orange point is the point where the RSI is Over Bought. After that, we will use the Highest Line 100 and Lowest Line 100 to filter the points another layer. And because when Over Bought/Over Sold occurs, there will be continuous signals that are repeated, causing confusion. Therefore, there is a feature to leave a time frame. Set the default value to 24 hours. If a signal occurs, it will be left out.
The appropriate point for buying is:
The point where Over Sold occurs and Closes lower than the Lowest Line 100.
Leave a time frame for 24 hours before a new signal occurs.
The appropriate point for selling is:
The point where Over Bought occurs and Closes higher than the Highest Line 100.
Leave a time frame for 24 hours before a new signal occurs.
It helps us to gradually buy and collect/sell for profit easily without confusion.
อินดิเคเตอร์นี้ใช้ สำหรับบอกจุดซื้อจุดขายที่ดีที่สุด
อินดิเคเตอร์นี้ จะคำนวณจุดซื้อ (สีฟ้า) และจุดขาย (สีส้ม) ที่ดีที่สุดมาให้ โดยหลักการทำงาน คือ จุดสีฟ้า คือจุดที่ RSI Over Sold จุดสีส้ม คือจุดที่ RSI Over Bought หลังจากนั้นเราจะใช้เส้น Highest Line 100 และ Lowest Line 100 เพื่อกรองจุดอีกชั้นหนึ่ง และเนื่องจากเมื่อเกิด Over Bought/Over Sold แล้ว มันจะเกิดสัญญาณต่อเนื่องซ้ำๆ ทำให้สับสน จึงได้มีฟีเจอร์ในการเว้นระยะเวลา ตั้งค่าไว้เริ่มต้นที่ 24 ชั่วโมง ถ้าเกิดสัญญาณแล้วก็จะเว้นระยะออกไป
จุดที่เหมาะสมกับการซื้อ คือ
จุดที่เกิด Over Sold และ Close ต่ำกว่าเส้น Lowest Line 100
เว้นระยะไป 24 ชั่วโมงจึงจะเกิดสัญญาณใหม่อีกครั้ง
จุดที่เหมาะสมกับการขาย คือ
จุดที่เกิด Over Bought และ Close สูงกว่าเส้น Highest Line 100
เว้นระยะไป 24 ชั่วโมงจึงจะเกิดสัญญาณใหม่อีกครั้ง
ช่วยให้เราสามารถ ทยอยซื้อเก็บสะสม/ทยอยขายทำกำไร ได้ง่ายไม่สับสน

MA Deviation
This indicator visualizes the percentage deviation between up to 3 configurable moving averages (MA), helping traders assess trend momentum and potential overextension.
✅ Key Features
Supports multiple MA types: Choose from SMA, EMA, WMA, RMA, VWMA, and HMA.
Set up to 3 custom MAs with different periods.
Plots the deviation (%) between each pair of selected MAs.
Background color highlights extreme deviations (green = strong positive deviation, red = strong negative deviation).
Data Window flag (1 or 0) shows whether background highlight is active.
⚠️ Notes
Deviation percentages are not predictive, but useful for identifying trend strength or market overheating.
Especially useful for trend analysis, not for exact entry signals.
Even if not all lines are shown, the background color may still appear based on the enabled MA comparisons.
このインジケーターは、3本の移動平均線(MA)の乖離率を視覚化し、相場の過熱感やトレンドの強さを判定するためのツールです。
✅ 主な機能
複数の移動平均タイプに対応:SMA, EMA, WMA, RMA, VWMA, HMAから選択可能。
最大3本の移動平均を自由に設定可能。
それぞれのMA間の乖離率(%)をチャートにプロット。
指定した閾値を超えた時に背景色を表示(緑=乖離が正方向に大きい、赤=負方向に大きい)。
データウィンドウ上で「背景表示フラグ」も確認可能(サインが出ているかどうかが数値で確認できます)。
⚠️ 注意事項
乖離率は過去の価格と比較したものであり、将来の価格を保証するものではありません。
短期トレードよりも、トレンドの強弱や過熱感の把握に適しています。
複数のMAを使用しない場合でも、背景色は他の設定されたMAペアで判定されることにご注意ください。

z-score-calkusi-v1.143z-scores incorporate the moment of N look-back bars to allow future price projection.
z-score = (X - mean)/std.deviation ; X = close
z-scores update with each new close print and with each new bar. Each new bar augments the mean and std.deviation for the N bars considered. The old Nth bar falls away from consideration with each new historical bar.
The indicator allows two other options for X: RSI or Moving Average.
NOTE: While trading use the "price" option only.
The other two options are provided for visualisation of RSI and Moving Average as z-score curves.
Use z-scores to identify tops and bottoms in the future as well as intermediate intersections through which a z-score will pass through with each new close and each new bar.
Draw lines from peaks and troughs in the past through intermediate peaks and troughs to identify projected intersections in the future. The most likely intersections are those that are formed from a line that comes from a peak in the past and another line that comes from a trough in the past. Try getting at least two lines from historical peaks and two lines from historical troughs to pass through a future intersection.
Compute the target intersection price in the future by clicking on the z-score indicator header to see a drag-able horizontal line to drag over the intersection. The target price is the last value displayed in the indicator's status bar after the closing price.
When the indicator header is clicked, a white horizontal drag-able line will appear to allow dragging the line over an intersection that has been drawn on the indicator for a future z-score projection and the associated future closing price.
With each new bar that appears, it is necessary to repeat the procedure of clicking the z-score indicator header to be able to drag the drag-able horizontal line to see the new target price for the selected intersection. The projected price will be different from the current close price providing a price arbitrage in time.
New intermediate peaks and troughs that appear require new lines be drawn from the past through the new intermediate peak to find a new intersection in the future and a new projected price. Since z-score curves are sort of cyclical in nature, it is possible to see where one has to locate a future intersection by drawing lines from past peaks and troughs.
Do not get fixated on any one projected price as the market decides which projected price will be realised. All prospective targets should be manually updated with each new bar.
When the z-score plot moves outside a channel comprised of lines that are drawn from the past, be ready to adjust to new market conditions.
z-score plots that move above the zero line indicate price action that is either rising or ranging. Similarly, z-score plots that move below the zero line indicate price action that is either falling or ranging. Be ready to adjust to new market conditions when z-scores move back and forth across the zero line.
A bar with highest absolute z-score for a cycle screams "reversal approaching" and is followed by a bar with a lower absolute z-score where close price tops and bottoms are realised. This can occur either on the next bar or a few bars later.
The indicator also displays the required N for a Normal(0,1) distribution that can be set for finer granularity for the z-score curve.This works with the Confidence Interval (CI) z-score setting. The default z-score is 1.96 for 95% CI.
Common Confidence Interval z-scores to find N for Normal(0,1) with a Margin of Error (MOE) of 1:
70% 1.036
75% 1.150
80% 1.282
85% 1.440
90% 1.645
95% 1.960
98% 2.326
99% 2.576
99.5% 2.807
99.9% 3.291
99.99% 3.891
99.999% 4.417
9-Jun-2025
Added a feature to display price projection labels at z-score levels 3, 2, 1, 0, -1, -2, 3.
This provides a range for prices available at the current time to help decide whether it is worth entering a trade. If the range of prices from say z=|2| to z=|1| is too narrow, then a trade at the current time may not be worth the risk.
Added plot for z-score moving average.
28-Jun-2025
Added Settings option for # of Std.Deviation level Price Labels to display. The default is 3. Min is 2. Max is 6.
This feature allows likelihood assessment for Fibonacci price projections from higher time frames at lower time frames. A Fibonacci price projection that falls outside |3.x| Std.Deviations is not likely.
Added Settings option for Chart Bar Count and Target Label Offset to allow placement of price labels for the standard z-score levels to the right of the window so that these are still visible in the window.
Target Label Offset allows adjustment of placement of Target Price Label in cases when the Target Price Label is either obscured by the price labels for the standard z-score levels or is too far right to be visible in the window.
9-Jul-2025
z-score 1.142 updates:
Displays in the status line before the close price the range for the selected Std. Deviation levels specified in Settings and |z-zMa|.
When |z-zMa| > |avg(z-zMa)| and zMa rising, |z-zMa| and zMa displays in aqua.
When |z-zMa| > |avg(z-zMa)| and zMa falling, |z-zMa| and zMa displays in red.
When |z-zMa| <= |avg(z-zMa)|, z and zMa display in gray.
z usually crosses over zMa when zMa is gray but not always. So if cross-over occurs when zMa is not gray, it implies a strong move in progress.
Practice makes perfect.
Use this indicator at your own risk

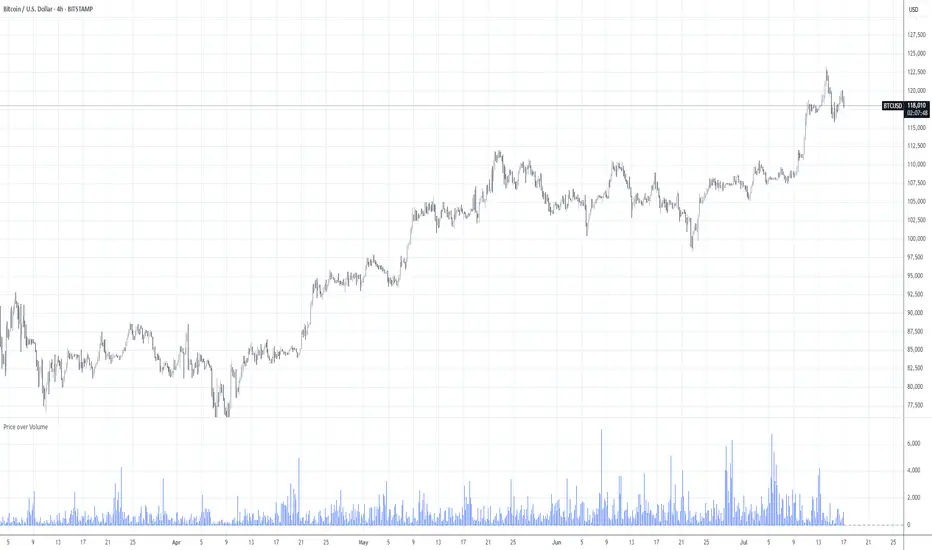
Price over VolumeVersion 0.1
Price over Volume Indicator
Description
The Price over Volume indicator calculates the ratio of the closing price to the trading volume (price / volume) for the current chart's symbol and displays it as a histogram in a separate pane. A horizontal zero line is included as a reference to highlight positive and negative values or periods of undefined data (e.g., zero volume). The indicator is designed to help traders analyze the relationship between price movements and trading volume.
Insights Provided
Price-Volume Dynamics: The indicator shows how price per unit of volume fluctuates, offering insights into market efficiency and liquidity. High ratios may indicate low volume relative to price, suggesting potential volatility or thin markets, while low ratios may reflect high volume supporting price stability.
Trend and Momentum Analysis: Spikes or trends in the price-to-volume ratio can signal significant market events, such as buying/selling pressure or low liquidity periods, helping traders identify potential reversals or continuations.
Zero Line Reference: The zero line helps identify periods where the ratio is undefined (e.g., zero volume) or negative (if applicable), aiding in the interpretation of market conditions.
Volume Sensitivity: By normalizing price by volume, the indicator highlights how volume influences price movements, which is useful for assessing the strength of trends or breakouts.
How to Use
Setup: Apply the indicator to any chart with price and volume data (e.g., stocks, cryptocurrencies like BINANCE:BTCUSDT). The histogram appears in a separate pane below the main chart.
Interpretation :
High Ratios: Indicate low trading volume relative to price, potentially signaling overbought conditions or low liquidity. Use with caution in thin markets.
Low Ratios: Suggest high volume supporting price levels, indicating stronger market participation or stability.
Spikes: Watch for sudden increases in the ratio, which may precede volatility or significant price moves.
Zero Line: Periods where the histogram is absent (due to zero volume) indicate no trading activity, useful for identifying illiquid periods.
Trading Applications:
Confirmation Tool: Combine with other indicators (e.g., RSI, MACD) to confirm trend strength. A rising price-to-volume ratio with a price uptrend may indicate weakening volume support, suggesting a potential reversal.
Volume Analysis: Use alongside volume-based indicators (e.g., OBV, VWAP) to assess whether price movements are backed by sufficient volume.
Scalping/Day Trading: Monitor intraday ratio changes to identify high-impact periods with low volume, which may offer short-term trading opportunities.
Customization: Adjust the histogram color or style (e.g., change to line plot) via the Pine Editor to suit your preferences. Consider adding smoothing (e.g., moving average) for cleaner signals.
Notes
Data Requirements: Ensure the chart’s symbol has valid volume data. Symbols with no volume (e.g., some forex pairs) will result in undefined (na) values.
Limitations: The indicator is sensitive to zero-volume periods, which may cause gaps in the histogram. Use on high-liquidity symbols for best results.
Performance: Lightweight and efficient, suitable for all timeframes.
This indicator is ideal for traders seeking to understand the interplay between price and volume, offering a unique perspective on market dynamics for informed trading decisions.
Trading session High/Low (Lumiere)Trading session High/Low
What it does:
Plots the High and Low for each session (Asia, London, New York) as horizontal zones that “snap” to the first true extreme of the session and then extend right.
Key points:
Snap‑to‑extreme only: Lines don’t draw at the open; they appear only once price makes a new session high or low, and anchor exactly at that bar.
Persistent until next session: Once drawn, each session’s lines stay on the chart after the session ends, and are cleared only when that same session next opens (or when you hide it).
Three configurable sessions:
Asia: 18:00–03:00 (UTC‑4)
London: 03:00–09:30 (UTC‑4)
New York: 09:30–16:00 (UTC‑4)
Customizable appearance:
You can toggle each session on/off, choose its color, and set line width.
The time that is already set on the different sessions is based on the standard session open/close. If you want to change it, it will refer to the NY time, UTC -4.
Advanced Range Theory - ART📊 Advanced Range Theory (ART): The Institutional Blueprint
Stop drawing lines. Start reading the blueprint of the market. Advanced Range Theory (ART) is not another support and resistance indicator; it is a military-grade market structure engine designed to decode the language of institutional capital. It operates on a single, powerful premise: markets move in phases of consolidation and expansion, and the key to anticipation lies in understanding the complete lifecycle of these phases.
ART provides a living, breathing map of the battlefield, identifying institutional accumulation zones and tracking them with unparalleled precision from their inception as "Pending" ranges to their ultimate classification after a breakout. This is your X-ray into the market's skeletal structure.
🔬 THEORETICAL FRAMEWORK: THE ARCHITECTURE OF PRICE ACTION
ART is built on a multi-layered system of logic that moves beyond static levels. It treats ranges as dynamic entities with a narrative—a beginning, a middle, and an end. The core of the system is the dynamic classification engine, which analyzes not just the range, but the character of the price action that resolves it.
1. The Range Lifecycle: From Accumulation to Classification
This is the revolutionary heart of ART. A range's true identity is only revealed by how it is broken.
Phase 1: PENDING (Yellow): A new range is identified based on a period of price consolidation (a "parent" candle followed by a minimum number of "inside" candles). At this stage, it is a neutral zone of potential energy—an area where institutions are likely building positions. It is a question the market has not yet answered.
Phase 2: MITIGATION & CLASSIFICATION: When price breaks out and reaches a calculated extension level, the range is considered "mitigated." At this exact moment, ART analyzes the breakout's DNA to classify the range's true intent:
TYPE 1 - BREAKOUT (Blue): Characterized by a strong, impulsive move with confirming volume. This is a high-conviction breakout, signaling aggressive institutional participation and the likely start of a new trend. It is a statement of intent.
TYPE 2 - REVERSAL (Orange): Occurs when price attempts to break one way but is aggressively rejected, reversing and breaking out the other side. This signals absorption and a "failed auction," often marking significant market turning points.
TYPE 3 - PIVOT (Green): A more balanced breakout, lacking the explosive momentum of a Type 1. This often represents a resolution after a period of indecision or a pivot within a larger trading range.
2. The Hierarchical Map: Source & S/R Levels
ART doesn't just draw boxes; it builds a genealogical map of market structure.
SOURCE LEVEL (Thick Gold Line): This is the "genesis" point—the most recently mitigated range. It acts as the primary point of origin for the current market swing and serves as a critical level for determining overall bias. Price action above the Source is generally bullish; below is bearish.
S/R LEVELS (Cyan Lines): When a range is mitigated, the price level where it broke becomes a key Support/Resistance zone for the future. ART tracks the two most recent S/R levels, as these often act as powerful magnets or rejection points for price.
3. The Multi-Factor Validation Engine
To eliminate noise and focus only on institutionally significant ranges, every potential range must pass a rigorous quality control check:
Time-Based Consolidation: Requires a minimum number of consecutive inside candles (minInsideCandles), ensuring a true period of balance.
Volatility-Based Significance: The range's size must be greater than a multiple of the Average True Range (minRangeSize), filtering out insignificant micro-consolidations.
Participation Confirmation: The parent candle of the range is checked against average volume to ensure there was meaningful activity during its formation.
⚙️ THE COMMAND CONSOLE: CONFIGURING YOUR ART ENGINE
Every input is designed to give you granular control over the detection engine, allowing you to tune ART to any market or timeframe with precision. Each tooltip in the script provides a deep dive, but here is a summary of the core controls.
🎯 ART Detection Engine
Minimum Inside Candles: The soul of the detection algorithm. It defines the minimum number of bars that must be contained within a single "parent" candle to qualify as a range. Higher values (3-4) find major, significant consolidation zones. Lower values (1-2) are more sensitive and will identify shorter-term accumulation patterns.
Extension Multiplier & Fibonacci Extension: These control the profit target projections. The Extension Multiplier uses a simple measured move (e.g., 1.0 = a 1:1 projection of the range's height). The Fibonacci Extension uses the golden ratio (1.618) for harmonically-derived targets.
Mitigation Method (Cross vs. Close): Determines how a breakout is confirmed. Cross is more responsive, triggering as soon as price touches the extension. Close is more conservative, requiring a full candle to close beyond the level, which helps filter out fake-outs from wicks.
Min Range Size (ATR): A crucial noise filter. It ensures that ART ignores tiny, insignificant ranges by requiring a range's height to be a certain multiple of the current market volatility (ATR).
📊 Display & Visual Configuration
These settings give you full control over the visual interface. You can toggle every single element—from the Webb Scanner to the S/R Levels—to create a clean or a comprehensive view. Choose a color theme that suits your charting environment or define a fully custom palette.
🕸️ Webb Analysis Scanner
This is a unique real-time flow analysis tool. It draws dynamic, animated lines from the current price to recent historical points. This visualization helps reveal hidden "tendrils" of momentum and short-term support/resistance that are not immediately obvious, acting as a "sonar" for immediate price flow.
📊 THE ANALYTICS HUB: YOUR DASHBOARD DECODED
The dashboard provides a real-time, at-a-glance intelligence briefing on the current state of market structure as seen by the ART engine.
RANGE METRICS: This section is a "census" of the market's structure. It tells you the total number of ranges identified, how many are still Pending (awaiting a breakout), how many are Unmitigated (active but not yet broken), and how many have been Mitigated (classified and complete).
TYPE BREAKDOWN: This is a powerful gauge of market character. A high count of Type 1 (Breakout) ranges suggests a strong, trending environment. A rising number of Type 2 (Reversal) ranges can signal market exhaustion and potential trend changes. A dominant Type 3 (Pivot) count indicates a balanced, rotational market.
KEY GUIDE: The Large dashboard includes a full legend, so you never have to guess what a line or color represents. It's your built-in user manual.
🎨 DECODING THE BLUEPRINT: A VISUAL INTERPRETATION GUIDE
Every line and color in ART is designed for instant, intuitive understanding.
The Range Lines:
Yellow Lines: A Pending range. This is an active zone of accumulation. Pay close attention.
Colored Lines (Blue/Orange/Green): An unmitigated, classified range. The color tells you its breakout character.
Dotted Lines: A Mitigated range. Its story has been told. These historical levels can still act as support or resistance.
The Identification Zones: These colored boxes appear at a range's origin point after it has been classified. They are the "birth certificate" of the range, permanently marking its type (Breakout, Reversal, or Pivot) and providing an immediate visual history of market behavior.
The Hierarchical Lines:
Thick Gold Line (Source): The most important line on your chart. It is the anchor for your bias.
Cyan Lines (S/R): High-probability decision points. Expect reactions here.
Purple Dotted Lines (Extensions): Logical, calculated profit targets for breaking ranges.
🔧 THE ARCHITECT'S VISION: THE DEVELOPMENT JOURNEY
ART was born from a deep frustration with the static and subjective nature of traditional market structure analysis. Drawing lines by hand is inconsistent, and most indicators are reactive, only confirming what has already happened. The goal was to create a proactive, objective, and dynamic framework that could think about the market in terms of phases and lifecycles.
The breakthrough came from a simple shift in perspective: a range's true character isn't defined when it forms, but by how it resolves. This led to the development of the "post-breakout classification engine," which waits for the market to show its hand before assigning a definitive type. The Webb Scanner was inspired by the desire to visualize the unseen, to create a tool that could feel the immediate "pull" and "push" of price flow. The result is not just an indicator; it is a new language for interpreting price action, built on a foundation of logic, clarity, and precision.
⚠️ RISK DISCLAIMER & BEST PRACTICES
Advanced Range Theory is a professional-grade analytical tool designed to enhance a trader's decision-making process. It does not provide direct buy or sell signals. The levels and classifications it generates are based on historical price action and mathematical probabilities. All trading involves substantial risk, and past performance is not indicative of future results. Always use this tool in conjunction with a robust risk management plan.
"I fear not the man who has practiced 10,000 kicks once, but I fear the man who has practiced one kick 10,000 times."
— Dskyz, Trade with insight. Trade with anticipation.
— Bruce Lee

CVDoogle (CVDoogle Indicator)This is a free simple line indicator that represents Cumulative Volume Delta. The script has been tuned specifically to most popular timeframes to be more accurate of the timeframe of the chart. This may make the line appear less smooth than other indicators, but should be more accurate to the current timeframe of the chart.
This indicator was created to be used along with the following to create a Poor Man's Exochart:
Use Volume Footprint instead of Candles on the TradingView chart
Settings:
Row Size - Auto (ATR)
ATR Length - 9
Display - Cluster
Type - Delta
Add Open Interest Suite - By Leviathan indicator
Timeframes covered by this indicator
15s
30s
1m
2m
3m
5m
6m
10m
12m
15m
24m
30m
45m
1H
2H
3H
4H
5H
6H
8H
12H
1D

7 EMA CloudThe "7 EMA Cloud" script was likely flagged because it reuses the core concept of EMA clouds (shading areas between multiple EMAs to visualize trends, support/resistance, and momentum) without crediting the original inventor, Ripster (author ripster47 on TradingView). This concept is prominently associated with Ripster's "EMA Clouds" indicator, which popularized filling spaces between EMA pairs for trading signals. TradingView's house rules require crediting authors when reusing open-source ideas or code, even if not a direct copy-paste, and mandate significant improvements where the original forms a small proportion of the script. Your version adds features like multiple color modes (Classic rainbow, Monochrome, Heatmap), customizable signal sizes, and crossover alerts between the first and last EMA, which are enhancements, but the foundational EMA ribbon/cloud idea needs explicit attribution in the description and ideally code comments to comply.
Additionally, the description might be seen as not fully self-contained (e.g., it uses promotional language like "Advanced" and "Adaptive Trend & Signal Suite" without deeply explaining calculations or use cases), potentially violating rules against relying on code or external references for clarity.
To fix this, republish a new version with proper credits, ensure the description is detailed and standalone, and emphasize your improvements (e.g., the 7 Fibonacci-based EMAs, color modes, and signals). Do not reuse the flagged script—create a fresh one. Here's a compliant description you can use:
7 EMA Cloud Indicator
Overview
The 7 EMA Cloud overlays seven exponential moving averages (EMAs) with Fibonacci-inspired periods and fills the spaces between them with customizable "clouds" to visually represent trend strength, direction, and convergence/divergence. It includes crossover signals between the shortest and longest EMAs for potential entry/exit points, with adjustable visual modes for different trading styles. This helps traders identify bullish/bearish momentum, support/resistance zones, and overextensions in trending or ranging markets.
This script builds on the EMA cloud concept popularized by Ripster (ripster47) in their "EMA Clouds" indicatortradingview.com, where areas between EMA pairs are shaded for trend analysis. Improvements include a fixed set of 7 Fibonacci EMAs, multiple color schemes (Classic rainbow, Monochrome grayscale, Heatmap for intensity), user-selectable signal sizes, and transparency controls. Released under the Mozilla Public License 2.0.
Key Features
7 EMAs with Clouds: EMAs at periods 8, 13, 21, 34, 55, 89, and 144; clouds filled between consecutive pairs to show alignment (tight clouds for consolidation, wide for trends).
Color Modes:
Classic: Rainbow gradients (blue to purple) for vibrant distinction.
Monochrome: Grayscale shades for minimalistic charts.
Heatmap: Red-to-blue spectrum to highlight "hot" (volatile) vs. "cool" (stable) areas.
Crossover Signals: Triangle markers (up for bullish, down for bearish) when the shortest EMA crosses the longest; sizes from Tiny to Huge.
Display Options: Toggle EMA lines on/off, adjust cloud transparency (0-100%), and enable alerts for crossovers.
Alerts: Notifications for "Bullish EMA Crossover" (EMA1 > EMA7) and "Bearish EMA Crossover" (EMA1 < EMA7).
How It Works
EMA Calculations: Each EMA is computed using ta.ema(close, period), with periods based on Fibonacci sequences for natural market rhythm alignment.
Clouds: Filled via fill() between plot pairs, with colors derived from the selected mode and transparency applied.
Signals: Detected with ta.crossover(ema1, ema7) and ta.crossunder(ema1, ema7), plotted as shapes with mode-specific colors (e.g., green/lime for bull, red for bear).
Customization: Inputs grouped into EMA Settings (periods), Display Settings (visibility, colors, transparency), and Signal Settings (size).
Customization Options
EMA Periods: Individually adjustable (defaults: 8, 13, 21, 34, 55, 89, 144).
Show EMAs: Toggle to hide lines and focus on clouds.
Cloud Transparency: 0% for solid fills, 100% for invisible (default 80%).
Color Mode: Switch between Classic, Monochrome, or Heatmap.
Signal Size: Tiny, Small, Normal, Large, or Huge for crossover markers.
Ideal Use Case
Suited for swing or trend-following on any timeframe (e.g., 15m-1h for intraday, daily for swings) and assets (stocks, forex, crypto, futures). Enter long on bullish crossovers above aligned clouds; exit on bearish signals or cloud widenings. Use Monochrome for clean charts or Heatmap for volatility emphasis. Combine with volume or RSI for confirmation.
Why It's Valuable
By expanding Ripster's EMA cloud idea with multi-mode visuals and integrated signals, this indicator provides a versatile, at-a-glance tool for trend assessment—reducing noise while highlighting key shifts. It's more adaptive than basic MA ribbons, with Fibonacci periods adding a layer of harmonic analysis.
Note: Test on historical data or demo accounts. Not financial advice—incorporate risk management. Optimized for Pine Script v5; some features may vary on non-overlay charts.

TMA Lock - Triple Moving Averages with Timeframe ControlKeep your 50, 100, and 200-day moving averages consistent across all chart timeframes! No more recalculating MAs when switching from daily to hourly charts.
Key Features:
Timeframe Lock - MAs stay true to your selected timeframe (daily, weekly, etc.) regardless of chart view
Fully Customizable - Adjust periods, colors, line styles, and smoothing strength
