Auto-Calculated Pivot Line/Zone (Based on Time Range)Automatically Calculated Pivot Line/Zone
Harness the power of precision with this Custom Time Range Average Line indicator—designed to pinpoint key equilibrium and pivot levels within consolidation zones after a breakout. Select any start and end time to capture the critical price action shaping the market structure between swings, and calculate the true average price using your choice of open, close, high, low, or midpoint.
Once the defined period concludes, the indicator freezes the average and extends it forward as a clear horizontal ray, acting as a powerful reference for fair value and market balance. This dynamic line shines brightest within consolidation phases, helping traders identify pivot points and equilibrium zones that often serve as magnets for price after a breakout.
Customize the line width to suit your style—use a thinner line width input for a precise single average line, or increase the width to visually represent a broader range or zone. Fully adjustable line color and thickness options ensure this tool integrates seamlessly into any chart setup.
Elevate your trading edge by visualizing the hidden balance points between market swings—turning consolidation chaos into clear, strategic opportunities!
Indicators and strategies

Entry Signal Paint (RSI + DMI + Stoch + MACD)RSI above 60
Stoch - cross overslod
DMI - Ungli
// === RSI Condition ===
rsi = ta.rsi(rsiSource, rsiPeriod)
rsiCondition = rsi > 60
// === ADX and DI Condition ===
adx = ta.adx(adxPeriod)
plusDI = ta.plus_di(adxPeriod)
minusDI = ta.minus_di(adxPeriod)
adxCondition = adx > 15 and plusDI > minusDI
// === Stochastic Condition ===
k = ta.stoch(close, high, low, stochK)
d = ta.sma(k, stochD)
stochOversoldCross = ta.crossover(k, d) and k < 20

TZanalyserTZanalyser (Trend Zone Monitor With Trend Strength, Volume Focus And -Events Markers)
Before I used TrendZones to manage my portfolio I used Fibonacci Zone Oscillator as my favorite in the sub panel, accompanied with another subpanel indicator which I never published called IncliValue and also REVE Cohorts.
TZanalyser inherits Ideas and code from all three of them: The visual and the idea of using a channel as the basis for an oscillator depicted as a histogram, is taken from the FibZone Oscillator. The idea of providing a number to evaluate the trend is taken from IncliValue. The idea to create a horizontal line which indicates high and low volume focus completed with markers for volume events, is taken from REVE-cohorts.
These ideas are combined in one sleek visual called TZanalyser. TZ stand for TrendZones, because the histogram is based on it.
The histogram.
Depicted is the distance of the price from COG as percent. The distance between Upper Curve and Lower Curve is used as 100%. The values may reach between 300 and -300. The colors indicate in which zone the candle lives, blue in the blue zone, green in the green zone etc. Despite the absence of a gray zone, there are gray bars. These depict candles that wrap around COG. Because hl2 is used as price, some gray bars point up and others down. The orange and red bars point down because the orange and red downtrend zones are below COG.
Use of the histogram.
Sometimes I need to create a list of stocks which are in uptrend in monthly, weekly and daily charts from the stocks I follow in my universe. This job is done fast and easy by looking at the last bar of the histogram. The histogram also gives a quick evaluation of how the stock fared in the past.
The number.
Suppose I need to allocate some money to another stock, selected a few, looked into news and gurus and they look equally good. Then it is nice to be able to find out which has the best charts. Which one has the strongest uptrend. For this purpose this number can be consulted, because it indicates somehow the strength of the trend. It is an integer between 20 and -20, the closer to 20 the stronger the uptrend, closer to -20 indicates a stronger downtrend. The color of the background is the same as the last column of the histogram.
Volume focus and events
The horizontal lines depict volume focus, the line below the focus that comes with the uptrend columns pointing up, the one above the focus for the downtrend columns pointing down. Thes line have tree colors: maroon for high volume focus, green for normal volume and gray for low volume situations. Between the lines and the histogram triangles appear at volume events, a green triangle when the candle comes with high volume, i.e. 120-200 percent of normal, maroon when extreme volume, i.e. more than 200 percent of normal.
The direction of these triangles is that of the histogram, i.e. when the price is higher, direction is up and vice versa.
Take care and have fun.

Auto Fibonaccing File MignonScript with Fibonaccing and File Mignon from Marco Rossi, plots the maximums and minimums of 5 days ago as a reference

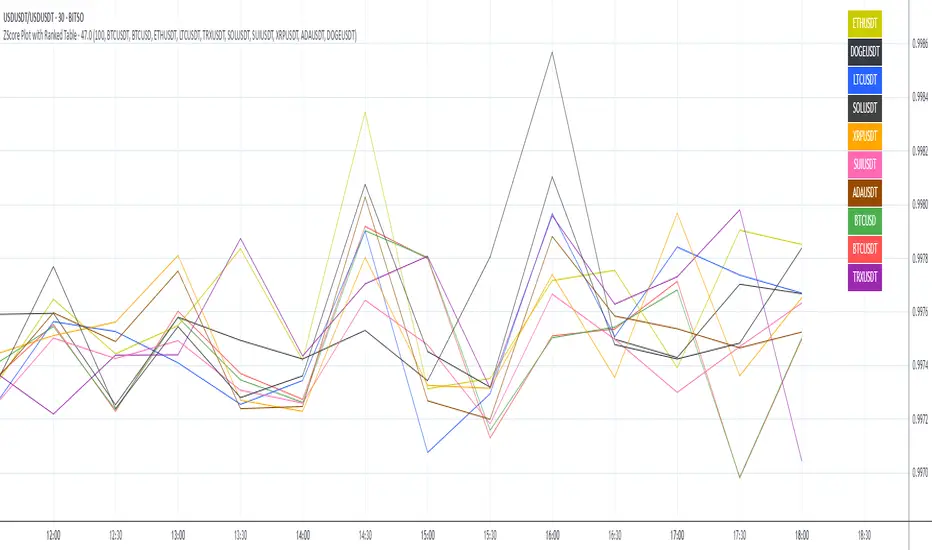
ZScore Plot with Ranked TableVersion 0.1
ZScore Plot with Ranked Table — Overview
This indicator visualizes the rolling ZScores of up to 10 crypto assets, giving traders a normalized view of log return deviations over time. It's designed for volatility analysis, anomaly detection, and clustering of asset behavior.
🎯 Purpose
• Show how each asset's performance deviates from its historical mean
• Identify potential overbought/oversold conditions across assets
• Provide a ranked leaderboard to compare asset behavior instantly
⚙️ Inputs
• Lookback: Number of bars to calculate mean and standard deviation
• Asset 1–10: Choose up to 10 symbols (e.g. BTCUSDT, ETHUSDT)
📈 Outputs
• ZScore Lines: Each asset plotted on a normalized scale (mean = 0, SD = 1)
• End-of-Line Labels: Asset names displayed at latest bar
• Leaderboard Table: Ranked list (top-right) showing:
◦ Asset name (color-matched)
◦ Final ZScore (rounded to 3 decimals)
🧠 Use Cases
• Quantitative traders seeking cross-asset momentum snapshots
• Signal engineers tracking volatility clusters
• Risk managers monitoring outliers and systemic shifts
Z-Score Multi-Model ClusteringA price/volume clustering framework combining three market behavior models into a single indicator. Designed to help identify emerging trend strength, turning points, and volatility-driven entries or exits.
🔍 How It Works
This indicator classifies market states by comparing normalized price/volume behavior (via Z-Score) to different types of statistical or geometric "cluster centers." You can choose from three clustering approaches:
🧠 Clustering Models
1. Percentile (Z+CVD) – Trend Momentum Bias
Uses volume Z-Score + Cumulative Volume Delta (CVD).
Detects institutional pressure by clustering volume surges with directional delta.
Best for: Breakouts, momentum trades, volume-led reversals.
Cluster Colors:
🔹 Green triangle = Strong bullish confluence
🔻 Red triangle = Bearish divergence (bull trap risk)
⚪ Gray = Neutral/low conviction
2. Euclidean (Z+Slope) – Swing Mean-Reversion
Measures the angle of recent Z-score slope and compares it to directional cluster centers.
Helps detect early directional shifts or exhaustion.
Best for: Swing entries, pullback setups, exit timing
3. Hilbert Phase – Turn Detection via Signal Phase
Applies Hilbert Transform to the Z-Score, measuring the phase difference between trend and oscillator components.
Ideal for anticipating turns or detecting cyclical inflection points.
Useful for: Scalping, top/bottom spotting, volatility fades
✅ Features
Auto-updating cluster logic based on current data
Tooltips and clean user interface
Optional cluster bar coloring (can be toggled off)
Signal-only plotting keeps candlesticks readable
Clear entry/exit logic with triangle markers
Supports trend, swing, and oscillation-based systems
🛠️ Suggested Use Cases
Combine with VWAP, Session High/Low, or Liquidity Zones to confirm entry conditions.
Use Cluster 2 (strong bullish) on pullbacks to trend structure for add-on entries.
Use Cluster 1 in strong trends to watch for potential traps or exits.
Toggle models based on your strategy: e.g., Hilbert for scalping, Percentile for macro trend breaks.
🧪 Best Timeframes
Works across all markets and timeframes
For Percentile (Z+CVD), use intraday TF with 1m–5m CVD source
Hilbert and Euclidean preferred on 5m–1h for accurate slope/phase signals
⚠️ Notes
Clusters do not generate trade signals alone; use them in context with structure, VWAP, or trend filters.
Marker signals are filtered with a magnitude threshold to reduce noise.

MACD + 1m EMA Zone FilterFeature Description
Run on Any Chart Works on any timeframe — 5m, 15m, 1h, etc.
MACD Crosses Detected on the current chart's timeframe
EMA Logic All EMA20/50/100/200 come from 1-minute timeframe
Buy Signal MACD crossover + all EMAs (1m) above EMA200
Sell Signal MACD crossunder + all EMAs (1m) below EMA200
Chart Arrows BUY/SELL arrows plotted at each signal
Alerts Configurable alerts for Buy/Sell conditions

Multi-Equity Performance TableThis indicator tracks 5 equities/stocks/crytpo across multiple timeframes: 24h, 1W, 1M, 3M, 6M, 1Y. You can use AI to modify the code to track more equities but then you will need to use less timeframes. I used Claude.ai to configure this code.

SMI Panel (kolupaiev)Stochastic Momentum + table trand + alerts
The indicator is composed of STOCHASTIC and MOMENTUM.
A table for tracking the trend on higher timeframes (1D and 1W) has also been added.
Notifications can be configured to follow the trend.

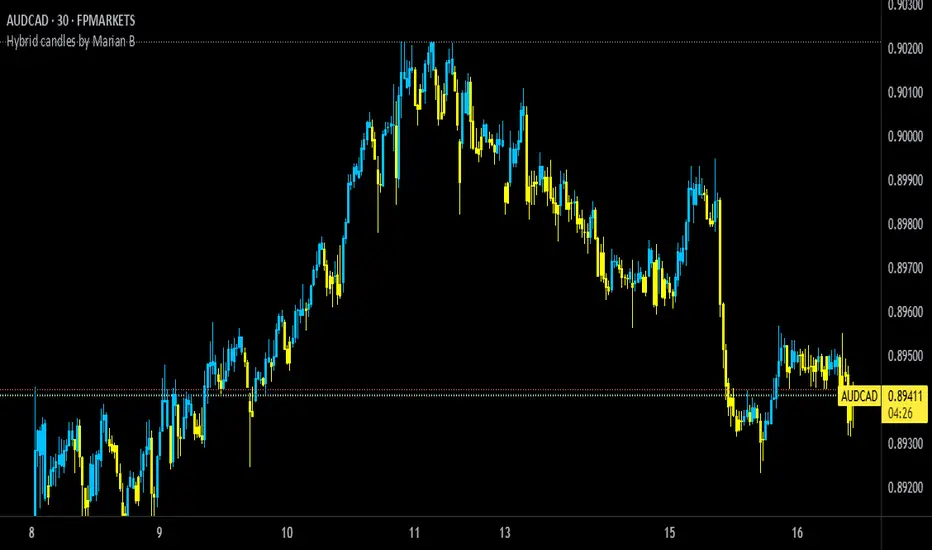
Hybrid candles by Marian BDescription
-------------
This script it does a very simple thing: it will color the candles according to the HeikenAshi rules.
It will keep the regular candle shape, but with the HeikenAshi colors. Some traders find it useful, especially those using the ATS methodology.
Originality
-------------
This script is not at all orginal and it will not make you win trades. There are a few others out there, but I could not find a public one that also colors the wicks; most of them just handle the color of the candle body.
Chart
-------
See a sample screenshot how it will look like.
Position Size Calculator with ATR & Tick Risk Management Position Size Calculator with ATR & Tick Risk Management
This script calculates your optimal position size based on your account size, risk per trade, and either a fixed tick-based stop loss or the Average True Range (ATR) for dynamic risk control.
🔹 Flexible Risk Input : Choose between fixed ticks or ATR (Average True Range) as your risk measure
🔹 Precise Position Sizing : Calculates the maximum number of units you can trade while respecting your risk limit
🔹 Clear Table Display : Shows key values like total position size, risk in cents, ATR in ticks, and 40% / 80% partial take-profit levels
🔹 No Chart Clutter : The script runs in the background and does not plot on the chart
Perfect for traders who want to manage risk efficiently and objectively , whether trading stocks, futures, or CFDs.
⚙️ Customizable Inputs:
Account Size
Risk per Trade
Tick Risk (if ATR is disabled)
ATR Length & Multiplier (if ATR is enabled)

Candle Size TableLast 3 Candle Stats – High, Low, Volume & Size
Description:
This intraday trading tool displays the High, Low, Volume, and Size (range) of the last 3 candles on your chart, providing a quick and clear reference for short-term momentum, volatility, and potential trade decisions.
Designed for scalpers and day traders, this indicator helps you:
Gauge momentum shifts by tracking how candle size and volume evolve.
Identify exhaustion or continuation patterns by comparing recent candle ranges.
Define entries and exits with more precision based on real-time market activity.
The candle size is calculated as the absolute difference between the high and low of each candle, making it easy to spot expanding or contracting price action.
Use this as a complementary tool with your price action strategy to enhance timing and confidence in fast-moving markets.

KIORI - VWAP mit StdDev + 0,25 Bändern🎯 VWAP Enhanced - Professional Standard Deviation Bands with Precision Zones
This advanced VWAP indicator provides comprehensive price movement analysis through multi-layered standard deviation bands with additional 0.25 precision zones.
🔥 Key Features:
VWAP core line (blue) - Volume Weighted Average Price
3-tier standard deviation bands (1x, 2x, 3x) with individual color coding
0.25 precision zones around EVERY standard deviation line (above/below)
Complete band filling for better visual orientation
Flexible anchor periods (Session, Week, Month, Quarter, Year, Earnings, Dividends, Splits)
📊 Color Coding:
🔵 VWAP + 0.25 zones (Light Blue)
🟢 1x StdDev + 0.25 zones (Green/Light Green)
🟡 2x StdDev + 0.25 zones (Yellow/Light Yellow)
🔴 3x StdDev + 0.25 zones (Red/Light Red)
⚡ Trading Applications:
Support/Resistance at standard deviation lines
Precise entry/exit points through 0.25 zones
Volatility measurement across multiple levels
Mean-reversion strategies with clear target areas
Breakout detection when exceeding outer bands
🎨 Optimized for:
Day trading and scalping
Swing trading strategies
Volatility-based positioning
Multi-timeframe analysis
This indicator combines proven VWAP methodology with high-precision standard deviation zones, providing traders with a professional tool for precise market analysis and positioning

Light MA CrossWhy Use the "GOLDGoalGO" Indicator?
Are you looking for a reliable tool to enhance your gold trading strategy?
Introducing "GOLDGoalGO", a smart and easy-to-use indicator specifically designed to help traders make informed decisions in the gold market.
What Makes "GOLDGoalGO" Stand Out?
* Tailored for Gold (XAUUSD):
Specially optimized to detect crucial trend changes in gold prices, offering you timely signals to buy or sell.
* Precise Entry Points:
Uses smart moving average crossovers to identify the best moments for entry and exit, reducing guessing and improving profitability.
* Real-Time Alerts:
Get instant notifications when buy or sell signals occur—whether you're at your desk or on the go. Never miss a critical trading opportunity again!
* Easy to Use:
Clear visual signals on your chart show exactly when the market is favorable, perfect for both beginners and experienced traders.
* Ideal for Short-Term Trading:
Designed to generate signals on 1-minute charts, helping you capitalize on quick market movements in the fast-paced gold market.
Why Trader's Love It:
* Increase Confidence:
Making trade decisions becomes easier with accurate signals specific to gold trends.
* Save Time:
Automate your analysis—spend less time guessing and more time trading confidently.
* Maximize Profits:
Spot those crucial moments when the price movement is about to turn, giving you a competitive edge.
Start Using "GOLDGoalGO" Today!
Whether you're looking to refine your short-term trading strategy or want a trustworthy tool to guide your trades in gold markets, "GOLDGoalGO" is the perfect addition to your trading arsenal. Try it now and watch your trading confidence and results improve!

Multi Ranges Volume Distribution [LuxAlgo]The Multi Ranges Volume Distribution tool allows traders to see the volume distribution by price for three different timeframes simultaneously. Each distribution can report the total amount of accumulated volume or the accumulated buy/sell volume separately.
Levels are displayed at the top and bottom of each timeframe's range, as well as the POC or level with the most volume.
🔶 USAGE
By default, the tool displays daily, weekly, and monthly volume distributions, highlighting the accumulated volume within each row.
Each distribution shows the volume at each price, as well as three lines: the top and bottom prices, and the price at which the most volume was traded.
The reported accumulated volume can be useful for highlighting which price areas are of the most interest to traders, with the specific timeframe specifying whether this interest is long-term or short-term.
🔹 Timeframes & Rows
Traders can adjust the timeframe and the number of rows for each volume distribution.
This is useful for multi-timeframe analysis of volume at the same price levels, or for obtaining detailed data within the same timeframe.
The chart above shows three volume distributions with the same monthly timeframe but a different number of rows; each is more detailed than the previous one.
🔹 Total vs Buy & Sell Volume
Traders can choose to display either the total volume or the buy and sell volumes.
As we can see on the above chart, the background of each row uses a gradient that is a function of the delta between the buy and sell volumes.
This is useful to determine which areas attract buyers and sellers.
🔶 SETTINGS
Volume Display: Select between total volume and buy and sell volume.
Distance between each box: Adjust the spacing of the volume distributions.
Period A: Select a timeframe and the number of rows.
Period B: Select a timeframe and the number of rows.
Period C: Select a timeframe and the number of rows.

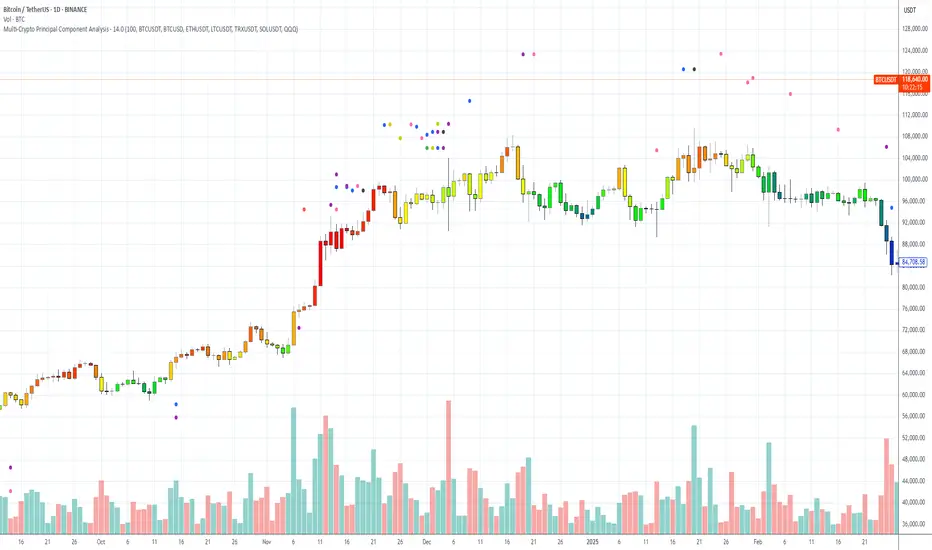
Multi-Crypto Principal Component AnalysisVersion 0.2
## 📌 Multi-Crypto Principal Component Analysis (PCA) — Indicator Summary
### 🎯 Purpose
This indicator identifies **cryptocurrency assets that are behaving differently** from the rest of the market, using a simplified approach inspired by Principal Component Analysis (PCA). It’s designed to help traders spot **cross-market divergences**, detect outliers, and improve asset selection and correlation-based strategies.
### ⚙️ How It Works
The indicator analyzes the **log returns** of up to 7 user-defined assets over a configurable lookback period (default: 100 bars). It computes the **z-score** (standardized deviation) for each asset’s return series and compares it against the average behavior of the group.
If an asset’s behavior deviates significantly (beyond a threshold of 1.5 standard deviations), it’s flagged as an **outlier**.
- Each outlier is plotted as a **colored dot horizontally spaced** above the price bar
- Up to **3 dots per bar** are shown for visual clarity
This PCA-style detection works in real time, directly on the chart, and gives you a quick overview of which assets are breaking correlation.
### 🔧 Inputs
- 🕒 **Lookback Period**: Number of bars to analyze (default: 100)
- 🔢 **Assets 1–7**: Choose any 7 crypto symbols from any exchange
- 🎨 **Colors**: Predefined per asset (e.g. BTCUSDT = red, ETHUSDT = yellow)
- 📈 **Threshold**: Internal (1.5 std dev); adjustable in code if needed
### 📊 Outputs
- 🟢 Dots above candles representing assets that are acting as outliers
- 🧠 Real-time clustering insight based on statistical deviation
- 🧭 Spatially spaced dots to avoid visual overlap when multiple outliers appear
### ⚠️ Limitations
- This is a **PCA-inspired approximation**, not true matrix-based PCA
- It does **not compute principal components or eigenvectors**
- Sensitivity may vary with asset volatility or sparse trading data
- Real PCA requires external tools like Python or R for full dimensional analysis
This tool is ideal for traders who want real-time crypto correlation insights without needing external data science platforms. It’s lightweight, fast, and highly visual — and gives you a powerful lens into market dislocations across multiple assets.
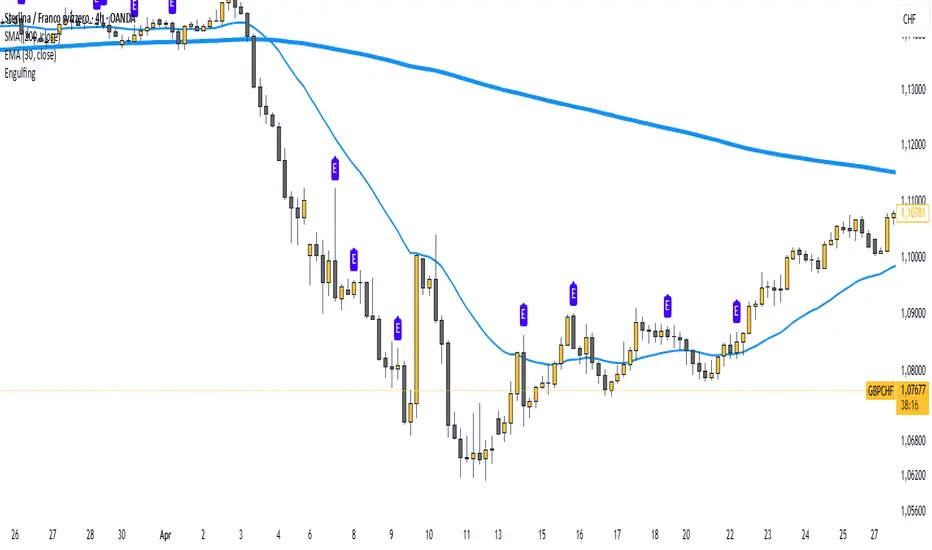
Body Engulfing Detector🔶 Body Engulfing Detector
This simple but effective indicator identifies candlestick patterns where the entire body of the current candle engulfs the body of the previous one — a classic signal of a potential reversal or momentum continuation.
🔍 What It Does:
Detects when the body (open-close range) of the current candle completely covers the body of the previous candle.
Triggers a visual signal on the chart once the candle is closed, avoiding premature alerts.
Includes a generic alert you can enable from the TradingView alert system, so you’ll be notified as soon as a body engulfing pattern occurs.
📈 Use Case:
This pattern can be interpreted as a shift in market sentiment and may signal a possible entry point depending on the context:
Use it as part of your price action strategy.
Combine it with trend analysis, volume, or other confirmation tools.
⚠️ This indicator focuses only on body engulfing and does not require the candle to be bullish or bearish specifically. If you'd like a version that distinguishes between bullish and bearish engulfing, feel free to request it.
Spread AnalysisSpread Analysis - Futures vs Spot Price Analysis
Advanced spread analysis tool that compares futures/perp prices with spot prices across multiple exchanges, providing insights into market sentiment and potential trading opportunities.
Multi-Asset Support: Automatically detects and analyzes crypto perpetual vs spot spreads, index futures vs cash indices (ES/SPX, NQ/NDX, YM/DJI), and commodity futures vs spot prices (GC/GOLD, CL/USOIL)
Multi-Exchange Aggregation: For crypto, aggregates prices from Binance, BitMEX, Kraken, Bybit, OKX, and Coinbase to calculate mean perp and spot prices
Z-Score Based Alerts: Uses statistical Z-score analysis to identify extreme spread conditions that may signal potential reversals or continuation patterns
Visual Histogram Display: Shows spread differences as colored columns - green for futures premium, red for futures discount
Flexible Calculation Methods: Supports absolute price differences, percentage spreads, or basis point calculations
Trading Applications: Identify market sentiment divergence, spot potential reversal opportunities, and confirm trend strength
Risk Management: Use extreme Z-scores to identify overvalued conditions and potential mean reversion setups
Market Analysis: Understand the relationship between futures and spot markets across different asset classes
Timing Tool: Spread momentum often precedes price moves, providing early signals for entry/exit decisions
Perfect for traders who want to understand the relationship between futures and spot markets, identify divergences, and spot potential reversal opportunities across crypto, indices, and commodities.
Key Features:
• Automatic asset detection and appropriate spread calculation
• Configurable Z-score alerts for extreme conditions
• Comprehensive tooltips and information guide
• Multiple calculation methods (absolute, percentage, basis points)
• Clean, customizable visual display
Use Cases:
• Crypto traders analyzing perp vs spot relationships
• Futures traders monitoring basis relationships
• Mean reversion strategies using extreme spreads
• Trend confirmation using spread momentum
• Market sentiment analysis across asset classes

Logios Traders Pro v1## 📈 Logios Traders Pro v1 – EMA Crossover + Signal Candle Extensions
**Logios Traders Pro v1** is a powerful and clean EMA crossover-based tool designed for traders who want precise entry zones, trend clarity, and support/resistance validation — all in one lightweight overlay.
### 🔍 Features:
* **Customizable Fast and Slow EMAs**
Set your preferred EMA lengths to generate Buy/Sell signals based on crossovers.
* **Signal Candle High/Low Extensions**
Each Buy/Sell signal marks the high and low of the signal candle and projects them forward as horizontal levels. These act as **dynamic support/resistance zones**, and extend until broken by price.
* **Trend EMA (e.g., EMA 50)**
An optional third EMA is displayed by default to help filter trades with the broader trend. Its length is also fully customizable.
* **Smart Visuals**
* Signal markers (`Buy` / `Sell`) with clean labels.
* Background coloring and EMA plots are optional and customizable.
* Alert-ready for both buy and sell conditions.
### ✅ Best Used For:
* Trend-following or reversal setups.
* Retest entries off signal candle zones.
* Entry confirmation aligned with trend direction (using the 50 EMA).
---
### ⚙️ Inputs:
* Fast EMA Length (default: 5)
* Slow EMA Length (default: 9)
* Trend EMA Length (default: 50)
---
Whether you're a scalper, intraday trader, or swing trader, **Logios Traders Pro v1** gives you high-precision insight into the market’s structure and key entry zones.
---

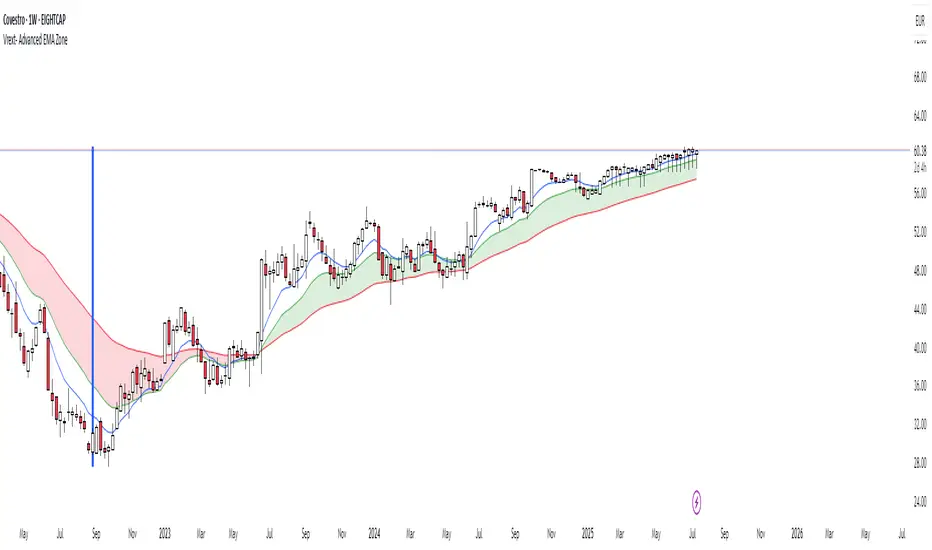
Vrext- Advanced EMA ZoneThe indicator highlights an area between two manually adjustable EMA-s to visibly mark a zone. A zone where the larger EMA is bellow the smaller one (indicating an uptrend) is marked green. On the opposite hand where higher EMA is above the lower the zone (indicating a downtrend) is marked red.
For correct zone marking enter EMA-s in descending order.
The indicator also allows you to add further additional EMA-s, which do not have a zone drawn between them and are just stand alone EMA-s. They are fully customisable in terms of colour, width. etc.
Additionally the indicator allows you to plot a vertical line ''xyz'' candles in the past. The idea behind it is that if you want to only focus on the previous 150 candles, there will be a clear line at the 150th candle for easier navigating.
ICT Time CaptureICT 8am High/Low + 9am Capture (NY Time) — Fixed 1H
This indicator marks the High and Low of the 8am candle on the 1-hour timeframe fixed to New York time (America/New_York timezone). It also draws a line for the 9am candle open and indicates if the 9am candle “captured” (broke above or below) the 8am High or Low.
Key Features:
Always uses 1-hour data fixed on New York timezone, regardless of the chart’s current timeframe.
Draws horizontal lines for the 8am High and Low, with configurable colors, styles (solid/dashed), thickness, and extension length.
Draws a horizontal line for the 9am open price with customizable style.
Shows labels with price values explaining the lines.
Shows a capture label when the 9am candle breaks above the 8am high or below the 8am low.
Allows full customization of label text colors, line colors, line styles, thickness, and label distances from line start.
How to use:
Use this indicator to monitor key ICT timeframes (8am and 9am NY time) for intraday price action clues.
The capture labels help identify when price breaks key levels from the 8am candle during the 9am candle.
The configurable style options let you customize the indicator to your chart style.

GOLDGOGOSIG - 1 Min MA CrossoverWhy Use the "GOLDGoalGO" Indicator?
Are you looking for a reliable tool to enhance your gold trading strategy?
Introducing "GOLDGoalGO", a smart and easy-to-use indicator specifically designed to help traders make informed decisions in the gold market.
What Makes "GOLDGoalGO" Stand Out?
* Tailored for Gold (XAUUSD):
Specially optimized to detect crucial trend changes in gold prices, offering you timely signals to buy or sell.
* Precise Entry Points:
Uses smart moving average crossovers to identify the best moments for entry and exit, reducing guessing and improving profitability.
* Real-Time Alerts:
Get instant notifications when buy or sell signals occur—whether you're at your desk or on the go. Never miss a critical trading opportunity again!
* Easy to Use:
Clear visual signals on your chart show exactly when the market is favorable, perfect for both beginners and experienced traders.
* Ideal for Short-Term Trading:
Designed to generate signals on 1-minute charts, helping you capitalize on quick market movements in the fast-paced gold market.
Why Trader's Love It:
* Increase Confidence:
Making trade decisions becomes easier with accurate signals specific to gold trends.
* Save Time:
Automate your analysis—spend less time guessing and more time trading confidently.
* Maximize Profits:
Spot those crucial moments when the price movement is about to turn, giving you a competitive edge.
Start Using "GOLDGoalGO" Today!
Whether you're looking to refine your short-term trading strategy or want a trustworthy tool to guide your trades in gold markets, "GOLDGoalGO" is the perfect addition to your trading arsenal. Try it now and watch your trading confidence and results improve!
