VampFX Kill Zone🦇 VampFX Kill Zone Indicator
Built for Smart Money Traders by Vamp FX
This custom Kill Zone tool highlights the optimal institutional trading window — when volume, liquidity, and precision align.
🔹 What It Does:
• Shades the VampFX Kill Zone (default: 8:00 AM to 12:30 PM UTC-4 / New York)
• Designed for New York session scalping/sniping
• Helps isolate high-probability Smart Money setups (liquidity sweeps, FVGs, BOS entries)
🔧 Default Settings:
• Timezone: UTC -4 (New York)
• Session Start: 08:00
• Session End: 12:30
• Adjustable to fit your strategy or local session bias
⸻
📈 Why Use It:
The VampFX Kill Zone reflects when algos run, liquidity gets manipulated, and clean entries occur.
Avoid noise — trade when the market actually moves.
“We don’t chase the market. We wait inside the zone… then strike with precision.”
— 🦇 VampFX Code
Indicators and strategies

Horizontal Lines [Vynkron]📄 Script Description – "Horizontal Lines "
This Pine Script v6 indicator draws up to 11 customizable horizontal lines on your chart, ideal for marking round levels, support/resistance zones, or psychological price points (e.g. every 100 points on the NQ).
🔧 Features:
11 price inputs (default: 22000 to 23000, step 100)
Single color, width, and style configuration for all lines
Uses hline() so lines are fixed across the full chart
Easy to adjust or toggle lines individually
💡 Use Cases:
Highlighting round-number levels on instruments like Nasdaq 100 Futures
Visualizing major price zones
Manual technical analysis without scripting loops
Let me know if you want to make it dynamic, add labels, or only draw lines within the visible chart range.

USDT + USDC Dominance USDT + USDC Dominance: This refers to the combined market capitalization of Tether (USDT) and USD Coin (USDC) as a percentage of the total cryptocurrency market capitalization. It measures the proportion of the crypto market held by these stablecoins, which are pegged to the US dollar. High dominance indicates a "risk-off" sentiment, where investors hold stablecoins for safety during market uncertainty. A drop in dominance suggests capital is flowing into riskier assets like altcoins, often signaling a bullish market or the start of an "alt season.

Sniper Mini VWAPThis script plots dynamic, session-based VWAPs for key intraday timeframes:
1H (green), 4H (orange), 8H (purple), and Daily (red).
Each VWAP resets at the start of its own session, giving traders a real-time view of price relative to average volume-weighted value. These lines often act as intraday support, resistance, or liquidity magnets — great for scalping, fade setups, and sniper-style entries.
You can toggle each VWAP on or off for a cleaner chart.
This version does not use anchored VWAPs — it’s designed for traders who need fast feedback as price develops within active sessions.

Profitable Loser Model [MMT]Profitable Loser Model
Overview
The Profitable Loser Model is a powerful PineScript v6 indicator designed to enhance your trading by visualizing key price levels, session open zones, Fibonacci retracements, and premium/discount zones. This overlay indicator provides traders with a customizable toolkit to analyze market structure across any timeframe, making it ideal for intraday and swing trading strategies.
Features
Open Zone Visualization
- Plots a box based on the open and close of the first candle in a user-defined timeframe (default: 5-minute).
- Customizable box color, projection offset, and label size (Tiny, Small, Normal, Large).
- Displays a timeframe label (e.g., "5m Open Zone") for quick reference, toggleable on/off.
Session Open Lines
- Optionally draws horizontal lines at key session opens (8:30 AM, 9:30 AM, 1:30 PM, Midnight, New York time).
- Customize line color, style (Solid, Dashed, Dotted), width, and label size for each session.
- Perfect for identifying critical intraday price levels.
Premium and Discount Zones
- Highlights premium (above midpoint) and discount (below midpoint) zones based on session high/low.
- Toggleable with customizable colors and projection offsets.
- Helps traders spot overbought/oversold areas for potential mean-reversion trades.
Fibonacci Retracement Levels
- Plots user-defined Fibonacci levels (default: 0.23, 0.35, 0.5, 0.62, 0.705, 0.79, 0.886, 1, 1.1).
- Customizable line style, width, color, and labels (showing percentage and/or price).
- Dynamically adjusts based on price movement relative to the open zone.
Take Profit (TP) and Stop Loss (SL) Levels
- Highlights TP (default: 0.23) and SL (default: 1.1) Fibonacci levels with distinct colors.
- Fully customizable to align with your risk-reward strategy.
How It Works
- Session Detection : Resets daily (or per user-defined timeframe) to capture the first candle's open, high, low, and close.
- Open Zone : Draws a box between the open and close, extended forward by the projection offset.
- Session Lines : Plots lines at specified session opens with customizable styles and labels.
- Fibonacci Retracement : Adjusts levels dynamically based on session high/low and price action.
- Premium/Discount Zones : Calculated from the session range midpoint, updated in real-time.
Settings
- Open Zone :
- Timeframe (default: 5m), Calculate Timeframe (default: Daily).
- Toggle label, adjust size, box color, and projection offset.
- Session Open Lines :
- Enable/disable lines for 8:30 AM, 9:30 AM, 1:30 PM, Midnight.
- Customize color, style, width, label size, and vertical offset.
- Premium/Discount Zones :
- Toggle visibility, set colors, and adjust projection offset.
- Fibonacci Retracement :
- Toggle visibility, set custom levels, line style, width, color, and label options.
- Adjust projection offset.
- TP/SL :
- Set TP/SL Fibonacci levels and colors.
Use Cases
- Intraday Trading : Use session open lines and open zones to trade key market hours.
- Swing Trading : Leverage Fibonacci levels for potential reversal or continuation zones.
- Risk Management : Set precise TP/SL levels based on Fibonacci retracements.
- Market Structure : Identify overbought/oversold zones with premium/discount areas.
Notes
- Optimized with `dynamic_requests = true` for efficient real-time data handling.
- Visual elements (boxes, lines, labels) are cleaned up at the start of each new session.
- Session lines use New York time (`America/New_York`) for alignment with major markets.


Alpha VIX - with Stop loss built inCapture UVIX spikes with laser-sharp entries, crystal-clear exits, and built-in risk control.
▶️ Entry only when the key SMAs align, Williams %R momentum crosses up from oversold.
🛑 Exit on the very first hint of momentum fading (ROC turning down or %R cross) or a hard 2.3% stop-loss off your exact fill price.
📈 Visual signals: Green ▲ marks your entry price; red ▼ marks your exit price + P&L.
💡 Proven edge in volatile markets—no repainting, no guessing.
Based on 10 year study of the VIX and trends.
This indicator should get your nice alpha +100% p/y, when most ETFs / stocks dip. Got questions or want invite-only access to the pro 10x alpha version? DM me on TradingView and I’ll get you set up!

Wick x2 Body + 2-Candle Trend [Gold Futures]This indicator highlights potential reversal candles on Gold Futures using a combination of wick/body ratio and trend confirmation.
🔍 Logic:
Highlights a candle yellow when:
The wick is at least 2x the size of the body
The total candle size is ≥ 50 ticks (5 points)
The previous 2 candles are in the same direction (bullish or bearish) as the wick candle
📈 Interpretation:
Bullish Signal = Long lower wick on a green candle, following 2 bullish candles
Bearish Signal = Long upper wick on a red candle, following 2 bearish candles
Use this to spot overextended moves that may be due for a reversal — especially around key zones or session opens.

StratNinjaTableThe StratNinjaTable is a comprehensive technical analysis tool for TradingView designed to provide traders with a multi-timeframe overview of a security's performance and key metrics in a single, customizable table.
This indicator is built around "The Strat" candlestick methodology, which focuses on inside bars (1), trending bars (2U for up, 2D for down), and outside bars (3). It displays this information across multiple, user-selected timeframes simultaneously, from minutes to yearly charts.
Key Features
Multi-Timeframe "Strat" Analysis: The core of the indicator is a table that shows the current "Strat" number (1, 2U, 2D, or 3) and the directional bias (▲ for up, ▼ for down) for each selected timeframe. This allows for a quick assessment of market structure and potential setups across different chart periods.
Customizable Timeframe Selection: Users can easily select which timeframes they want to monitor, including standard intervals like 5-minute, 15-minute, hourly, daily, weekly, and monthly charts.
Comprehensive Data Table: Beyond the "Strat" analysis, the indicator populates a detailed table with essential market data:
Ticker Information: Displays the current ticker and the chart's timeframe.
Money Flow Index (MFI): Shows the MFI value, with color-coded backgrounds to highlight overbought (>80) and oversold (<20) conditions.
Average True Range (ATR): Provides the ATR value and its percentage relative to the closing price, with color signals for low or high volatility.
Market Cap: Calculates and displays the security's market capitalization.
Sector Information: Shows the sector the security belongs to.
Moving Average Data: Includes the distance of the current price from the 20-day Simple Moving Average (SMA), expressed as a percentage.
Volume: Displays the 30-day average trading volume.
Strat Pattern Prediction: Shows a historical sequence of the last two Strat patterns and a potential future pattern based on the current bar's direction.
Timeframe Countdown: A timer for each timeframe shows how much time is left until the current candle closes.
Customizable Appearance: The indicator offers extensive customization options for the table's position on the screen and the colors used for different "Strat" bar types, allowing users to tailor the visual presentation to their preferences.
In essence, the StratNinjaTable serves as an all-in-one dashboard, enabling traders to quickly gauge market sentiment, identify confluence across timeframes, and access key technical data without cluttering their charts with multiple separate indicators.

Relative Volume Candle Shaderthis indicator is based on the work of M0rty's "candle color by volume z-score"
I've taken M0rty's indicator a few steps further to yield a wider range of outputs, showing both extreme high and extreme lows of volume in 2 gradients.
the brightness of the candle is based on the z-score. brighter candles have unusually high volume, and dimmer candles have unusually low volume.


OSOK Protection Pad v2.1.2OSOK Protection Pad v2.1.2
The OSOK Protection Pad is a dynamic price action tool designed for active traders seeking precise visual cues for risk management and trade planning. This indicator automatically plots customizable protection pad levels above and below the current price, updating in real time as the market moves. Users can set the pad distance in points and personalize line color, style, and width for both buy (green, above price) and sell (red, below price) pads.
Key features:
Continuously adjusting pad lines that move with the current price, providing instant reference for stop placement or trade entry/exit zones.
Clean, non-intrusive visuals with dotted or solid lines and compact labels, ensuring clarity without obstructing price action.
Simple, intuitive settings panel for quick adjustments to pad distance and appearance.
Ideal for discretionary and systematic traders who want to reinforce discipline and structure in their intraday or swing trading routines.
Add the OSOK Protection Pad to your chart to enhance your risk management and stay visually aligned with your trading plan

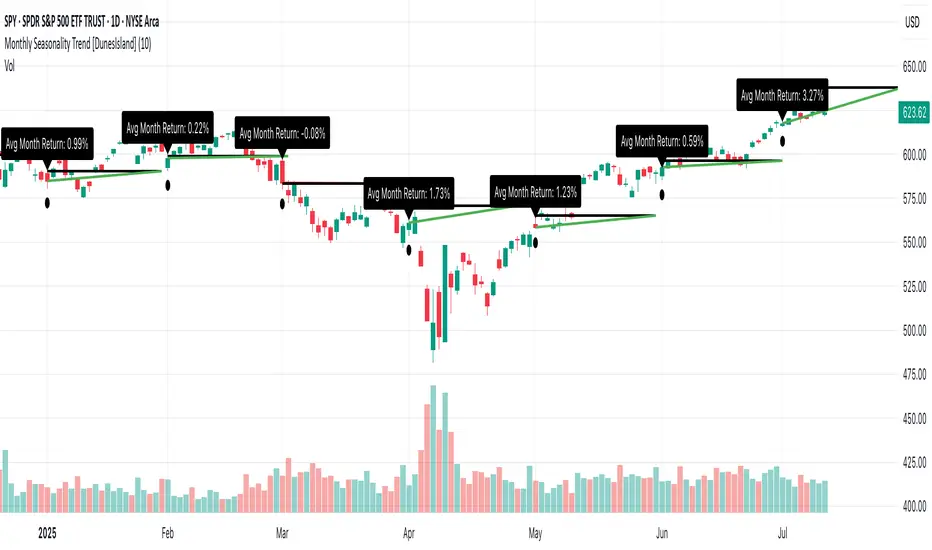
Monthly Seasonality Trend [DunesIsland]The Monthly Seasonality Trend is a indicator designed to analyze and visualize historical monthly seasonality patterns in financial markets. By calculating the average monthly return over a user-configurable lookback period (1 to 10 years), this indicator provides traders and investors with a clear projection of potential price movements for the current month, enabling data-driven decision-making.
How It Works
The indicator operates by retrieving monthly open and close prices for the specified lookback period (up to 10 years) and computing the average percentage return for the current month based on historical data. Key functionalities include:
Dynamic Trend Line: On the first trading day of each month, the indicator plots a line projecting the expected price trajectory, starting from the current close price and extending to the estimated end-of-month price based on the average historical return. The line is colored green for anticipated price increases or red for expected declines, offering an intuitive visual cue.
Average Return Label: A label is displayed at the start of each month, detailing the calculated average historical return for that month, expressed as a percentage, to provide context for the projected trend.
First Trading Day Marker: A small circle is plotted below the bar on the first trading day of each month, clearly marking the start of the projection period.
Adaptive Bar Counting: The indicator dynamically adjusts the length of the trend line based on the actual number of trading days in the previous month, ensuring accurate projections.
How to Interpret
Bullish Projection (Green Line): Indicates that historical data suggests an average price increase for the current month, potentially signaling buying opportunities.
Bearish Projection (Red Line): Suggests an average price decline based on historical trends, which may prompt caution or short-selling strategies.
Historical Context: The average return label provides a quantitative measure of past performance, helping traders assess the reliability of the projected trend.
Turtle Trading System + ATR Trailing StopIndicator Description: Turtle ATR Trailing Stop
The **Turtle ATR Trailing Stop** is a technical indicator designed to enhance the classic Turtle Trading System by incorporating a dynamic trailing stop based on the Average True Range (ATR). This indicator is ideal for traders seeking to manage risk and lock in profits on both long and short positions in trending markets.
Key Features:
- Turtle Trading Levels: Calculates the 20-day highest high and lowest low to identify potential breakout points, a core principle of the Turtle Trading System.
- ATR-Based Trailing Stop: Utilizes a trailing stop that adjusts dynamically based on a multiple of the ATR (default multiplier: 2.0), providing a volatility-adjusted exit mechanism.
- Position Flexibility: Supports both long and short positions, with the trailing stop positioned below the highest price for long trades and above the lowest price for short trades.
- Smooth Updates: The trailing stop updates on each bar, ensuring a more responsive adjustment to price movements, rather than only on new highs or lows.
- Reset Mechanism: Automatically resets the trailing stop when the price deviates significantly (configurable threshold, default 0.1%), adapting to major trend reversals.
- Alerts: Includes customizable alerts that trigger when the price reaches the trailing stop level, notifying traders of potential exit points.
- Debugging Tools: Features an on-chart debug table displaying ATR, Close, Highest Price, Lowest Price, Potential Stop, and Trailing Stop values for real-time analysis.
How It Works:
- For **Long Positions**: The trailing stop starts below the initial close price (minus 2*ATR) and moves up as the highest price increases, locking in profits while trailing at a fixed ATR distance.
- For **Short Positions**: The trailing stop starts above the initial close price (plus 2*ATR) and moves down as the lowest price decreases, protecting against upward price movements.
- The stop resets if the price falls (for long) or rises (for short) beyond the set threshold, ensuring adaptability to new market conditions.
Customization:
- Period Settings: Adjust the length for highs/lows (default 20) and ATR period (default 14).
- ATR Multiplier: Modify the distance of the trailing stop (default 2.0).
- Reset Threshold: Fine-tune the percentage at which the stop resets (default 0.1%).
- Position Type: Switch between "Long" and "Short" modes via input settings.
Usage:
Apply this indicator to any chart in TradingView, set your preferred parameters, and monitor the trailing stop line (yellow) alongside the Turtle highs (red) and lows (blue). Use the debug table to validate calculations and set alerts to stay informed of stop triggers.
This indicator combines the trend-following strength of the Turtle System with a flexible, ATR-based stop-loss strategy, making it a powerful tool for both manual and automated trading strategies.

Up/Down Volume Delta %this script is based on FractalTrade_'s rendition of the up/down volume bars.
the shortcomings of that chart were that large volume bars caused the auto-scaling to shrink smaller volume bar displays to the point where much of the data was too small to see.
in this chart, the bars are displaying the percent delta out of the total bar volume. this way, large overall volume bars do not cause visual compression to everything else in the chart.
I've used color modulation to indicate relation to a relative volume point, so users can still tell when overall volume is large or small. when volume is under a moving average, the bars will display at a basis transparency. when the volume is over the average, the brightness will increase up to a specific ratio of volume defined by the user.
for example, if basis transparency is at 20, and the full opacity ratio is at 3, and the volume average is at 1M, a volume of 750k will display the delta bar at the basis transparency. a volume of 3M will achieve full brightness. a volume of 2M will display with moderate brightness (about 60%), but still stand out against other bars with basis transparency.
areas of the chart that are either increasing bar sizes or increasing in brightness can indicate directional force. when volume delta direction contradicts the candle direction, this can indicate support / resistance.

First 15 Min H/L Breakout Signal V3 - Session Aware (Adaptive)this script checks the breakout on 1min time frame as compared to previous breakouts happened on 15min and 5min.

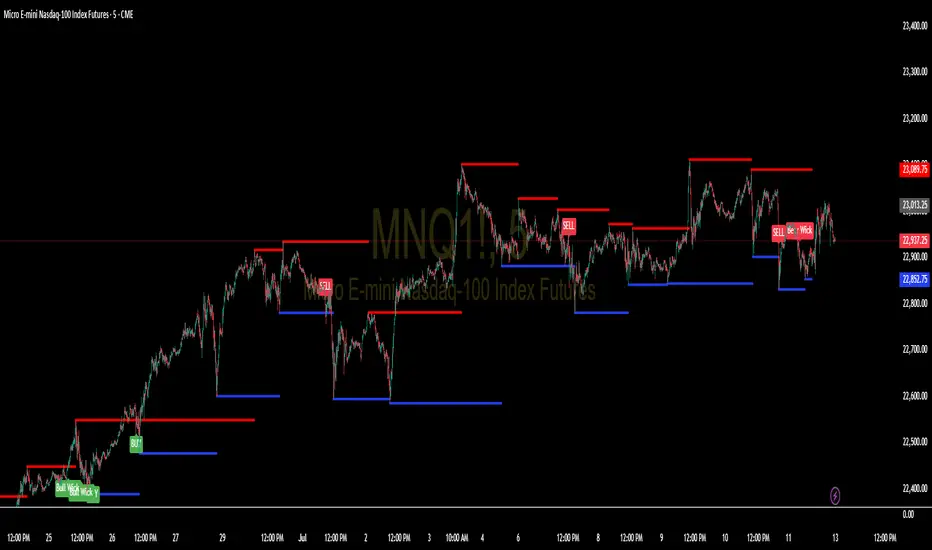
Support and Resistance Levels with BreaksThis indicator identifies dynamic support and resistance levels using pivot point analysis and provides clear trading signals when these levels are broken with volume confirmation. Enhanced version with improved signal clarity for better trading decisions.
## 🔧 Key Features
### Support & Resistance Detection
- Automatically identifies key pivot high and low levels
- Draws clear visual lines (red for resistance, blue for support)
- Configurable sensitivity with left/right bar settings
### Enhanced Trading Signals
- **BUY** signals when resistance is broken with volume confirmation
- **SELL** signals when support is broken with volume confirmation
- **Bull Wick** alerts for potential reversals at resistance
- **Bear Wick** alerts for potential reversals at support
### Volume Confirmation
- Built-in volume oscillator using 5 and 10-period EMAs
- Filters out low-volume false breakouts
- Adjustable volume threshold (default: 20%)
### Complete Alert System
- Support Broken alerts
- Resistance Broken alerts
- Bull Wick reversal alerts
- Bear Wick reversal alerts
## ⚙️ Settings
- **Show Breaks**: Toggle signal display
- **Left Bars**: Pivot detection lookback (default: 15)
- **Right Bars**: Pivot detection lookforward (default: 15)
- **Volume Threshold**: Minimum volume increase for valid signals (default: 20%)
## 📈 Best For
- Swing trading strategies
- Breakout confirmation
- Support/resistance trading
- Volume-based entry signals
## 🔍 How It Works
1. Identifies pivot highs/lows using configurable periods
2. Calculates volume oscillator for confirmation
3. Generates BUY signals on resistance breaks with volume
4. Generates SELL signals on support breaks with volume
5. Detects wick patterns for potential reversals
## 📋 Updates in This Version
- Enhanced BUY/SELL signal clarity (replaced generic "B" labels)
- Added Bull Wick and Bear Wick alert conditions
- Updated to Pine Script v6 compatibility
- Improved signal filtering and accuracy
## ⚠️ Disclaimer
This indicator is for educational and informational purposes only. Always conduct your own analysis and risk management before making trading decisions. Past performance does not guarantee future results.
---
**Original Script**: "Support and Resistance Levels with Breaks" by LuxAlgo
**License**: CC BY-NC-SA 4.0
**Enhanced by**: profitgang
**Version**: Pine Script v6
Real 10Y Yield (DGS10 - T10YIE)The Real 10Y Yield (DGS10 – T10YIE) indicator computes the inflation-adjusted U.S. 10-year Treasury yield by subtracting the 10-year breakeven inflation rate (T10YIE) from the nominal 10-year Treasury yield (DGS10), both sourced directly from FRED. By filtering out inflation expectations, this script reveals the true, real borrowing cost over a 10-year horizon—one of the most reliable gauges of overall risk sentiment and capital–market health.
How It Works
Data Inputs
• DGS10 (Nominal 10-Year Treasury Yield)
• T10YIE (10-Year Breakeven Inflation Rate)
Both series are fetched on a daily timeframe via request.security from FRED.
Real Yield Calculation
pine
Copy
Edit
real10y = DGS10 – T10YIE
A positive value indicates that nominal yields exceed inflation expectations (real yields are positive), while a negative value signals deep-negative real rates.
Thresholds & Coloring
• Bullish Zone: Real yield < –0.1 %
• Bearish Zone: Real yield > +0.1 %
The background turns green when real yields drop below –0.1 %, reflecting an ultra-accommodative environment that historically aligns with risk-on rallies. It turns red when real yields exceed +0.1 %, indicating expensive real borrowing costs and a potential shift toward risk-off.
Alerts
• Deep-Negative Real Yields (Bullish): Triggers when real yield < –0.1 %
• High Real Yields (Bearish): Triggers when real yield > +0.1 %
Why It’s Powerful
Forward-Looking Sentiment Gauge
Real yields incorporate both market-implied inflation and nominal rates, making them a leading indicator for risk appetite, equity flows, and crypto demand.
Clear, Actionable Zones
The –0.1 % / +0.1 % thresholds cleanly delineate structurally bullish vs. bearish regimes, removing noise and false signals common in nominal-only yield studies.
Macro & Cross-Asset Confluence
Combine with equity indices, dollar strength (DXY), or credit spreads for a fully contextual macro view. When real yields break deeper negative alongside weakening dollar, it often precedes stretch in risk assets.
Automatic Alerts
Never miss regime shifts—alerts notify you the moment real yields breach key zones, so you can align your strategy with prevailing macro momentum.
How to Use
Add to a separate pane for unobstructed visibility.
Monitor breaks beneath –0.1 % for early “risk-on” signals in stocks, commodities, and crypto.
Watch for climbs above +0.1 % to hedge or rotate into defensive assets.
Combine with your existing trend-following or mean-reversion strategies to improve timing around major market turning points.
–––
Feel free to adjust the threshold lines to your preferred sensitivity (e.g., tighten to ±0.05 %), or overlay with moving averages to smooth out whipsaws. This script is ideal for macro traders, portfolio managers, and quantitative quants who demand a distilled, inflation-adjusted view of real rates.

Daily Price Change (%)Description:
This script displays the percentage change of the last N candles either above each bar or along a shared horizontal line.
You can choose between two calculation methods:
Close vs Previous Close
Open vs Close
Labels are fully customizable:
Adjustable text size
Custom background color
Number of candles to display
Fixed 10% spacing above candles (prevents overlap)
Ideal for visualizing short-term momentum and price action in a clean, non-intrusive format.
Examples:
Disclaimer:
This script is provided for informational and educational purposes only.
The author assumes no liability for any financial losses, software errors, or misinterpretations.
Always do your own research and use trading tools at your own risk.

Essa - Market Structure DetectorA comprehensive tool for identifying real-time market structure patterns using pivot analysis, adaptive volatility filtering, and multi-timeframe confluence. This script highlights higher highs (HH), higher lows (HL), lower highs (LH), and lower lows (LL), while offering intelligent confirmations and optional visual aids.
Key Features:
Dynamic detection of HH, HL, LH, LL based on pivot structures
Adaptive sensitivity using ATR-based volatility filters
Confirmation logic based on breakout alignment
Optional ZigZag line rendering between key pivots
Customisable labels with confluence indicators
Multi-timeframe pattern scanning with auto-scaling timeframes
Info panel showing current pattern, trend bias, mode, and structure across 5 higher timeframes
Built-in alerts for structure shifts and high-confluence setups
This tool is ideal for traders who rely on structure-based entries, multi-timeframe confluence, and precision pattern recognition to anticipate trend reversals or continuations with high confidence.

Essa - Enhanced Fibonacci Confluence ToolkitA precision-engineered trading tool designed to identify high-probability reversal zones using price action alone. This version expands on traditional Fibonacci confluence techniques by integrating a multi-tiered market structure framework and advanced state management.
Key Features:
Fully automated CHoCH (Change of Character) detection
Tiered market structure logic (Short, Intermediate, Long-Term)
Dynamic Area of Interest (AOI) zone rendering
Automatic Fibonacci retracement plotting from swing highs/lows
Customisable Fibonacci levels (0% to 100%, including 23.6%, 61.8%, 65%, 78.6%)
Real-time Fibonacci invalidation logic with on-chart alerts
Bullish and bearish engulfing candle detection with structure-based filtering
Configurable swing labels (◉, △▽, H/L) with size control
Adjustable CHoCH line styles and widths
Optional display of Fibonacci level labels
Modular and efficient codebase with object-oriented architecture
Originally inspired by the LuxAlgo Fibonacci Confluence Toolkit (v5). Credit to LuxAlgo for the foundational concept.


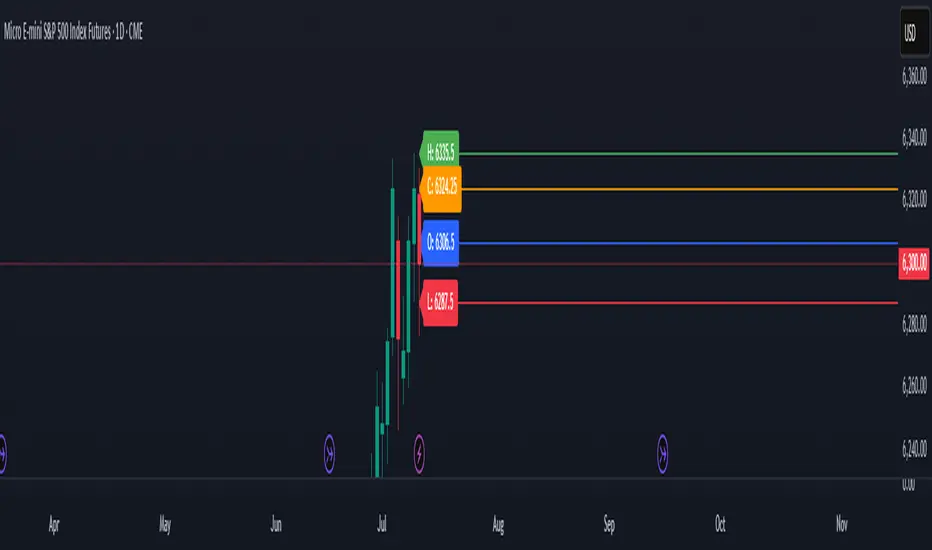
Previous Day OHLC# Previous Day OHLC Levels Indicator
## Overview
The Previous Day OHLC indicator is a simple yet powerful tool that plots the Open, High, Low, and Close levels from previous trading sessions. This indicator helps traders identify key support and resistance levels based on historical price action, making it easier to spot potential reversal zones and breakout levels.
## Key Features
### 📊 **Previous Day OHLC Levels**
- Displays the Open, High, Low, and Close prices from 1-5 days ago
- Lines automatically extend to the right for easy visualization
- Updates daily to show the most relevant levels
### 🎨 **Fully Customizable Styling**
- **Individual Line Colors**: Choose unique colors for each OHLC level
- **Line Styles**: Select from Solid, Dashed, or Dotted lines for each level
- **Line Width**: Adjust thickness from 1-4 pixels for better visibility
- **Price Labels**: Display actual price values on each line with customizable sizing
### ⚙️ **Flexible Settings**
- **Lookback Period**: Choose to display levels from 1-5 days ago (maximum safety limit)
- **Label Control**: Toggle price labels on/off and adjust their size
- **Performance Optimized**: Clean code that won't slow down your charts
## How to Use
1. **Add to Chart**: Apply the indicator to any timeframe chart
2. **Customize Settings**: Adjust colors, styles, and lookback period to your preference
3. **Identify Levels**: Use the plotted lines as potential support/resistance zones
4. **Trade Setup**: Look for price reactions at these key levels for entry/exit signals
## Best Practices
- **Day Trading**: Use 1-day lookback for intraday support/resistance
- **Swing Trading**: Extend lookback to 2-5 days for broader context
- **Multi-Timeframe**: Combine with other timeframe analysis for confirmation
- **Risk Management**: Use these levels for stop-loss and take-profit placement
## Color Coding (Default)
- **Open**: Blue - Starting price of the previous session
- **High**: Green - Highest price reached
- **Low**: Red - Lowest price reached
- **Close**: Orange - Final price of the session
## Why This Indicator Works
Previous day OHLC levels are among the most watched price points by professional traders. These levels often act as:
- **Support/Resistance**: Price tends to react at these historical levels
- **Breakout Confirmation**: Strong moves beyond these levels can signal trend continuation
- **Reversal Zones**: Price often bounces from these key levels
- **Psychological Levels**: Market participants remember these important price points
## Technical Specifications
- **Pine Script Version**: v6
- **Overlay**: Yes (plots directly on price chart)
- **Performance**: Optimized for smooth chart operation
- **Compatibility**: Works on all timeframes and instruments
Perfect for traders of all experience levels who want to incorporate previous day levels into their technical analysis toolkit!