Indicators and strategies

ATR % Line from Day LowThis places a line at a determined percent distance (within the settings panel) from the high or low of the day to make sure you're not buying extended.

SMA Crossover with Background ShadingThis application is to identify when to buy or when to sell upon satisfying the condition on this script.

Dominant Volume DeltaThis indicator displays the volume delta (difference between buying and selling volume) for the dominant side only. If buyers dominate, a teal bar shows the strength of buying. If sellers dominate, a red bar shows the strength of selling. All values are positive and scaled to highlight aggressive pressure. Useful for spotting real-time market imbalances.

IB Breakout Strategy with Fib, CVD, and DivergenceEntry rules and signals- I wait for the 5min IB(initial balance) to form every session for eg-(first 5min candle of london session or ny session, marking top wick to bottom wick of first 5 min candle with a midpoint in that zone.Then look for CVD(cumulative volume delta) if it's alining with my analysis.I also mark previous session fib levels for scalp entries on .618 or .78 level.Also i do mark previous day VAH(value area high),VAL(value area low) and POC(point of control) for better understanding of direction.
Initial stop loss and take profit values-Initial stop loss varies from 200$ to 500$ and take profit varies from 250$ to 500$.
Number of contracts you plan to trade based on system stats and risk management-I plan to trade 1-2 contracts until i reach the safety net.Once safety net is achieved based on my entry level i decide the contract size which varies from 1-4 contracts.
Trade management and any trailing stop methods-I trail the stop once i feel like there's enough room for the trade.I manage the trade on the basis of strength of a candle, if its taking much time without strength i exit the trade.

Hull Moving Average (HMA)# Hull Moving Average (HMA) - Technical Indicator
## Overview
The Hull Moving Average (HMA) is an advanced technical indicator developed by Alan Hull that solves the main problem of traditional moving averages: **lag**. This indicator provides a unique combination of **speed** and **smoothness**, virtually eliminating lag in trend change detection.
## What HMA Does
### Primary Function
HMA calculates a moving average that reacts **much faster** to price changes than classic moving averages (SMA, EMA, WMA), while maintaining **superior smoothing** that eliminates market noise.
### Mathematical Calculation
HMA uses a three-step formula:
1. **WMA1** = WMA(price, period/2) × 2
2. **WMA2** = WMA(price, period)
3. **HMA** = WMA(WMA1 - WMA2, √period)
This complex formula allows the indicator to "anticipate" price movements rather than follow them with delay.
## Key Advantages
### 1. **Lag Elimination**
- Reacts 2-3 bars earlier than EMA
- Detects trend changes almost instantaneously
- Ideal for active trading on short timeframes
### 2. **Superior Smoothing**
- Eliminates false market noise
- Reduces false signals (whipsaws)
- Provides clear trend direction visualization
### 3. **Versatility**
- Works on all timeframes (1min - monthly)
- Compatible with all markets (forex, stocks, crypto, commodities)
- Combines excellently with other indicators
## How to Interpret HMA
### Trend Signals
- **Green/Rising line** = Bullish trend (buy)
- **Red/Falling line** = Bearish trend (sell)
- **Color change** = Potential trend reversal
### Trading Strategies
- **Entries on HMA color change**
- **Pullbacks to HMA** in trending markets
- **Price vs HMA crossovers** for confirmations
### Confluences
HMA works excellently when combined with:
- **Support/Resistance** levels
- **Stochastic** for timing
- **RSI** for momentum confirmation
- **Volume** for move validation
## Recommended Settings
### Standard Period
- **21** - Optimal speed/accuracy balance
- **14** - Faster for scalping
- **50** - Slower for swing trading
### Ideal Timeframes
- **1-5 minutes** - Scalping with HMA(14)
- **15-30 minutes** - Day trading with HMA(21)
- **1-4 hours** - Swing trading with HMA(50)
## Limitations
### Sideways Markets
HMA can generate false signals in markets without clear trend. Use additional filters in these conditions.
### Extreme Volatility
In periods of very high volatility, even HMA may have minor delays.
### Parameter Dependency
Performance depends on correct period selection based on trading style.
## Conclusion
Hull Moving Average is one of the most advanced trend indicators available, offering an elegant solution to the lag problem of traditional moving averages. It's ideal for traders who want **fast reaction** without sacrificing **signal accuracy**.
**Recommended for:** Day trading, scalping, short-term swing trading
**Level:** Intermediate - Advanced
**Combinations:** Excellent with oscillators (Stochastic, RSI), volume indicators, and support/resistance levels

Price Volume Trend [sgbpulse]1. Introduction: What is Price Volume Trend (PVT)?
The Price Volume Trend (PVT) indicator is a powerful technical analysis tool designed to measure buying and selling pressure in the market based on price changes relative to trading volume. Unlike other indicators that focus solely on volume or price, PVT combines both components to provide a more comprehensive picture of trend strength.
How is it Calculated?
The PVT is calculated by adding or subtracting a proportional part of the daily volume from a cumulative total.
When the closing price rises, a proportional part of the daily volume (based on the percentage price change) is added to the previous PVT value.
When the closing price falls, a proportional part of the daily volume is subtracted from the previous PVT value.
If there is no change in price, the PVT value remains unchanged.
The result of this calculation is a cumulative line that rises when buying pressure is strong and falls when selling pressure dominates.
2. Why PVT? Comparison to Similar Indicators
While other indicators measure volume-price pressure, PVT offers a unique advantage:
PVT vs. On-Balance Volume (OBV):
OBV simply adds or subtracts the entire day's volume based on the closing direction (up/down), regardless of the magnitude of the price change. This means a 0.1% price change is treated the same as a 10% change.
PVT, on the other hand, gives proportional weight to volume based on the percentage price change. A trading day with a large price increase and high volume will impact the PVT significantly more than a small price increase with the same volume. This makes PVT more sensitive to trend strength and changes within it.
PVT vs. Accumulation/Distribution Line (A/D Line):
The A/D Line focuses on the relationship between the closing price and the bar's trading range (Close Location Value) and multiplies it by volume. It indicates whether the pressure is buying or selling within a single bar.
PVT focuses on the change between closing prices of consecutive bars, multiplying this by volume. It better reflects the flow of money into or out of an asset over time.
By combining volume with percentage price change, PVT provides deeper insights into trend confirmation, identifying divergences between price and volume, and spotting signs of weakness or strength in the current trend.
3. Indicator Settings (Inputs)
The "Price Volume Trend " indicator offers great flexibility for customization to your specific needs through the following settings:
Moving Average Type: Allows you to select the type of moving average used for the central line on the PVT. Your choice here will affect the line's responsiveness to PVT movements.
- "None" : No moving average will be displayed on the PVT.
- "SMA" (Simple Moving Average): A simple average, smoother, ideal for identifying longer-term trends in PVT.
- "SMA + Bollinger Bands": This unique option not only displays a Simple Moving Average but also activates the Bollinger Bands around the PVT. This is the recommended option for analyzing volatility and ranges using Bollinger Bands.
- "EMA" (Exponential Moving Average): An exponential average, giving more weight to recent data, responding faster to changes in PVT.
- "SMMA (RMA)" (Smoothed Moving Average): A smoothed average, providing extra smoothing, less sensitive to noise.
- "WMA" (Weighted Moving Average): A weighted average, giving progressively more weight to recent data, responding very quickly to changes in PVT.
Moving Average Length: Defines the number of bars used to calculate the moving average (and, if applicable, the standard deviation for the Bollinger Bands). A lower value will make the line more responsive, while a higher value will smooth it out.
PVT BB StdDev (Bollinger Bands Standard Deviation): Determines the width of the Bollinger Bands. A higher value will result in wider bands, making it less likely for the PVT to cross them. The standard value is 2.0.
4. Visual Aid: Current PVT Level Line
This indicator includes a unique and highly useful visual feature: a dynamic horizontal line displayed on the PVT graph.
Purpose: This line marks the exact level of the PVT on the most recent trading bar. It extends across the entire chart, allowing for a quick and intuitive comparison of the current level to past levels.
Why is it Important?
- Identifying Divergences: Often, an asset's price may be lower or higher than past levels, but the PVT level might be different. This auxiliary line makes it easy to spot situations where PVT is at a higher level when the price is lower, or vice-versa, which can signal potential trend changes (e.g., higher PVT than in the past while price is low could indicate strong accumulation).
- Quick Direction Indication: The line's color changes dynamically: it will be green if the PVT value on the last bar has increased (or remained the same) relative to the previous bar (indicating positive buying pressure), and red if the PVT value has decreased relative to the previous bar (indicating selling pressure). This provides an immediate visual cue about the direction of the cumulative momentum.
5. Important Note: Trading Risk
This indicator is intended for educational and informational purposes only and does not constitute investment advice or a recommendation for trading in any form whatsoever.
Trading in financial markets involves significant risk of capital loss. It is important to remember that past performance is not indicative of future results. All trading decisions are your sole responsibility. Never trade with money you cannot afford to lose.

D15 Precision IndicatorD15 Precision Indicator
The D15 Precision Indicator is a high-accuracy intraday trading tool optimized for 15-minute charts. It identifies precise BUY and SELL signals only when all key conditions align:
✅ Price above/below EMA 21 & EMA 50
✅ Price above/below VWAP
✅ Price within predefined support/resistance zones
✅ Break of Structure (BOS) confirmed by pivot levels
✅ High-volume breakout candle
✅ Optional confirmation from previous candles for added precision
The script includes:
Clear visual arrows (BUY/SELL)
Dynamic background highlights for signals
Support/Resistance zone boxes
All key indicators plotted (EMA, VWAP, zones)
Ideal for disciplined traders aiming for 80%+ win rate through strict signal filtering and visual clarity.

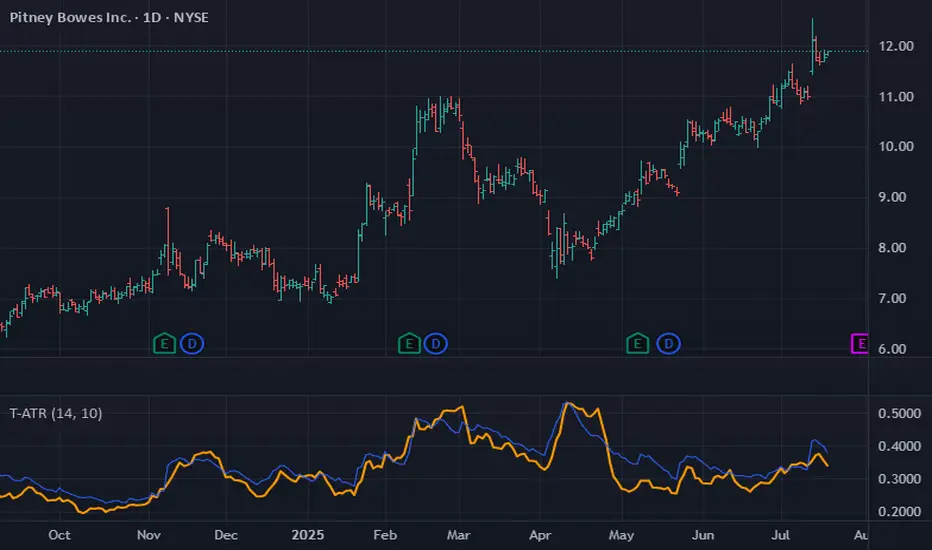
Trimmed ATR🧠 **Brief Description**:
Trimmed ATR is a modified volatility indicator that removes extreme values from the ATR calculation. This makes it more reliable for analyzing market conditions and filters out "noise" spikes. It is particularly useful for setting stop-losses and in strategies sensitive to false volatility.
🧾 **How Does Trimmed ATR Work?**
📌 For each bar:
- True Range (TR) is calculated.
- A sliding window of the last N TR values (where N = length) is stored.
- The TR list is sorted, and trimPercent % is cut off from each side:
- The smallest and largest values are removed.
- The remaining values are averaged → Trimmed ATR.
🔍 **Why Is This Important?**
Regular ATR can be distorted by outliers:
- A single spike can sharply inflate the ATR.
- This creates a false impression of market volatility.
🎯 Trimmed ATR solves this by eliminating the impact of anomalies, providing a more stable and accurate volatility measure.
📈 **What Does It Mean If Trimmed ATR Is Higher or Lower Than Regular ATR?**
🔵 **Trimmed ATR is lower than ATR** — this is normal:
- There are isolated TR spikes (high volatility on 1–2 bars).
- ATR increases, including these outliers.
- Trimmed ATR discards them → reflects the true average market background.
🧠 This is the most common case, indicating: a spike occurred, but the market is generally calm.
🟠 **Trimmed ATR is higher than ATR** — a rare but important signal:
- There were artificially low TR values (very small movements).
- ATR becomes too low.
- Trimmed ATR discards these "quiet" periods → provides a more realistic volatility estimate.
⚠️ This may indicate:
- Hidden pressure.
- Preparation for a breakout from a tight range.
- Underestimated volatility.
💡 **Applications**:
- **Trailing Stop**: Trimmed ATR helps avoid stop triggers due to noise.
- **Trend Filter**: Better reflects the "true" market dynamics.
- **Strategy Backtesting**: Eliminates distortions in volatility calculations.
Price PivotsThis indicator tracks price pivots and displays the high / low value.
You can select the number of candles to look back.
You can select how many candles range before the next pivot is printed.
Text size and colours are user defined.

Exchanges Combined Volume📊 Exchanges Combined Volume
(Aggregated Multi-Exchange Volume: Binance, OKX, Bybit, etc.) by BIGTAKER*
🔍 Purpose
The Exchanges Combined Volume indicator aggregates real-time trading volumes from multiple global exchanges for a specific asset (e.g., a cryptocurrency).
Instead of relying on a single market, it provides a broader view of market activity, helping users detect abnormal volume behavior and increased participation across the entire market.
⚙️ Supported Exchanges
* USDT Markets
`Binance`, `OKX`, `Bybit`, `Bitget`, `Gate.io`
* USD Markets
`Coinbase`, `Bitfinex`, `Bitstamp`
* Default
Includes the current chart symbol’s native volume by default.
🧮 Core Calculation Logic
1. 📛 Symbol Normalization (cleanSymbol)
Prefixes such as `1000`, `10000`, `100000`, or `1M` (common in leveraged tickers) are automatically removed to extract the base token.
> Example:
> `1000PEPEUSDT` → `PEPEUSDT`
2. 📈 Volume Requests from External Exchanges
Volume is retrieved using the `` format (e.g., `'BINANCE:PEPEUSDT'`, `'COINBASE:BTCUSD'`).
Invalid or delisted pairs are safely ignored using `ignore_invalid_symbol=true`.
3. 📊 Total Volume Calculation
totalVolume = usdtVolume + usdVolume + currentSymbolVolume
The indicator sums the volume from all target exchanges plus the volume from the current chart symbol.
4. 📏 Comparison to Average Volume
* Period: `length = 60` (Simple Moving Average over 60 candles)
* A candle is considered **high-intensity** if:
5. 🎨 Visual Styling
| Condition | Color | Meaning |
| -------------------------- | --------------------- | ----------------------- |
| High-volume Bullish Candle | Light Green (#30db78) | Strong Buying Activity |
| High-volume Bearish Candle | Bright Red (#ff0000) | Strong Selling Activity |
| Normal Bullish Candle | Dark Green (#3c7058) | Regular Buying Volume |
| Normal Bearish Candle | Dark Red (#682e2c) | Regular Selling Volume |
📌 Use Cases
* Detect synchronized volume surges across major global exchanges.
* Identify pre-pump accumulation phases on altcoins.
* Combine with premium gap indicators (e.g., Kimchi Premium) to identify leading market sentiment.
* Confirm breakout momentum with multi-exchange volume validation.
📘 Notes & Warnings
* Listing differences across exchanges may result in **zero volume** on some platforms.
* Prefixes like `1000`, `1M`, etc., are automatically removed to **improve symbol matching accuracy**.
* As volume units are not standardized, this indicator is best suited for **absolute value analysis**, not ratio-based comparisons.

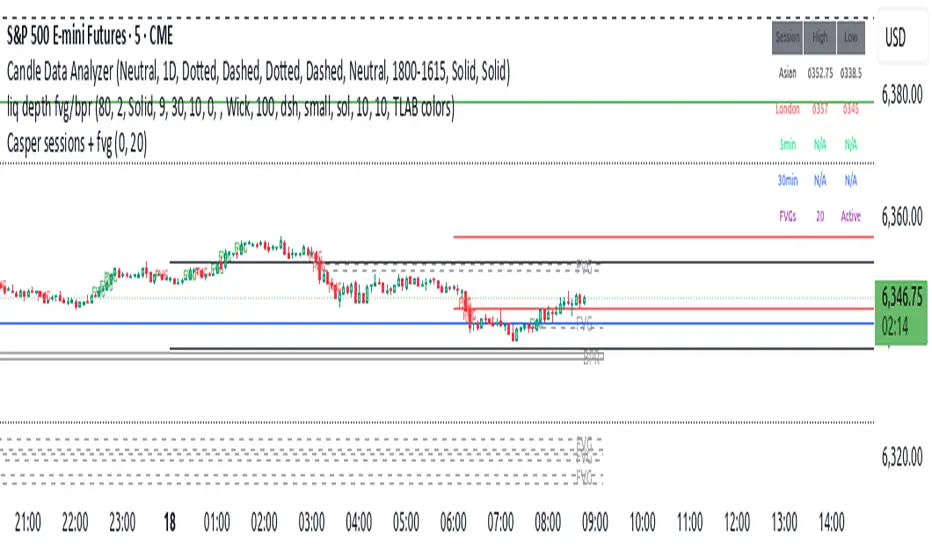
Casper sessions + fvgUpdated version with Asia session lines now drawn correctly.
Timings are correct for futures markets only.
Time adjustment available in settings for other instruments but Asia and London session lines do not print when this option is used.
5 minute opening range should display correctly when on the 1 minute chart

EMA Slope AngleTo help you find out how good is the current trend.If its positive look for longs and vise versa

[Stya] CMF With Dynamic Colour]This script similar like normal Chaikin Money Flow (CMF), built as indicator to follow Smart Money. I just make a bit colorful to make it easier to see as indicator (UP or DOWN) based on the color

Top Crypto Above 28-Day AverageDescription
The “Top Crypto Above 28-Day Average” (CRYPTOTW) script scans a selectable universe of up to 120 top-capitalization cryptocurrencies (divided into customizable 40-symbol batches), then plots the count of those trading above their own 28-period simple moving average. It helps you gauge broad market strength and identify which tokens are showing momentum relative to their recent trend.
Key Features
• Batch Selection: Choose among “Top40,” “Mid40,” or “Low40” market-cap groups, or set a custom batch size (up to 40 symbols) to keep within the API limit.
• Dynamic Plot: Displays a live line chart of how many cryptos are above their 28-day MA on each bar.
• Reference Lines: Automatic horizontal lines at 25%, 50%, and 75% of your batch to provide quick visual thresholds.
• Background Coloration: The chart background shifts green/yellow/red based on whether more than 70%, 50–70%, or under 50% of the batch is above the MA.
• Optional Table: On the final bar, show a sortable table of up to 28 tickers currently above their 28-day MA, including current price, percent above MA, and “Above” status color-coding.
• Alerts:
• Strong Batch Performance: Fires when >70% of the batch is above the MA.
• Weak Batch Performance: Fires when <10 cryptos (i.e. <25%) are above the MA.
Inputs
• Show Results Table (show_table): Toggle the detailed table on/off.
• Table Position (table_position): Select one of the four corners for your table overlay.
• Max Cryptos to Display (max_display): Limit the number of rows in the results table.
• Current Batch (current_batch): Pick “Top40,” “Mid40,” or “Low40.”
• Batch Size (batch_size): Define the number of symbols (1–40) you want to include from the chosen batch.
How to Use
1. Add the CRYPTOTW indicator to any chart.
2. Select your batch and size to focus on the segment of the crypto market you follow.
3. Watch the plotted line to see the proportion of tokens with bullish momentum.
4. (Optional) Enable the results table to see exactly which tokens are outperforming their 28-day average.
5. Set alerts to be notified when the batch either overheats (strong performance) or cools off significantly.
Why It Matters
By tracking the share of assets riding their 28-day trend, you gain a macro-level view of market breadth—crucial for spotting emerging rallies or early signs of broad weakness. Whether you’re swing-trading individual altcoins or assessing overall market mood, this tool distills complex data into an intuitive, actionable signal.

Daily,Weekly,Monthly openingThe indicator plots the daily, weekly, and monthly openings.
These price levels often act as support and resistance.


Khalid's Custom Forecastthis indicator very useful o be link to others to read the future of the prices .

PM + BOS + FVG Indicator & AlertsHey team it's Tanner, I have created Nitros strategy into a custom indicator, it's only the PM BOS FVG model, I will add a HOD/LOD BOS FVG custom indicator eventually, this indicator is setup to give you alerts as well. or if you just want a clean FVG indicator and or PM level indicator this works too. mess with the settings to your liking and DM me on circle or discord if you have feedback or questions, thanks team.

10/20 MA Coil: Progressive Colors & Multi-Day BreakoutThis indicator detects price “coil” setups and highlights potential breakout or breakdown opportunities using moving average alignment and volatility compression.
Features:
• Coil Detection:
• Identifies consolidation when:
• The 10 and 20 MAs are tightly aligned (within user-defined tolerance)
• Price is above both MAs and within 1.5x ADR of them
• The 50 MA is rising
• Progressive Coil Coloring:
• Coil candles are colored in progressively darker orange as the streak continues
• Bullish Breakout Signal:
• Triggers when a green candle follows a coiled bar
• The candle’s body must be greater than or equal to 1 ATR
• Colored lime green
• Bearish Breakdown Signal:
• Triggers when a red candle follows a coiled bar
• The candle’s body must be greater than or equal to 1 ATR to the downside
• Colored black
• Custom Candle Rendering:
• Candle body color represents coil or breakout state
• Wick and border are red or green to reflect price direction
• Optional Debug Tools:
• Coil streak, ATR, and distance from MAs can be plotted for deeper analysis
This script is designed for traders looking to spot price compression and prepare for high-probability moves following low-volatility setups.

Standard Deviation Oscillator with Average and Static LinesStandard Deviation Oscillator with adjustable average and static lines
