Opening Range Breakout🧭 Overview
The Open Range Breakout (ORB) indicator is designed to capture and display the initial price range of the trading day (typically the first 15 minutes), and help traders identify breakout opportunities beyond this range. This is a popular strategy among intraday and momentum traders.
🔧 Features
📊 ORB High/Low Lines
Plots horizontal lines for the session’s high and low
🟩 Breakout Zones
Background highlights when price breaks above or below the range
🏷️ Breakout Labels
Text labels marking breakout events
🧭 Session Control
Customizable session input (default: 09:15–09:30 IST)
📍 ORB Line Labels
Text labels anchored to the ORB high and low lines (aligned right)
🔔 Alerts
Configurable alerts for breakout events
⚙️ Adjustable Settings
Show/hide background, labels, session window, etc.
⏱️ Session Logic
• The ORB range is calculated during a defined session window (default: 09:15–09:30).
• During this window, the highest high and lowest low are recorded as ORB High and ORB Low.
📈 Breakout Detection
• Breakout Above: Triggered when price crosses above the ORB High.
• Breakout Below: Triggered when price crosses below the ORB Low.
• Each breakout can trigger:
• A background highlight (green/red)
• A text label (“Breakout ↑” / “Breakout ↓”)
• An optional alert
🔔 Alerts
Two built-in alert conditions:
1. Breakout Above ORB High
• Message: "🔼 Price broke above ORB High: {{close}}"
2. Breakout Below ORB Low
• Message: "🔽 Price broke below ORB Low: {{close}}"
You can create alerts in TradingView by selecting these from the Add Alert window.
📌 Best Use Cases
• Intraday momentum trading
• Breakout and scalping strategies
• First 15-minute range traders (NSE, BSE markets)
Indicators and strategies

Logarithmic Moving Average (LMA) [QuantAlgo]🟢 Overview
The Logarithmic Moving Average (LMA) uses advanced logarithmic weighting to create a dynamic trend-following indicator that prioritizes recent price action while maintaining statistical significance. Unlike traditional moving averages that use linear or exponential weights, this indicator employs logarithmic decay functions to create a more sophisticated price averaging system that adapts to market volatility and momentum conditions.
The indicator displays a smoothed signal line that oscillates around zero, with positive values indicating bullish momentum and negative values indicating bearish momentum. The signal incorporates trend quality assessment, momentum confirmation, and multiple filtering mechanisms to help traders and investors identify trend continuation and reversal opportunities across different timeframes and asset classes.
🟢 How It Works
The indicator's core innovation lies in its logarithmic weighting system, where weights are calculated using the formula: w = 1.0 / math.pow(math.log(i + steepness), 2) The steepness parameter controls how aggressively recent data is prioritized over historical data, creating a dynamic weight decay that can be fine-tuned for different trading styles. This logarithmic approach provides more nuanced weight distribution compared to exponential moving averages, offering better responsiveness while maintaining stability.
The LMA calculation combines multiple sophisticated components. First, it calculates the logarithmic weighted average of closing prices. Then it measures the slope of this average over a 10-period lookback: lmaSlope = (lma - lma ) / lma * 100 The system also incorporates trend quality assessment using R-squared correlation analysis of log-transformed prices, measuring how well the price data fits a linear trend model over the specified period.
The final signal generation uses the formula: signal = lmaSlope * (0.5 + rSquared * 0.5) which combines the LMA slope with trend quality weighting. When momentum confirmation is enabled, the indicator calculates annualized log-return momentum and applies a multiplier when the momentum direction aligns with the signal direction, strengthening confirmed signals while filtering out weak or counter-trend movements.
🟢 How to Use
1. Signal Interpretation and Threshold Zones
Positive Values (Above Zero): LMA slope indicating bullish momentum with upward price trajectory relative to logarithmic baseline
Negative Values (Below Zero): LMA slope indicating bearish momentum with downward price trajectory relative to logarithmic baseline
Zero Line Crosses: Signal transitions between bullish and bearish regimes, indicating potential trend changes
Long Entry Threshold Zone: Area above positive threshold (default 0.5) indicating confirmed bullish signals suitable for long positions
Short Entry Threshold Zone: Area below negative threshold (default -0.5) indicating confirmed bearish signals suitable for short positions
Extreme Values: Signals exceeding ±1.0 represent strong momentum conditions with higher probability of continuation
2. Momentum Confirmation and Visual Analysis
Signal Color Intensity: Gradient coloring shows signal strength, with brighter colors indicating stronger momentum
Bar Coloring: Optional price bar coloring matches signal direction for quick visual trend identification
Position Labels: Real-time position classification (Bullish/Bearish/Neutral) displayed on the latest bar
Momentum Weight Factor: When short-term log-return momentum aligns with LMA signal direction, the signal receives additional weight confirmation
Trend Quality Component: R-squared values weight the signal strength, with higher correlation indicating more reliable trend conditions
3. Examples: Preconfigured Settings
Default: Universally applicable configuration balanced for medium-term investing and general trading across multiple timeframes and asset classes.
Scalping: Highly responsive setup with shorter period and higher steepness for ultra-short-term trades on 1-15 minute charts, optimized for quick momentum shifts.
Swing Trading: Extended period with moderate steepness and increased smoothing for multi-day positions, designed to filter noise while capturing larger price swings on 1-4 hour and daily charts.
Trend Following: Maximum smoothing with lower steepness for established trend identification, generating fewer but more reliable signals optimal for daily and weekly timeframes.
Mean Reversion: Shorter period with high steepness for counter-trend strategies, more sensitive to extreme moves and reversal opportunities in ranging market conditions.

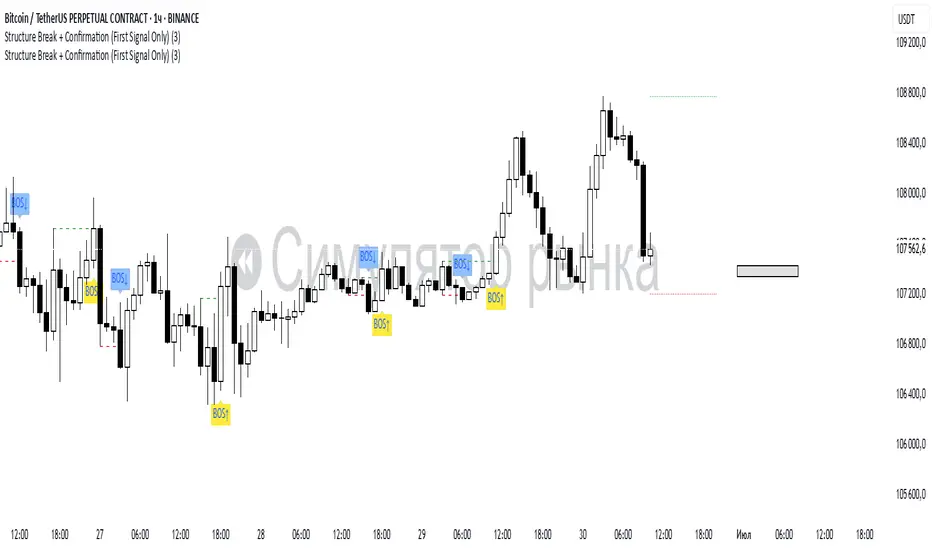
Structure Break + Confirmation (First Signal Only)Swing Detection:
A Swing High is detected when the high of the central candle (based on a lookback period) is greater than the highs of the candles before and after.
A Swing Low is detected when the low of the central candle is lower than the lows of the candles before and after.
Break of Structure (BOS):
A BOS Up is confirmed when a candle closes above the most recent swing high (with a body close).
A BOS Down is confirmed when a candle closes below the most recent swing low.
Confirmation (CONF):
A CONF Up is triggered when price makes a new high after a BOS Up.
A CONF Down is triggered when price makes a new low after a BOS Down.
Only the first confirmation after a BOS is plotted.
Visuals:
Cross marks (×) are plotted at swing points.
BOS signals are shown with green (up) and red (down) labels.
CONF signals are shown with lime (up) and orange (down) triangle markers.
Dotted lines are drawn at the levels of broken swing highs/lows.
Custom EMA High/Low & SMA - [GSK-VIZAG-AP-INDIA] Custom EMA High/Low & SMA -
1. Overview
This indicator overlays a dynamic combination of Exponential Moving Averages (EMA) and Simple Moving Average (SMA) to identify momentum shifts and potential entry/exit zones. It highlights bullish or bearish conditions using color-coded SMA logic and provides visual Buy/Sell signals based on smart crossover and state-based logic.
2. Purpose / Use Case
Designed for traders who want to visually identify momentum breakouts, trend reversals, or pullback opportunities, this tool helps:
Spot high-probability buy/sell zones
Confirm price strength relative to volatility bands (EMA High/Low)
Time entries based on clean visual cues
It works well in trend-following strategies, particularly in intraday or swing setups across any liquid market (indices, stocks, crypto, etc.).
3. Key Features & Logic
✅ EMA High/Low Channel: Acts as dynamic support/resistance boundaries using 20-period EMAs on high and low prices.
✅ Timeframe-Specific SMA: A 33-period SMA calculated from a user-defined timeframe (default: 10-minute) for flexible multi-timeframe analysis.
✅ Signal Generation:
Buy: When SMA drops below EMA Low and close is above EMA High.
Sell: When SMA rises above EMA High and price closes below both EMAs.
Optionally, signals also fire based on SMA color changes (green = bullish, red = bearish).
✅ Strict or Loose Signal Logic: Choose between precise crossovers or broader state-based conditions.
✅ Debugging Tools: Optional markers for granular insight into condition logic.
4. User Inputs & Settings
Input Description
EMA High Length Period for EMA of high prices (default: 20)
EMA Low Length Period for EMA of low prices (default: 20)
SMA Length Period for Simple Moving Average (default: 33)
SMA Timeframe Timeframe for SMA (default: “10”)
Show Buy/Sell Arrows Enable visual arrow signals for Buy/Sell
Strict Signal Logic ON = crossover-based signals; OFF = state logic
Plot Signals on SMA Color Change Enable signals on SMA color shifts (Green/Red)
Show Debug Markers Plot small markers to debug condition logic
5. Visual Elements Explained
🔵 EMA High Line – Blue line marking dynamic resistance
🔴 EMA Low Line – Red line marking dynamic support
🟡 SMA Line – Color-coded based on position:
Green if SMA < EMA Low (Bullish)
Red if SMA > EMA High (Bearish)
Yellow otherwise (Neutral)
✅ BUY / SELL Labels – Displayed below or above candles on valid signals
🛠️ Debug Circles/Triangles – Help visually understand the signal logic when enabled
6. Usage Tips
Best used on 5–30 min timeframes for intraday setups or 1H+ for swing trades.
Confirm signals with volume, price action, or other confluences (like support/resistance).
Use strict mode for more accurate entries, and non-strict mode for broader trend views.
Ideal for identifying pullbacks into trend, or early reversals after volatility squeezes.
7. What Makes It Unique
Multi-timeframe SMA integrated with EMA High/Low bands
Dual signal logic (crossover + color shift)
Visually intuitive and beginner-friendly
Minimal clutter with dynamic signal labeling
Debug mode for transparency and learning
8. Alerts & Automation
The indicator includes built-in alert conditions for:
📈 Buy Alert: Triggered when a bullish condition is detected.
🔻 Sell Alert: Triggered when bearish confirmation is detected.
These alerts can be used with TradingView's alert system for real-time notifications or bot integrations.
9. Technical Concepts Used
EMA (Exponential Moving Average): Reacts faster to recent price, ideal for trend channels
SMA (Simple Moving Average): Smoother average for detecting general trend direction
Crossover Logic: Checks when SMA crosses over or under EMA levels
Color Coding: Visual signal enhancement based on relative positioning
Multi-Timeframe Analysis: SMA calculated on a custom timeframe, powerful for confirmation
10. Disclaimer
This script is for educational and informational purposes only. It is not financial advice. Always backtest thoroughly and validate on demo accounts before applying to live markets. Trading involves risk, and past performance does not guarantee future results.
11. Author Signature
📌 Indicator Name: Custom EMA High/Low & SMA -
👤 Author: GSK-VIZAG-AP-INDIA

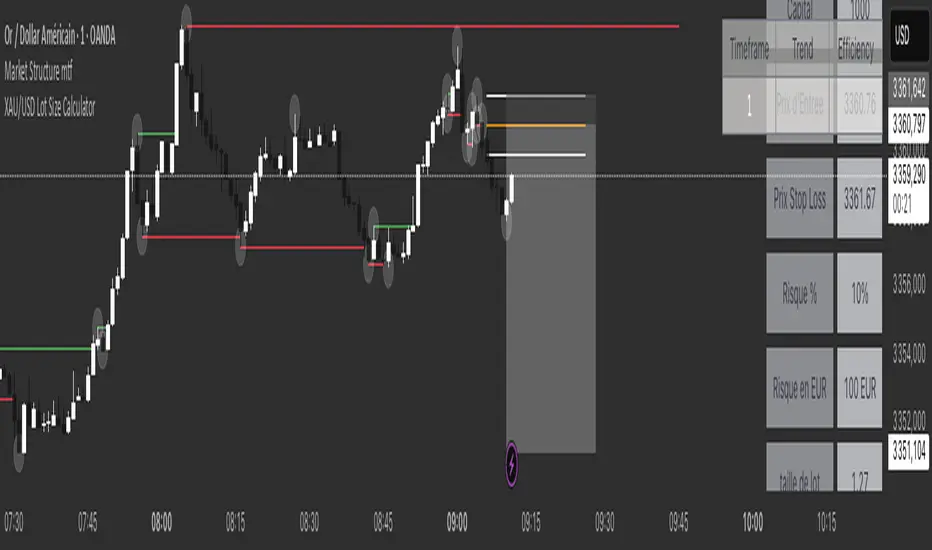
XAU/USD Lot Size CalculatorThis indicator automatically calculates the optimal lot size for XAUUSD (gold) based on the level of risk the trader wants to take. It is designed for traders using MetaTrader 4 or 5 and helps adjust position size according to the specific volatility of gold. The user can set the percentage of capital they are willing to risk on a single trade, for example 1%. The indicator also takes into account the stop loss level, which can be entered in pips or in dollars, as well as the account size (balance or equity).
Based on these parameters, it calculates the exact lot size that matches the risk amount. It then displays on the chart the recommended lot size, the risk amount in dollars, the pip value for XAUUSD, and a confirmation of the stop loss level. This type of indicator is useful for maintaining disciplined risk management and avoiding position sizing errors, especially on a highly volatile asset like gold.
Avg daily rangeThe Average Daily Range (ADR) is a technical indicator that measures the average price movement of a financial instrument over a specific period.

Price Reaction Analysis by Day of WeekOverview
The "Price Reaction Analysis by Day of Week" indicator is a tool that enables traders to analyze historical price reaction patterns to technical indicator signals on a selected day of the week. It examines price behavior on a chosen candle (from 1 to 30) in the next day or subsequent days after a signal, depending on the timeframe, and provides success rate statistics to support data-driven trading decisions. The indicator is optimized for timeframes up to 1 day (e.g., 1D, 12H, 8H, 6H, 4H, 1H, 15M), as the analysis relies on day-of-week comparisons. Lower timeframes generate more signals due to the higher number of candles per day.
Key Features
1. Flexible Technical Indicator Selection
Users can choose one of four technical indicators: RSI, SMI, MA, or Bollinger Bands. Each indicator has configurable parameters, such as:
RSI length, oversold/overbought levels.
SMI length, %K and %D smoothing, signal levels.
MA length.
Bollinger Bands length and multiplier.
2. Day-of-Week Analysis
The indicator allows users to select a day of the week (Monday, Tuesday, Wednesday, Thursday, Friday) for generating signals. It analyzes price reactions on a selected candle (from 1 to 30) in the next day or subsequent days after the signal. Examples:
On a daily timeframe, a signal on Monday can be analyzed for the first, fourth, or later candle (up to 30) in subsequent days (e.g., Tuesday, Wednesday).
On timeframes lower than 1 day (e.g., 12H, 8H, 6H, 4H, 1H, 15M), the analysis targets the selected candle in the next day or subsequent days. For example, on a 4H timeframe, you can analyze the second Tuesday candle following a Monday signal. The maximum timeframe is 1 day to ensure consistent day-of-week analysis.
3. Visual Signals
Signals for the analysis period are marked with background highlights in real-time when the indicator’s conditions are met. The last highlighted candle of the selected day is always analyzed. Arrows are displayed on the chart at the candle specified by the “Candles to Compare” setting (e.g., the first candle if set to 1):
Green upward triangles (below the candle) for successful buy signals (the closing price of the selected candle is higher than the signal candle’s close).
Red downward triangles (above the candle) for successful sell signals (the closing price of the selected candle is lower than the signal candle’s close).
Gray “x” marks for unsuccessful signals (no price reversal in the expected direction). Arrow positions are intuitive: buy signals below the candle, sell signals above. Highlights and arrows do not require waiting for future signals but are essential for calculating statistics.
Note: The first candle of the next day may appear shifted on the chart due to timezone differences, which can affect the timing of signal appearance.
4. Signal Conditions (Highlights) for Each Indicator
RSI: The oscillator is in oversold (buy) or overbought (sell) zones.
SMI: SMI returns from oversold (buy) or overbought (sell) zones.
MA: Price crosses the MA (upward for buy, downward for sell).
Bollinger Bands: Price returns inside the bands (from below for buy, from above for sell).
5. Success Rate Statistics
A table in the top-right corner of the chart displays:
The number of buy and sell signals for the selected day of the week.
The percentage of cases where the price of the selected candle in the next day or subsequent days reversed as expected (e.g., rising after a buy signal). Statistics are based on comparing the closing price of the signal candle with the closing price of the selected candle (e.g., first, fourth) in the next day or subsequent days.
Important: Statistics do not account for price movements within the candle or after its close. The price on the selected candle (e.g., fourth) may be lower than earlier candles but still higher than the signal candle, counting as a positive buy signal, though it does not guarantee profit.
6. Date Range
Users can specify the analysis date range, enabling strategy testing on historical data from a chosen period. Ensure the start and end dates are set correctly.
Applications
The indicator is designed for traders who want to leverage historical patterns for position planning. Examples:
On a 4-hour timeframe: If a sell signal highlight appears on Monday and statistics show an 80% chance that the fourth Tuesday candle is bearish, traders may consider playing a correction at the open of that candle.
On a daily timeframe: If a highlight indicates market overheating, traders may consider entering a position at the open of the first candle after the signal (e.g., Tuesday), provided statistics suggest an edge. Users can analyze the signal on the first candle and check later candles to validate results, increasing confidence in consistent patterns.
Key Settings
Indicator Type: Choose between RSI, SMI, MA, or Bollinger Bands.
Selected Day: Monday, Tuesday, Wednesday, Thursday, or Friday.
Candles to Compare: The number of the candle in the next day or subsequent days (from 1 to 30).
Indicator Parameters: Lengths, levels (e.g., oversold/overbought for RSI).
Background Colors: Configurable highlights for buy and sell signals.
Notes
Timeframes: The indicator is optimized for timeframes up to 1 day (e.g., 1D, 12H, 8H, 6H, 4H, 1H, 15M), as the analysis relies on day-of-week patterns. Timeframes lower than 1 day generate more signals due to the higher number of candles per day.
Candle Shift: The first candle of the next day may appear shifted on the chart due to timezone differences, affecting the timing of signals across markets or platforms.
Statistical Limitations: Results are based on the closing prices of the selected candle, ignoring fluctuations in earlier candles, within the candle, or subsequent price movements. Traders must assess whether entering at the open or after the close of the selected candle is profitable.
Testing: Effectiveness depends on historical data and parameter settings. Testing different configurations across markets and timeframes is recommended.
Who Is It For?
Swing and position traders who base decisions on technical analysis and historical patterns.
Market analysts seeking patterns in price behavior by day of the week.
TradingView users of all experience levels, thanks to an intuitive interface and flexible settings.

ETF Leverage VerificationDo leveraged ETFs really return what they promise?
Do they return the exact 2x or 3x? Or a slightly different multiple?
How much do they deviate from the promised leverage multiples?
Do these deviations impact investors in a positive or negative manner?
These are the questions that I want to answer with this indicator.
The ETF Leverage Verification indicator challenges the conventional understanding of leveraged ETFs by measuring how they actually perform versus their theoretical targets.
Instead of assuming leveraged ETFs perfectly track their target multiple, this indicator quantifies the real-world behavior by comparing the expected returns versus the actual results on every trading day.
Key Features
Measures actual versus expected performance of leveraged ETFs
Tracks deviation patterns across thousands of trading days
Identifies asymmetric behavior in up versus down markets
Quantifies beneficial "cushioning effect" during market declines
Provides statistical summary of performance patterns
Works with any leverage factor (2x, 3x, -1x, etc.)
Compatible with all leveraged ETFs (equity, bond, commodity, volatility)
How to Use the Indicator
Enter the Expected Leverage Factor (default: 2.0)
Select the Base Asset (underlying index, e.g., SPX)
Select the Leveraged Asset (leveraged ETF, e.g., SSO)
Understanding the Results
Green markers: Days when the ETF outperformed its expected multiple
Red markers: Days when the ETF underperformed its expected multiple
Data Table:
Positive Deviations: Count of days with better-than-expected performance
Negative Deviations: Count of days with worse-than-expected performance
Avg Deviation: Average magnitude of deviation from expected returns
Frequency Skew: Difference between beneficial deviations in down vs. up markets
Impact: Overall assessment of pattern benefit to investors
Summary Label:
Percentage of positive deviations in up and down markets
Total sample size for statistical significance
Key Patterns to Look For
Positive Deviation in Negative Days:
This occurs when a leveraged ETF falls less than expected during market declines. For example, if SPX falls 1% and a 2x ETF falls only 1.8% (instead of the expected 2%), this creates a +0.2% deviation. This pattern is beneficial as it provides downside protection.
Negative Deviation in Positive Days:
This happens when a leveraged ETF rises less than expected during market advances. For example, if SPX rises 1% and a 2x ETF rises only 1.9% (instead of the expected 2%), this creates a -0.1% deviation. This pattern reduces upside performance.
Frequency Skew:
The most critical metric that measures how much more frequently beneficial deviations occur in down markets compared to up markets. A higher positive skew indicates a stronger asymmetric pattern that helps long-term performance.
Mathematical Background
The indicator computes the deviation between expected and actual performance:
Deviation = Actual Return - Expected Return
Where:
Expected Return = Base Asset Return × Leverage Factor
The deviation is then categorized into four possible outcomes:
Positive deviation on positive market days
Negative deviation on positive market days
Positive deviation on negative market days
Negative deviation on negative market days
In short, more positive deviations are good for investors.
Please feel free to criticize. I'm happy to improve the indicator.

F&O Time Zones – Final Fixed📌 This indicator highlights high-probability intraday time zones used in Indian F&O (Futures & Options) strategies. Ideal for scalping, breakout setups, and trap avoidance.
🕒 Covered Time Zones:
• 9:15 – 9:21 AM → Flash Trades (first 1-minute volatility)
• 9:21 – 9:30 AM → Smart Money Trap (VWAP fakeouts)
• 9:30 – 9:50 AM → Fake Breakout Zone
• 9:50 – 10:15 AM → Institutional Entry Timing
• 10:15 – 10:45 AM → VWAP Range Scalps
• 10:45 – 11:15 AM → Second Trap Zone
• 11:15 – 1:00 PM → Trend Continuation Window
• 1:00 – 1:45 PM → Volatility Compression
• 1:45 – 2:15 PM → Institutional Exit Phase 1
• 2:15 – 2:45 PM → Trend Acceleration / Reversals
• 2:45 – 3:15 PM → Expiry Scalping Zone
• 3:15 – 3:30 PM → Dead Zone (square-off time)
🔧 Features:
✓ Clean vertical lines per zone
✓ Optional label positions (top or bottom)
✓ Adjustable line style, width, and color
🧠 Best used on: NIFTY, BANKNIFTY, FINNIFTY (5-min or lower)
---
🔒 **Disclaimer**:
This script is for **educational purposes only**. It is not financial advice. Trading involves risk. Please consult a professional or do your own research before taking any positions.
—
👤 Script by: **JoanJagan**
🛠️ Built in Pine Script v5

GCM Bull Bear RiderGCM Bull Bear Rider (GCM BBR)
Your Ultimate Trend-Riding Companion
GCM Bull Bear Rider is a comprehensive, all-in-one trend analysis tool designed to eliminate guesswork and provide a crystal-clear view of market direction. By leveraging a highly responsive Jurik Moving Average (JMA), this indicator not only identifies bullish and bearish trends with precision but also tracks their performance in real-time, helping you ride the waves of momentum from start to finish.
Whether you are a scalper, day trader, or swing trader, the GCM BBR adapts to your style, offering a clean, intuitive, and powerful visual guide to the market's pulse.
Key Features
JMA-Powered Trend Lines (UTPL & DTPL): The core of the indicator. A green "Up Trend Period Line" (UTPL) appears when the JMA's slope turns positive (buyers are in control), and a red "Down Trend Period Line" (DTPL) appears when the slope turns negative (sellers are in control). The JMA is used for its low lag and superior smoothing, giving you timely and reliable trend signals.
Live Profit Tracking Labels: This is the standout feature. As soon as a trend period begins, a label appears showing the real-time profit (P:) from the trend's starting price. This label moves with the trend, giving you instant feedback on its performance and helping you make informed trade management decisions.
Historical Performance Analysis: The profit labels remain on the chart for completed trends, allowing you to instantly review past performance. See at a glance which trends were profitable and which were not, aiding in strategy refinement and backtesting.
Automatic Chart Decluttering: To keep your chart clean and focused on significant moves, the indicator automatically removes the historical profit label for any trend that fails to achieve a minimum profit threshold (default is 0.5 points).
Dual-Ribbon Momentum System:
JMA / Short EMA Ribbon: Visualizes short-term momentum. A green fill indicates immediate bullish strength, while a red fill shows bearish pressure.
Short EMA / Long EMA Ribbon: Acts as a long-term trend filter, providing broader market context for your decisions.
"GCM Hunt" Entry Signals: The indicator includes optional pullback entry signals (green and red triangles). These appear when the price pulls back to a key moving average and then recovers in the direction of the primary trend, offering high-probability entry opportunities.
How to Use
Identify the Trend: Look for the appearance of a solid green line (UTPL) for a bullish bias or a solid red line (DTPL) for a bearish bias. Use the wider EMA ribbon for macro trend confirmation.
Time Your Entry: For aggressive entries, you can enter as soon as a new trend line appears. For more conservative entries, wait for a "GCM Hunt" triangle signal, which confirms a successful pullback.
Ride the Trend & Manage Your Trade: The moving profit label (P:) is your guide. As long as the trend line continues and the profit is increasing, you can confidently stay in the trade. A flattening JMA or a decreasing profit value can signal that the trend is losing steam.
Focus Your Strategy: Use the Display Mode setting to switch between "Buyers Only," "Sellers Only," or both. This allows you to completely hide opposing signals and focus solely on long or short opportunities.
Core Settings
Display Mode: The master switch. Choose to see visuals for "Buyers & Sellers," "Buyers Only," or "Sellers Only."
JMA Settings (Length, Phase): Fine-tune the responsiveness of the core JMA engine.
EMA Settings (Long, Short): Adjust the lengths of the moving averages that define the ribbons and "Hunt" signals.
Label Offset (ATR Multiplier): Customize the gap between the trend lines and the profit labels to avoid overlap with candles.
Filters (EMA, RSI, ATR, Strong Candle): Enable or disable various confirmation filters to strengthen the "Hunt" entry signals according to your risk tolerance.
Add the GCM Bull Bear Rider to your chart today and transform the way you see and trade the trend!
ENJOY

Aetherium Institutional Market Resonance EngineAetherium Institutional Market Resonance Engine (AIMRE)
A Three-Pillar Framework for Decoding Institutional Activity
🎓 THEORETICAL FOUNDATION
The Aetherium Institutional Market Resonance Engine (AIMRE) is a multi-faceted analysis system designed to move beyond conventional indicators and decode the market's underlying structure as dictated by institutional capital flow. Its philosophy is built on a singular premise: significant market moves are preceded by a convergence of context , location , and timing . Aetherium quantifies these three dimensions through a revolutionary three-pillar architecture.
This system is not a simple combination of indicators; it is an integrated engine where each pillar's analysis feeds into a central logic core. A signal is only generated when all three pillars achieve a state of resonance, indicating a high-probability alignment between market organization, key liquidity levels, and cyclical momentum.
⚡ THE THREE-PILLAR ARCHITECTURE
1. 🌌 PILLAR I: THE COHERENCE ENGINE (THE 'CONTEXT')
Purpose: To measure the degree of organization within the market. This pillar answers the question: " Is the market acting with a unified purpose, or is it chaotic and random? "
Conceptual Framework: Institutional campaigns (accumulation or distribution) create a non-random, organized market environment. Retail-driven or directionless markets are characterized by "noise" and chaos. The Coherence Engine acts as a filter to ensure we only engage when institutional players are actively steering the market.
Formulaic Concept:
Coherence = f(Dominance, Synchronization)
Dominance Factor: Calculates the absolute difference between smoothed buying pressure (volume-weighted bullish candles) and smoothed selling pressure (volume-weighted bearish candles), normalized by total pressure. A high value signifies a clear winner between buyers and sellers.
Synchronization Factor: Measures the correlation between the streams of buying and selling pressure over the analysis window. A high positive correlation indicates synchronized, directional activity, while a negative correlation suggests choppy, conflicting action.
The final Coherence score (0-100) represents the percentage of market organization. A high score is a prerequisite for any signal, filtering out unpredictable market conditions.
2. 💎 PILLAR II: HARMONIC LIQUIDITY MATRIX (THE 'LOCATION')
Purpose: To identify and map high-impact institutional footprints. This pillar answers the question: " Where have institutions previously committed significant capital? "
Conceptual Framework: Large institutional orders leave indelible marks on the market in the form of anomalous volume spikes at specific price levels. These are not random occurrences but are areas of intense historical interest. The Harmonic Liquidity Matrix finds these footprints and consolidates them into actionable support and resistance zones called "Harmonic Nodes."
Algorithmic Process:
Footprint Identification: The engine scans the historical lookback period for candles where volume > average_volume * Institutional_Volume_Filter. This identifies statistically significant volume events.
Node Creation: A raw node is created at the mean price of the identified candle.
Dynamic Clustering: The engine uses an ATR-based proximity algorithm. If a new footprint is identified within Node_Clustering_Distance (ATR) of an existing Harmonic Node, it is merged. The node's price is volume-weighted, and its magnitude is increased. This prevents chart clutter and consolidates nearby institutional orders into a single, more significant level.
Node Decay: Nodes that are older than the Institutional_Liquidity_Scanback period are automatically removed from the chart, ensuring the analysis remains relevant to recent market dynamics.
3. 🌊 PILLAR III: CYCLICAL RESONANCE MATRIX (THE 'TIMING')
Purpose: To identify the market's dominant rhythm and its current phase. This pillar answers the question: " Is the market's immediate energy flowing up or down? "
Conceptual Framework: Markets move in waves and cycles of varying lengths. Trading in harmony with the current cyclical phase dramatically increases the probability of success. Aetherium employs a simplified wavelet analysis concept to decompose price action into short, medium, and long-term cycles.
Algorithmic Process:
Cycle Decomposition: The engine calculates three oscillators based on the difference between pairs of Exponential Moving Averages (e.g., EMA8-EMA13 for short cycle, EMA21-EMA34 for medium cycle).
Energy Measurement: The 'energy' of each cycle is determined by its recent volatility (standard deviation). The cycle with the highest energy is designated as the "Dominant Cycle."
Phase Analysis: The engine determines if the dominant cycles are in a bullish phase (rising from a trough) or a bearish phase (falling from a peak).
Cycle Sync: The highest conviction timing signals occur when multiple cycles (e.g., short and medium) are synchronized in the same direction, indicating broad-based momentum.
🔧 COMPREHENSIVE INPUT SYSTEM
Pillar I: Market Coherence Engine
Coherence Analysis Window (10-50, Default: 21): The lookback period for the Coherence Engine.
Lower Values (10-15): Highly responsive to rapid shifts in market control. Ideal for scalping but can be sensitive to noise.
Balanced (20-30): Excellent for day trading, capturing the ebb and flow of institutional sessions.
Higher Values (35-50): Smoother, more stable reading. Best for swing trading and identifying long-term institutional campaigns.
Coherence Activation Level (50-90%, Default: 70%): The minimum market organization required to enable signal generation.
Strict (80-90%): Only allows signals in extremely clear, powerful trends. Fewer, but potentially higher quality signals.
Standard (65-75%): A robust filter that effectively removes choppy conditions while capturing most valid institutional moves.
Lenient (50-60%): Allows signals in less-organized markets. Can be useful in ranging markets but may increase false signals.
Pillar II: Harmonic Liquidity Matrix
Institutional Liquidity Scanback (100-400, Default: 200): How far back the engine looks for institutional footprints.
Short (100-150): Focuses on recent institutional activity, providing highly relevant, immediate levels.
Long (300-400): Identifies major, long-term structural levels. These nodes are often extremely powerful but may be less frequent.
Institutional Volume Filter (1.3-3.0, Default: 1.8): The multiplier for detecting a volume spike.
High (2.5-3.0): Only registers climactic, undeniable institutional volume. Fewer, but more significant nodes.
Low (1.3-1.7): More sensitive, identifying smaller but still relevant institutional interest.
Node Clustering Distance (0.2-0.8 ATR, Default: 0.4): The ATR-based distance for merging nearby nodes.
High (0.6-0.8): Creates wider, more consolidated zones of liquidity.
Low (0.2-0.3): Creates more numerous, precise, and distinct levels.
Pillar III: Cyclical Resonance Matrix
Cycle Resonance Analysis (30-100, Default: 50): The lookback for determining cycle energy and dominance.
Short (30-40): Tunes the engine to faster, shorter-term market rhythms. Best for scalping.
Long (70-100): Aligns the timing component with the larger primary trend. Best for swing trading.
Institutional Signal Architecture
Signal Quality Mode (Professional, Elite, Supreme): Controls the strictness of the three-pillar confluence.
Professional: Loosest setting. May generate signals if two of the three pillars are in strong alignment. Increases signal frequency.
Elite: Balanced setting. Requires a clear, unambiguous resonance of all three pillars. The recommended default.
Supreme: Most stringent. Requires perfect alignment of all three pillars, with each pillar exhibiting exceptionally strong readings (e.g., coherence > 85%). The highest conviction signals.
Signal Spacing Control (5-25, Default: 10): The minimum bars between signals to prevent clutter and redundant alerts.
🎨 ADVANCED VISUAL SYSTEM
The visual architecture of Aetherium is designed not merely for aesthetics, but to provide an intuitive, at-a-glance understanding of the complex data being processed.
Harmonic Liquidity Nodes: The core visual element. Displayed as multi-layered, semi-transparent horizontal boxes.
Magnitude Visualization: The height and opacity of a node's "glow" are proportional to its volume magnitude. More significant nodes appear brighter and larger, instantly drawing the eye to key levels.
Color Coding: Standard nodes are blue/purple, while exceptionally high-magnitude nodes are highlighted in an accent color to denote critical importance.
🌌 Quantum Resonance Field: A dynamic background gradient that visualizes the overall market environment.
Color: Shifts from cool blues/purples (low coherence) to energetic greens/cyans (high coherence and organization), providing instant context.
Intensity: The brightness and opacity of the field are influenced by total market energy (a composite of coherence, momentum, and volume), making powerful market states visually apparent.
💎 Crystalline Lattice Matrix: A geometric web of lines projected from a central moving average.
Mathematical Basis: Levels are projected using multiples of the Golden Ratio (Phi ≈ 1.618) and the ATR. This visualizes the natural harmonic and fractal structure of the market. It is not arbitrary but is based on mathematical principles of market geometry.
🧠 Synaptic Flow Network: A dynamic particle system visualizing the engine's "thought process."
Node Density & Activation: The number of particles and their brightness/color are tied directly to the Market Coherence score. In high-coherence states, the network becomes a dense, bright, and organized web. In chaotic states, it becomes sparse and dim.
⚡ Institutional Energy Waves: Flowing sine waves that visualize market volatility and rhythm.
Amplitude & Speed: The height and speed of the waves are directly influenced by the ATR and volume, providing a feel for market energy.
📊 INSTITUTIONAL CONTROL MATRIX (DASHBOARD)
The dashboard is the central command console, providing a real-time, quantitative summary of each pillar's status.
Header: Displays the script title and version.
Coherence Engine Section:
State: Displays a qualitative assessment of market organization: ◉ PHASE LOCK (High Coherence), ◎ ORGANIZING (Moderate Coherence), or ○ CHAOTIC (Low Coherence). Color-coded for immediate recognition.
Power: Shows the precise Coherence percentage and a directional arrow (↗ or ↘) indicating if organization is increasing or decreasing.
Liquidity Matrix Section:
Nodes: Displays the total number of active Harmonic Liquidity Nodes currently being tracked.
Target: Shows the price level of the nearest significant Harmonic Node to the current price, representing the most immediate institutional level of interest.
Cycle Matrix Section:
Cycle: Identifies the currently dominant market cycle (e.g., "MID ") based on cycle energy.
Sync: Indicates the alignment of the cyclical forces: ▲ BULLISH , ▼ BEARISH , or ◆ DIVERGENT . This is the core timing confirmation.
Signal Status Section:
A unified status bar that provides the final verdict of the engine. It will display "QUANTUM SCAN" during neutral periods, or announce the tier and direction of an active signal (e.g., "◉ TIER 1 BUY ◉" ), highlighted with the appropriate color.
🎯 SIGNAL GENERATION LOGIC
Aetherium's signal logic is built on the principle of strict, non-negotiable confluence.
Condition 1: Context (Coherence Filter): The Market Coherence must be above the Coherence Activation Level. No signals can be generated in a chaotic market.
Condition 2: Location (Liquidity Node Interaction): Price must be actively interacting with a significant Harmonic Liquidity Node.
For a Buy Signal: Price must be rejecting the Node from below (testing it as support).
For a Sell Signal: Price must be rejecting the Node from above (testing it as resistance).
Condition 3: Timing (Cycle Alignment): The Cyclical Resonance Matrix must confirm that the dominant cycles are synchronized with the intended trade direction.
Signal Tiering: The Signal Quality Mode input determines how strictly these three conditions must be met. 'Supreme' mode, for example, might require not only that the conditions are met, but that the Market Coherence is exceptionally high and the interaction with the Node is accompanied by a significant volume spike.
Signal Spacing: A final filter ensures that signals are spaced by a minimum number of bars, preventing over-alerting in a single move.
🚀 ADVANCED TRADING STRATEGIES
The Primary Confluence Strategy: The intended use of the system. Wait for a Tier 1 (Elite/Supreme) or Tier 2 (Professional/Elite) signal to appear on the chart. This represents the alignment of all three pillars. Enter after the signal bar closes, with a stop-loss placed logically on the other side of the Harmonic Node that triggered the signal.
The Coherence Context Strategy: Use the Coherence Engine as a standalone market filter. When Coherence is high (>70%), favor trend-following strategies. When Coherence is low (<50%), avoid new directional trades or favor range-bound strategies. A sharp drop in Coherence during a trend can be an early warning of a trend's exhaustion.
Node-to-Node Trading: In a high-coherence environment, use the Harmonic Liquidity Nodes as both entry points and profit targets. For example, after a BUY signal is generated at one Node, the next Node above it becomes a logical first profit target.
⚖️ RESPONSIBLE USAGE AND LIMITATIONS
Decision Support, Not a Crystal Ball: Aetherium is an advanced decision-support tool. It is designed to identify high-probability conditions based on a model of institutional behavior. It does not predict the future.
Risk Management is Paramount: No indicator can replace a sound risk management plan. Always use appropriate position sizing and stop-losses. The signals provided are probabilistic, not certainties.
Past Performance Disclaimer: The market models used in this script are based on historical data. While robust, there is no guarantee that these patterns will persist in the future. Market conditions can and do change.
Not a "Set and Forget" System: The indicator performs best when its user understands the concepts behind the three pillars. Use the dashboard and visual cues to build a comprehensive view of the market before acting on a signal.
Backtesting is Essential: Before applying this tool to live trading, it is crucial to backtest and forward-test it on your preferred instruments and timeframes to understand its unique behavior and characteristics.
🔮 CONCLUSION
The Aetherium Institutional Market Resonance Engine represents a paradigm shift from single-variable analysis to a holistic, multi-pillar framework. By quantifying the abstract concepts of market context, location, and timing into a unified, logical system, it provides traders with an unprecedented lens into the mechanics of institutional market operations.
It is not merely an indicator, but a complete analytical engine designed to foster a deeper understanding of market dynamics. By focusing on the core principles of institutional order flow, Aetherium empowers traders to filter out market noise, identify key structural levels, and time their entries in harmony with the market's underlying rhythm.
"In all chaos there is a cosmos, in all disorder a secret order." - Carl Jung
— Dskyz, Trade with insight. Trade with confluence. Trade with Aetherium.

Intraday Session Levels: Pre-Mkt, 5m, 15m (Replay/Toggle/Labels)Intraday Session Levels: Pre-Mkt, 5m, 15m (Replay/Toggle/Labels)
Version v1.0
Live session levels for every trader!
This indicator automatically tracks and draws the most actionable intraday levels as they develop—live in real-time and fully compatible with TradingView’s bar replay and backtesting.
How it works:
Pre-Market High & Low:
Levels appear and update live as soon as the pre-market session starts (4:00am ET), then “freeze” at the official open (9:30am ET) and remain visible for the rest of the day.
First 5-Minute Candle High/Low:
Drawn instantly after the first 5-minute candle (9:30–9:35am ET) completes.
First 15-Minute Candle High/Low:
Drawn right after the first 15-minute candle (9:30–9:45am ET) completes.
Labels on every line
Each level is clearly labeled on your chart (“PreMkt High”, “5m Low”, “15m High”, etc).
Perfect for backtesting:
All levels display exactly as they would have appeared in real time, making this indicator fully bar replay and historical test compatible.
Flexible ON/OFF toggles:
Instantly show or hide Pre-Mkt, 5m, and 15m levels via the settings panel.
Why use it?
Identify support/resistance and key reaction zones intraday
Fade or break the opening range with confidence
Backtest your strategies with accurate historical context
Reduce chart clutter with customizable, minimal visuals
Whether you’re a scalper, day trader, or backtest enthusiast, this tool keeps your charts focused and your edge sharp.
Developed by

Last 10 Sessions: High, Low, Pivot, GapLast 10 Sessions: High, Low, Pivot, Gap
This indicator highlights the most important price levels from the last 10 completed trading sessions to help intraday and swing traders quickly spot potential support, resistance, and price reaction zones.
Key Features:
Previous Highs and Lows : Visualize the high and low from each of the past 10 sessions. These are the most commonly tested breakout and reversal points for day trading.
Session Pivots: The classic pivot formula ((High + Low + Close) / 3) for each of the last 10 sessions, often acting as a market “equilibrium” or intraday magnet.
Gaps: Displays the difference between each day’s open and the previous session’s close (“gap”), showing sentiment shifts and possible gap fill targets.
Clean, Faded Visuals: All lines and labels are subtly faded so your chart remains clear and uncluttered, with each level labeled by how many sessions ago it occurred.
Full Customization: Instantly toggle any level type (High, Low, Pivot, Gap) ON/OFF in settings, extend lines to the right, and adjust their forward length.
Bulletproof Logic: Never throws runtime errors. Lines and labels only display when valid data is present.
How to Use:
Use recent highs/lows for breakout, breakdown, or mean reversion trades.
Spot where multiple levels from past sessions cluster together for high-probability reversal or breakout areas.
Watch pivots for intraday bias, and gaps for sentiment and possible fill plays.
Perfect for all intraday timeframes.
If you want a powerful yet minimal map of where price is most likely to react, this indicator is for you!
Developed by

Fisher Transform Background StripesThe "Fisher Transform Background Stripes" indicator is an easy-to-use tool that helps traders identify extreme market conditions using the Fisher Transform, a technical indicator that normalizes price data to highlight potential reversals. It displays colored background stripes on your chart to show when the market is oversold or undersold, making it simple to spot trading opportunities.
How It Works:Fisher Transform Calculation: The indicator calculates the Fisher Transform based on a user-defined period (default: 9), using the average of high and low prices to measure market momentum and identify extreme price movements.
Oversold/Undersold Levels: It highlights when the Fisher Transform is above a user-set oversold level (default: 3.0) with red background stripes, or below an undersold level (default: -2.0) with green background stripes.
Visual Feedback: Red and green stripes appear on the chart to mark oversold or undersold conditions, helping you quickly understand market extremes.
Customization: You can adjust the Fisher Transform period, oversold/undersold levels, background colors, and transparency. You can also enable an optional Fisher Transform plot or display values on the chart for debugging.
Wait for Close Option: You can choose whether the indicator waits for the timeframe’s candle to close before showing stripes, ensuring more reliable signals.
Alerts: Optional alerts notify you when the Fisher Transform crosses into oversold or undersold zones (always using confirmed values for accuracy).
Who It’s For: This indicator is ideal for beginner and intermediate traders looking for a clear, visual way to track extreme market conditions and potential reversals using the Fisher Transform.
Key Features:Colored background stripes for oversold (red) and undersold (green) conditions.
Customizable settings for period, levels, colors, and transparency.
Option to wait for candle close for more accurate signals.
Optional Fisher Transform plot and value display for analysis.
Alerts to notify you of key Fisher Transform level crossings.
This indicator provides a straightforward way to monitor market extremes and make informed trading decisions.

RSI OS/OB Background StripesThe "RSI OS/OB Background Stripes" indicator is a simple tool designed to help traders visualize overbought and oversold market conditions using the Relative Strength Index (RSI). It highlights these conditions by displaying colored background stripes directly on your chart, making it easy to spot potential trading opportunities.
How It Works:RSI Calculation: The indicator calculates the RSI, a popular momentum indicator that measures the speed and change of price movements, using a default period of 14 (customizable).
Overbought/Oversold Levels: It marks areas where the RSI is above a user-defined overbought level (default: 70) with red background stripes, and below an oversold level (default: 30) with green background stripes.
Visual Feedback: The colored stripes appear on the chart when the RSI enters overbought (red) or oversold (green) zones, helping you quickly identify market conditions.
Customization: You can adjust the RSI period, overbought/oversold levels, background colors, and transparency. You can also choose to show the RSI line in a separate panel or display RSI values on the chart for debugging.
Alerts: The indicator includes optional alerts that notify you when the RSI crosses into overbought or oversold territory.
Who It’s For: This indicator is perfect for beginner and intermediate traders who want a clear, visual way to track RSI-based overbought and oversold conditions without cluttering their charts.
Key Features:Easy-to-read background stripes for overbought (red) and oversold (green) conditions.
Fully customizable RSI settings, colors, and transparency.
Optional RSI plot and value display for deeper analysis.
Alerts to keep you informed of key RSI level crossings.
This indicator is a straightforward way to monitor market momentum and make informed trading decisions.

GeeksDoByte 15m & 30m ORB + Prev Day High/LowCME_MINI:NQ1!
How It Works
Opening Ranges
At 9:30 ET, the script begins tracking the high & low.
It uses two fixed sessions:
15 min from 09:30 to 09:45
30 min from 09:30 to 10:00
On the very first bar of each session it initializes the range, then continuously updates the high/low on each new intraday bar.
Dashed lines are drawn when the session opens and extended horizontally across subsequent bars.
Previous Day’s Levels
Independently, it fetches yesterday’s high and low via a daily security call.
These historic levels are plotted as simple horizontal lines for daily context.
How to Use
Breakout Entries
A close above the 15 min ORB high can signal an early breakout; a further push above the 30 min ORB high confirms extended momentum.
Conversely, breaks below the respective lows can indicate short setups.
Support & Resistance
Yesterday’s high/low often act as magnet levels. If price is near the previous high when the opening ranges break, you get a confluence zone worth watching.
Trade Management
Combine the two opening-range levels to tier your stops or scale in.
For example, you might place an initial stop below the 15 min low and a wider stop below the 30 min low.

Z-Score + Momentum Strategy (Filtered)✅ What the script does:
Calculates the Z-Score of price with EMA smoothing.
Calculates Momentum as the difference between the current price and the price n bars ago.
Generates signals:
Buy: When the Z-Score is rising and relatively positive, and momentum is increasing.
Sell: When the Z-Score is falling, and momentum is decreasing.
Plots BUY and SELL labels on the candles.
Provides alerts that can be activated from the TradingView settings.
Displays Z-Score and Momentum in the lower pane of the chart.
🎯 How to use the script:
Copy the code into the Pine Editor on TradingView.
Click "Add to Chart".
Enable alerts using the alertcondition settings.
You can modify the following parameters:
Z-Score period: length
Momentum lookback period: momentumLength
Z-Score entry threshold: threshold

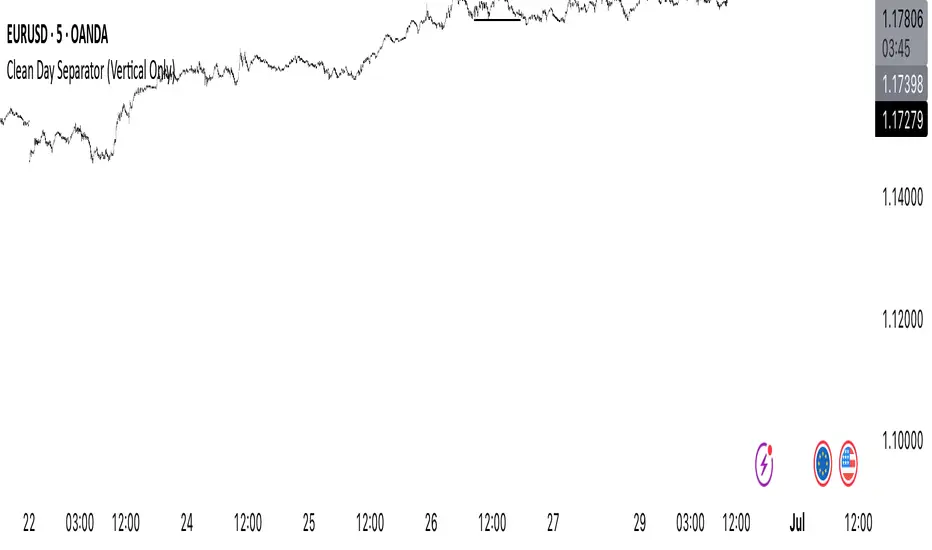
Clean Day Separator (Vertical Only)Clean Day Separator (Vertical Only) is a minimalist indicator for traders who value clarity and structure on their charts.
This tool draws:
✅ Vertical dashed lines at the start of each new day
✅ Optional day-of-week labels (Monday, Tuesday, etc.)
It’s designed specifically for clean chart lovers — no horizontal lines, no boxes, just what you need to mark time and keep your focus.
Perfect for:
Intraday traders who track market rhythm
Price action purists
Anyone who wants to reduce visual noise
Customizable settings:
Toggle day labels on/off
Choose line and text colors
Set label size to match your chart style
[ BETA ][ IND ][ LIB ] Dynamic LookBack RSI RangeGet visual confirmation with this indicator if the current range selected had been oversold or overbough in the latest n bars

Navy Seal Trading - EdgarTrader📌 Navy Seal Trading – Asia, London, and NY Sessions
This indicator clearly displays the ranges of the Asia, London, and New York sessions, featuring:
✅ Full range visualization for each session
✅ Asia session high, low, and midline, with extended projection lines for precise reaction analysis
✅ Clean, minimalistic, and professional colors to keep your chart focused
🔷 Designed for the Navy Seal Trading community, focused on precision, discipline, and professional execution in the markets.
Use it to:
✔️ Mark liquidity zones
✔️ Identify Asia manipulation ranges
✔️ Prepare executions in London and NY with clear context
💡 Remember: Clarity in your zones gives you the confidence and discipline to execute like a true Navy Seal Trader.

TrendBoxThis indicator is called "TrendBox," designed to help traders analyze daily price ranges using several technical indicators. Below is a breakdown of its functionality, purpose, and key components:
Purpose
The script overlays indicators on a chart to assess whether the price is above or below key levels and moving in a trend.
VIX-based expected range (index fund targeted)
- This helps calculate the expected dealers range based on VIX implications. You can expect to see ranges be bought on and sold on. Moving outside this range creates heightened volatility and most of the time a gamma squeeze follows.
VWAP (Volume Weighted Average Price)
- This allows you to understand the mid point or average pricing of the daily session. If you're paying a premium or getting a discount on the daily session.
Daily Market Open
- Identifying the market open price is a key level on a daily session and allows you to identify some level of intraday trend.
Daily 4-period VWMA
- This is a crucial role of our indicator and showing short term time frame bias. Seeing price move over the top of our daily 4 level establishes a short term trend and can be used as a distribution guide, closing positions when we see longer time frame candles close under it. Vice versa for shorting.
It also displays a status box (optional) summarizing whether the price is above or below these levels, helping traders quickly evaluate market conditions.

TTM Squeeze Value OscillatorThis indicator is specifically designed for use with TradingView's Stock Screener, not for chart analysis. It provides numerical values and binary signals that allow traders to efficiently scan stocks for specific TTM Squeeze conditions, momentum patterns, and EMA alignments.
What It Does
The TTM Squeeze Value Oscillator converts the popular TTM Squeeze indicator into a screenable format by outputting specific numerical values and binary signals (1 or 0) that can be filtered in TradingView's screener tool.
Key Features
1. TTM Squeeze Compression Levels
Value 0: Low Compression (Black) - Bollinger Bands inside outer Keltner Channels
Value 1: Mid Compression (Red) - Bollinger Bands inside middle Keltner Channels
Value 2: High Compression (Orange) - Bollinger Bands inside inner Keltner Channels
Value 3: Squeeze Fired (Green) - Bollinger Bands outside Keltner Channels
2. Momentum Analysis
Four distinct momentum conditions based on TTM Squeeze methodology:
Buy Momentum Increasing - Positive momentum growing stronger
Buy Momentum Decreasing - Positive momentum weakening
Sell Momentum Increasing - Negative momentum growing stronger
Sell Momentum Decreasing - Negative momentum weakening
3. EMA Stacking Analysis
Three EMA alignment patterns using 8, 21, and 48 period EMAs:
EMA Stacked Bullish - 8 EMA > 21 EMA > 48 EMA (uptrend alignment)
EMA Stacked Bearish - 8 EMA < 21 EMA < 48 EMA (downtrend alignment)
EMA Mixed - EMAs not in clear bullish or bearish alignment
4. Consecutive Day Counters
Tracks how many consecutive days each squeeze condition has persisted:
Low Compression Days
Mid Compression Days
High Compression Days
Squeeze Fired Days
5. Combined Signal Analysis
Pre-calculated combinations of squeeze conditions with momentum:
All squeeze levels combined with all four momentum conditions
16 total combined signals for advanced screening

Order Blocks v2Order Blocks v2 – Smart OB Detection with Time & FVG Filters
Order Blocks v2 is an advanced tool designed to identify potential institutional footprints in the market by dynamically plotting bullish and bearish order blocks.
This indicator refines classic OB logic by combining:
Fractal-based break conditions
Time-level filtering (Power of 3)
Optional Fair Value Gap (FVG) confirmation
Real-time plotting and auto-invalidation
Perfect for traders using ICT, Smart Money, or algorithmic timing models like Hopplipka.
🧠 What the indicator does
Detects order blocks after break of bullish/bearish fractals
Supports 3-bar or 5-bar fractal structures
Allows OB detection based on close breaks or high/low breaks
Optionally confirms OBs only if followed by a Fair Value Gap within N candles
Filters OBs based on specific time levels (3, 7, 11, 14) — core anchors in many algorithmic models
Automatically deletes invalidated OBs once price closes through the zone
⚙️ How it works
The indicator:
Tracks local fractal highs/lows
Once a fractal is broken by price, it backtracks to identify the best OB candle (highest bullish or lowest bearish)
Validates the level by checking:
OB type logic (close or HL break)
Time stamp match with algorithmic time anchors (e.g. 3, 7, 11, 14 – known from the Power of 3 concept)
Optional FVG confirmation after OB
Plots OB zones as lines (body or wick-based) and removes them if invalidated by a candle close
This ensures traders see only valid, active levels — removing noise from broken or out-of-context zones.
🔧 Customization
Choose 3-bar or 5-bar fractals
OB detection type: close break or HL break
Enable/disable OBs only on times 3, 7, 11, 14 (Hopplipka style)
Optional: require nearby FVG for validation
Line style: solid, dashed, or dotted
Adjust OB length, width, color, and use body or wick for OB height
🚀 How to use it
Add the script to your chart
Choose your preferred OB detection mode and filters
Use plotted OB zones to:
Anticipate price rejections and reversals
Validate Smart Money or ICT-based entry zones
Align setups with algorithmic time sequences (3, 7, 11, 14)
Filter out invalid OBs automatically, keeping your chart clean
The tool is useful on any timeframe but performs best when combined with a liquidity-based or time-anchored trading model.
💡 What makes it original
Combines fractal logic with OB confirmation and time anchors
Implements time-based filtering inspired by Hopplipka’s interpretation of the "Power of 3"
Allows OB validation via optional FVG follow-up — rarely available in public indicators
Auto-cleans invalidated OBs to reduce clutter
Designed to reflect market structure logic used by institutions and algorithms
💬 Why it’s worth using
Order Blocks v2 simplifies one of the most nuanced parts of SMC: identifying clean and high-probability OBs.
It removes subjectivity, adds clear timing logic, and integrates optional confluence tools — like FVG.
For traders serious about algorithmic-level structure and clean setups, this tool delivers both logic and clarity.
⚠️ Important
This indicator:
Is not a signal generator or financial advice tool
Is intended for experienced traders using OB/SMC/time-based logic
Does not predict market direction — it provides visual structural levels only
