Eulers Exponential VolatilityRImplements an approximation to Patrik's Euler's Exponential for BTC
See X @GallantCryptoYT
Indicators and strategies

20% Rally - All Green CandlesThis indicator detects rallies where the price rises 20% or more using only consecutive green candles. It marks the rally's start with a green dashed line and "Entry" label, and the end with a red solid line and "Target" label. Ideal for identifying strong bullish momentum on daily charts.

RB3 DEMO – Rejection Blocks Visual ExampleThis is a simplified demo version of a custom Rejection Block (RB) visual indicator. It identifies potential bullish and bearish rejection zones based purely on candle structure, without using any time-based or algorithmic filters.
🧠 What it does:
• Detects Bullish and Bearish Rejection Blocks using clean price action logic
• Highlights those zones with boxes, optional lines, and labels
• Designed to help traders visually study price rejections and market structure
⚙️ How it works:
• Bullish RB = red candle with a lower low than the previous and next candle
• Bearish RB = green candle with a higher high than the previous and next candle
• No time filters or hidden logic are used — this tool is purely structural
🎯 Best used by:
• Traders who want to visualize potential rejection zones
• Beginners studying price action and structural reversals
• Visual learners who prefer clean chart-based confirmations
✅ This demo does **not** include institutional filters, time anchors (e.g., TRAL‑03), or sequence-based validation.
📌 A more advanced version with time-reactive filtering logic is available privately.
ℹ️ To use: enable "Boxes" and/or "Labels" to highlight rejection blocks clearly. Works on all timeframes.

Std.dev [AY¹]İşte TradingView için uygun açıklama metni:
Std.dev - Extended Range Deviation Indicator
This indicator calculates and displays standard deviation levels based on a custom session's high and low range, with lines extending until the next session start.
Key Features:
Custom Session Definition: Set your preferred session time (default: 09:00-11:30)
Extended Lines: Deviation lines extend from session end until next day's session start (09:00)
Flexible Deviation Types: Choose between full deviations (1.0, 2.0, 3.0...) or half deviations (0.5, 1.0, 1.5, 2.0...)
Visual Differentiation: Half deviation levels are displayed with dashed lines for easy identification
Anchor Point Options: Calculate deviations based on wicks or candle bodies
Session Visualization: Optional session range boxes and vertical start/end lines
Equilibrium Line: Optional mid-point line between session high and low
How it Works:
Identifies the specified session period each day
Captures the highest and lowest prices during that session
Calculates the range (high - low)
Draws multiple deviation levels above and below the range
Extends all levels until the next session begins
Use Cases:
Support and resistance level identification
Price target projections
Range-based trading strategies
Market structure analysis
Settings:
Session time configuration
Number of deviation levels (1-10)
Line styles and colors
Show/hide session boxes and labels
Customizable anchor points (wicks vs bodies)
The indicator preserves historical levels, allowing traders to analyze multiple sessions simultaneously for comprehensive market structure analysis.

NY HIGH LOW BREAKNY HIGH LOW BREAK: A New York Session Breakout Strategy
The "NY HIGH LOW BREAK" indicator is a powerful TradingView script designed to identify and capitalize on breakout opportunities during the New York trading session. This strategy focuses on the initial price action of the New York market open, looking for clear breaches of the high or low established within the first 30 minutes. It's particularly suited for intraday traders who seek to capture momentum-driven moves.
Strategy Logic
The core of the "NY HIGH LOW BREAK" strategy revolves around these key components:
New York Session Opening Range Identification:
The script first identifies the opening range of the New York session. This is defined by the high and low prices established during the first 30 minutes of the New York trading session (from 7:01 AM GMT-4 to 7:31 AM GMT-4).
These crucial levels are then extended forward on the chart as horizontal lines, serving as potential support and resistance zones.
Breakout Signal Generation:
Long Signal: A buy signal is generated when the price breaks above the high of the New York opening range. Specifically, it looks for a candle whose open and close are both above the highLinePrice, and importantly, the previous candle's open was below and close was above the highLinePrice. This indicates a strong upward momentum confirming the breakout.
Short Signal: Conversely, a sell signal is generated when the price breaks below the low of the New York opening range. It looks for a candle whose open and close are both below the lowLinePrice, and the previous candle's open was above and close was below the lowLinePrice. This suggests strong downward momentum confirming the breakdown.
Supertrend Filter (Implicit/Future Enhancement):
While the supertrend and direction variables are present in the code, they are not actively used in the current signal generation logic. This suggests a potential future enhancement where the Supertrend indicator could be incorporated as a trend filter to confirm breakout directions, adding an extra layer of confluence to the signals. For example, only taking long breakouts when Supertrend indicates an uptrend, and short breakouts when Supertrend indicates a downtrend.
Second Candle Confirmation (Possible Future Enhancement):
The close_sec_candle function and openSEC, closeSEC variables indicate an attempt to capture the open and close of a "second candle" (30 minutes after the initial New York open). Currently, closeSEC is used in a specific condition for signal_way but not directly in the primary longSignal or shortSignal logic. This also suggests a potential future refinement where the price action of this second candle could be used for further confirmation or specific entry criteria.
Time-Based Filtering:
Signals are only considered valid within a specific trading window from 8:00 AM GMT-4 to 8:00 AM GMT-4 + 16 * 30 minutes (which is 480 minutes, or 8 hours) on 1-minute and 5-minute timeframes. This ensures that trades are taken during the most active and volatile periods of the New York session, avoiding late-session chop.
The script also highlights the New York session and lunch hours using background colors, providing visual context to the trading day.
Key Features
Automated New York Open Range Detection: The script automatically identifies and plots the high and low of the first 30 minutes of the New York trading session.
Clear Breakout Signals: Visually distinct "BUY" and "SELL" labels appear on the chart when a breakout occurs, making it easy to spot trading opportunities.
Timeframe Adaptability: While optimized for 1-minute and 5-minute timeframes for signal generation, the opening range lines can be displayed on various timeframes.
Customizable Risk-to-Reward (RR): The rr input allows users to define their preferred risk-to-reward ratio for potential trades, although it's not directly implemented in the current signal or trade management logic. This could be used by traders for manual trade management.
Visual Session and Lunch Highlights: The script colors the background to clearly delineate the New York trading session and the lunch break, helping traders understand the market context.
How to Use
Apply the Indicator: Add the "NY HIGH LOW BREAK" indicator to your chart on TradingView.
Select a Relevant Timeframe: For optimal signal generation, use 1-minute or 5-minute timeframes.
Observe the Opening Range: The green and red lines represent the high and low of the first 30 minutes of the New York session.
Look for Breakouts: Wait for price to decisively break above the green line (for a buy) or below the red line (for a sell).
Confirm Signals: The "BUY" or "SELL" labels will appear on the chart when the breakout conditions are met within the active trading window.
Implement Your Risk Management: Use your preferred risk management techniques, including stop-loss and take-profit levels, in conjunction with the signals generated. The rr input can guide your manual risk-to-reward calculations.
Potential Enhancements & Considerations
Supertrend Confirmation: Integrating the supertrend variable to filter signals would significantly enhance the strategy's robustness by aligning trades with the prevailing trend.
Stop-Loss and Take-Profit Automation: The rr input currently serves as a manual guide. Future versions could integrate automated stop-loss and take-profit placement based on this ratio, potentially using ATR for dynamic sizing.
Volume Confirmation: Adding a volume filter to confirm breakouts would ensure that only high-conviction moves are traded.
Backtesting and Optimization: Thorough backtesting across various assets and market conditions is crucial to determine the optimal settings and profitability of this strategy.
Session Times: The current session times are hardcoded. Making these user-definable inputs would allow for greater flexibility across different time zones and trading preferences.
The "NY HIGH LOW BREAK" is a straightforward yet effective strategy for capturing initial New York session momentum. By focusing on clear breakout levels, it aims to provide timely and actionable trading signals for intraday traders.

NY Open ATR System - Tick Range Filter### **New York Open ATR System - Brief Overview**
#### **🎯 Core Purpose**
Identifies **high-potential breakout setups** at the New York open (13:30 UTC) by combining:
1. **Volatility filters** (dual ATR periods)
2. **Tick-based range analysis**
3. **Time-specific triggers**
---
### **⚙️ Key Components**
| **Feature** | **Function** |
|---------------------------|-----------------------------------------------------------------------------|
| **ATR Filters** | Dual volatility checks (short + long periods) at 13:25 UTC |
| **Tick Range Limit** | Highlights candles with range < user-defined ticks (default: 150) |
| **Time Precision** | Focuses exclusively on 13:30 UTC weekday candles |
| **Visual Markers** | Yellow highlight + tick count label (e.g., "147/150 ticks") |
| **Info Panel** | Real-time display of settings and current tick count |
---
### **📊 How It Works**
1. **Pre-Open Check (13:25 UTC)**
- Verifies market volatility using 2 ATR values
- Requires both to exceed user-defined thresholds
2. **Open Analysis (13:30 UTC)**
- Measures exact tick count: `(high - low) / instrument_mintick`
- Compares against your max tick limit (adjustable 1-5000)
3. **Visual Trigger**
- Highlights candle yellow if:
```tick_count < your_set_limit```
- Labels show exact performance vs limit (e.g., "142/150 ticks")
---
### **⚡ Trading Signals**
| **Condition** | **Visual Feedback** |
|----------------------------|---------------------------------------------|
| High volatility + tight range | Yellow candle + tick count label |
| All other scenarios | No marking |
---
### **🛠️ Customization**
```pine
// Key Adjustable Parameters:
maxTicks = input.int(150) // Set 1-5000 ticks
atrPeriod1 = input.int(14) // Short ATR (2-5000)
atrPeriod2 = input.int(161) // Long ATR (2-5000)
candleColor = input.color(color.yellow) // Highlight color
```
---
### **💡 Practical Use Cases**
1. **Breakout Anticipation**
- Tight ranges after volatility spikes often precede strong moves
2. **Session Scalping**
- Identify low-range opens for mean-reversion plays
3. **Volatility Filtering**
- Avoid trading when ATR thresholds aren't met
---
### **📈 Suggested Settings**
| **Market** | **Max Ticks** | **ATR Periods** |
|------------------|--------------|----------------|
| Forex (EUR/USD) | 100-200 | 14/161 |
| Stocks (SPY) | 50-120 | 10/200 |
| Crypto (BTC) | 300-500 | 20/100 |
---
### **✅ Benefits**
- **Precision Timing**: Focused on NY open liquidity surge
- **Quantitative Filtering**: Exact tick measurement + volatility thresholds
- **Clean Visuals**: No chart clutter - only marks qualifying candles
- **Adaptable**: Works across all markets and timeframes
This system helps traders spot high-probability breakout setups by combining volatility anticipation with precise range measurement at the market's most liquid opening window.

Initial Balance Wave MapThis indicator visualizes the Initial Balance (IB) range for any session, marking the first hour's high and low. It includes optional midpoints, extensions (e.g. 1.5x IB, 2x IB), and customizable time windows. Additional features allow users to display session open, high, low, close, and VWAP reference points. Designed to support price action and session structure analysis, it adapts to various global futures and FX market opens. All display elements are optional and fully configurable.
This updated indicator builds upon the open-source foundation by @noop-noop with enhancements and user-facing labels tailored for Auction Market Theory, scalping, and structure-based trade setups.
Key updated Featured: Multiple previous day's IB levels carry forward into the current day's chart, as opposed to just the previous day's levels carrying forward to the new IB time.
🙌 Credits:
This script builds upon the excellent open-source work by @noop-noop. Original script available here .

Dominance Candle Raja Saien (Detector with Alerts)Dominance Candle Finder with Alerts by Raja Saien
This powerful indicator is designed to detect dominance candles—those strong-bodied candles that often signify momentum and trend strength. Whether you're trading breakouts, trend continuations, or reversals, this tool helps you identify key market moves in real time with optional alerts.
🔍 Features:
Automatic Detection of Dominance Candles: Highlights candles with strong body size, showing decisive market movement.
Customizable Thresholds: Adjust sensitivity according to your strategy or asset volatility.
Built-in Alerts: Get notified the moment a dominance candle forms—no need to stare at charts all day!
Multi-Timeframe Compatibility: Works on any timeframe from 1-minute to daily or higher.
📊 Use Cases:
Entry confirmation on breakouts
Trend strength analysis
Volatility surge detection
Combine with support/resistance or order block zones for powerful setups
Tip: Best used with strong support/resistance levels or price action strategies for confluence

RSI Multi-Frame Multi-Asset
✅ Key Features:
Multi-Asset: Simultaneously analyze Bitcoin, SP500, Nasdaq, DXY, Gold, Oil, VIX and more
Multi-Timeframe: Configure any timeframe for all RSI calculations
Smart Average RSI: Automatically calculates the mean of all active RSI values
Special Data: Includes Bitcoin Hashrate, 10Y-2Y Spread, and US Interest Rates
Built-in Alerts: Automatic notifications on overbought/oversold crossovers
🎯 Why is it Unique?
Instead of looking at 10 different charts, you get an instant macro view of the market. The average RSI shows you the overall strength/weakness of global markets, while individual RSI values let you identify divergences and specific opportunities.
🚀 Perfect For:
Traders seeking correlations between assets
Global markets macro analysis
Identifying divergences between Bitcoin and traditional markets
Multi-timeframe breakout trading

VMA (Variable Moving Average)AI-generated Native NinjaTrader 8 VMA (Variable Moving Average) Indicator for TradingView's PINE language.

K_RSI_ATR_ATR%_CMO_MACD_ADXThis indicator is combination of below indicators:
RSI
ATR
ATR%
CMO
MACD
ADX

📡 ETF RADAR HUD (SPY · QQQ · SPX) + Real-Time MomentumOverview
The ETF RADAR HUD is a powerful, all-in-one technical analysis tool designed to provide traders with real-time insights into market trends, momentum, and key indicators for major ETFs and indices, including SPY , QQQ , and SPX . This Pine Script® indicator delivers a visually intuitive heads-up display (HUD) that consolidates critical market data, enabling traders to make informed decisions with confidence.
Important: This indicator is optimized to work in conjunction with Stan's Magic Potion , a complementary tool that enhances its precision and effectiveness. Together, they form a robust system for identifying high-probability trading opportunities in volatile markets.
Key Features
Multi-Asset Compatibility: Automatically detects and adapts to SPY , QQQ , SPX , or other instruments, with tailored visual cues for each.
Real-Time Momentum Detection : Identifies breakout and breakdown signals using a combination of price action, EMA crossovers, and RSI thresholds.
Comprehensive HUD : Displays key metrics including:
*Trend direction (Uptrend, Downtrend, Sideways)
*RSI status (Overbought, Oversold, Neutral)
*Volatility (High, Low)
*Volume spikes
*EMA crossovers (1 vs. 16)
*VWAP and EMA 200 positioning
*Momentum signals (Breakout, Breakdown, Waiting)
Alert System: Configurable alerts for CALL (bullish) and PUT (bearish) momentum signals, ensuring timely notifications for trading opportunities.
Visual Clarity: Color-coded bar highlights and an organized table for at-a-glance analysis.
Why Use ETF RADAR HUD with Stan's Magic Potion?
The ETF RADAR HUD is designed to complement Stan's Magic Potion , creating a synergistic trading system that maximizes signal accuracy and market context. While the HUD provides a real-time snapshot of market conditions, Stan's Magic Potion enhances its signals with proprietary filters and confirmation logic, reducing noise and improving trade reliability. Using these tools together allows traders to:
*Confirm momentum signals with greater confidence.
*Filter out false breakouts or breakdowns.
*Align trades with broader market dynamics.
For optimal results, we strongly recommend integrating this indicator with Stan's Magic Potion to unlock its full potential.
How It Works
The indicator calculates and displays:
Trend Analysis: Compares fast (default: 8) and slow (default: 21) EMAs to determine market direction.
Momentum Signals: Detects breakouts (price above recent highs with buffer) and breakdowns (price below recent lows with buffer), validated by EMA and RSI conditions.
Volatility and Volume: Monitors ATR-based volatility and volume spikes relative to a 20-period SMA.
Key Levels: Tracks price relative to VWAP and the 200-period EMA for long-term trend context.
RSI Mood: Highlights overbought (>70) or oversold (<30) conditions.
HUD Display: Presents all metrics in a clean, top-right table with color-coded statuses for quick interpretation.
Settings
* Fast EMA Period (default: 8): Adjusts the sensitivity of the short-term EMA.
* Slow EMA Period (default: 21): Sets the longer-term EMA for trend analysis.
* RSI Length (default: 14): Defines the RSI calculation period.
* ATR Length (default: 14): Sets the ATR period for volatility assessment.
* Volume Spike Multiplier (default: 1.8): Determines the threshold for volume spike detection.
* Momentum Lookback Bars (default: 5): Sets the lookback period for breakout/breakdown detection.
* Breakout Buffer % (default: 0.05): Adds a buffer to price breakouts for confirmation.
How to Use
* Add the ETF RADAR HUD to your TradingView chart for SPY , QQQ , or SPX .
* Pair it with Stan's Magic Potion for enhanced signal confirmation (highly recommended).
* Monitor the HUD table for real-time insights into trend, momentum, volatility, and volume.
* Set up alerts for CALL (bullish) or PUT (bearish) momentum signals to stay ahead of market moves.
* Adjust input parameters to suit your trading style or timeframe.
Notes
* This indicator is most effective on daily or intraday charts for ETFs and indices.
* Ensure you have access to Stan's Magic Potion for optimal performance, as the two tools are designed to work hand-in-hand.
* Use the alert system to automate notifications for high-probability setups.
Disclaimer
Trading involves risk, and past performance is not indicative of future results. Always conduct your own analysis and risk management before entering trades. This indicator is provided under the Mozilla Public License 2.0.

Customizable ORB BoxCustomizable ORB Box
📘 Description
A powerful and flexible Opening Range Breakout (ORB) visualization tool designed for intraday traders. This indicator plots the opening range using either the first candle or a user-defined custom timeframe, and updates in real time.
🔧 Key Features
First Candle Mode – Plots the high/low range of the first candle of each new trading day.
Custom Timeframe Mode – Builds the ORB box live over a chosen duration (e.g., 5, 15, 30 minutes) and finalizes it after the timeframe completes.
Dynamic Box Colors – Bullish and bearish color themes based on range closure direction.
Multi-Day Plotting – Displays ORB boxes across all days, not just today.
Alerts Included – Triggers when price breaks above or below the ORB range.
No repainting – Stable and historical-friendly behavior.
🕒 ETH Compatibility
This indicator respects your TradingView chart settings:
✅ If ETH is enabled, ORB begins with the first ETH candle.
✅ If ETH is disabled, ORB begins with Regular Trading Hours (RTH).
Tip: Control this via the chart’s ⚙️ “Session” settings for your instrument.
💡 How to Use
Use First Candle Mode for classic ORB strategy setups (quick early structure).
Use Custom Timeframe Mode on smaller timeframes (e.g., 3min) for dynamic range-building.
Combine with volume, VWAP, trendlines, or price action for breakout confirmation.

Stop or Go?-Displaying RVOL as ratio now instead of percentage.
-Default startup location moved to bottom right with large size

Heikin Ashi Color Change Alert📈 Heikin Ashi Color Change Alert
This indicator detects color changes in Heikin Ashi candles and issues visual signals and alerts when a change is confirmed at bar close.
🔍 What it does:
Reconstructs Heikin Ashi candles directly from chart prices.
Detects when the color changes from bearish to bullish (or vice versa).
Prints a triangle symbol on the chart when the change occurs.
Allows you to set alerts so you never miss a potential reversal.
✅ How it works:
A bullish signal occurs when a red (bearish) Heikin Ashi candle is followed by a green (bullish) one.
A bearish signal occurs when a green (bullish) candle is followed by a red (bearish) one.
The detection is done only after the current candle is fully closed, ensuring cleaner signals.
🔔 Example Alerts:
"Heikin Ashi candle changed to bullish"
"Heikin Ashi candle changed to bearish"
This indicator is ideal for:
Traders who follow price action
Those who want to filter trends
Anyone who uses Heikin Ashi to smooth market noise and detect reversals

I Want My ScalpsTops/bottoms.
Bull/bear traps.
Designed for NQ / MNQ on 1 min during cash hours.
Time filter update coming soon.

Inflection PointInflection Point - The Adaptive Confluence Reversal Engine
This is not just another peak and valley indicator; it is a complete and total reimagining of how market turning points are detected, qualified, and acted upon. Born from the foundational concepts explored in systems like my earlier creation, DAFE - Turning Point, Inflection Point is a ground-up engineering feat designed for the modern trader. It moves beyond static rules and simple pattern recognition into the realm of dynamic, multi-factor confluence analysis and adaptive machine learning.
Where other indicators provide a guess, Inflection Point provides a probability. It meticulously analyzes the market's deepest currents—momentum, exhaustion, and reversal velocity—and fuses them into a single, unified "Confluence Score." This is not a simple combination of indicators; it is an intelligent, weighted system where each component works in concert, creating an analytical engine that is orders of magnitude more sophisticated and reliable than any standard reversal tool.
Furthermore, Inflection Point learns. Through its advanced Adaptive Learning Engine, it constantly monitors its own performance, adjusting its confidence and selectivity in real-time based on its recent success rate. This allows it to adapt its behavior to any security, on any timeframe, with remarkable success.
Theoretical Foundation - Confluence Core
Inflection Point's predictive power does not come from a single, magical formula. It comes from the intelligent synthesis of three critical market phenomena, weighted and scored in real-time to generate a single, high-conviction probability rating.
1. Factor One: Pre-Reversal Momentum State (RSI Analysis)
Instead of reacting to a simple RSI cross, Inflection Point proactively scans for the build-up of momentum that precedes a reversal.
• Formulaic Concept: It measures the highest RSI value over a lookback period for peaks and the lowest RSI for valleys. A signal is only considered valid if significant momentum has been established before the turn, indicating a stretched market condition ripe for reversal.
• Asymmetric Sophistication: The engine uses different, optimized thresholds for bull and bear momentum, recognizing that markets often fall faster than they rise.
2. Factor Two: Volatility Exhaustion (Bollinger Band Analysis)
A true reversal often occurs when price makes a final, exhaustive push into unsustainable territory.
• Formulaic Concept: The engine detects when price has significantly pierced the outer Bollinger Bands. This is not just a touch, but a statistical deviation from the mean that signals volatility exhaustion, where the energy for the current move is likely depleted.
3. Factor Three: Reversal Strength (Rate of Change Analysis)
The character of a reversal matters. A sharp, decisive turn is more significant than a slow, meandering one.
• Formulaic Concept: Using a short-term Rate of Change (ROC), the engine measures the velocity of the reversal itself. A higher ROC score adds significant weight to the final probability, confirming that the new direction has conviction.
4. The Final Calculation: The Adaptive Learning Engine
This is the system's "brain." It maintains a history of its past signals and calculates its real-time win rate. This hitRate is then used to generate an adaptiveMultiplier.
• Self-Correction: In "Quality Control" mode, a high win rate makes the indicator more selective, demanding a higher probability score to issue a signal, thereby protecting streaks. A lower win rate makes it slightly less selective to ensure it continues learning from new market conditions.
• The result is a system that is not static, but a living, breathing tool that adapts its personality to the unique rhythm of any chart.
Why Inflection Point is a Paradigm Shift
Inflection Point is fundamentally different from other reversal indicators for three key reasons:
Confluence Over Isolation: Standard indicators look at one thing (e.g., RSI > 70). Inflection Point simultaneously analyzes momentum, volatility, and velocity, understanding that true reversals are a product of multiple converging factors. It answers not just "if," but "why" a reversal is likely.
Probabilistic Over Binary: Other tools give you a simple "yes" or "no." Inflection Point provides a probability score from 0-100, allowing you to gauge the conviction of every potential signal. This empowers you to differentiate between a weak setup and an A+ opportunity.
Adaptive Over Static: Every other indicator uses the same rules forever. Inflection Point's Adaptive Engine means it is constantly refining its own logic based on what is actually working in the current market, on the specific asset you are trading. It is tailored to the now.
The Inputs Menu - Your Command Center
Every setting is a lever of control, allowing you to tune the engine to your precise trading style and market focus.
🧠 Neural Core Engine
Analysis Depth: This is the primary lookback for the Bollinger Band and other core calculations. A shorter depth makes the indicator faster and more sensitive, ideal for scalping. A longer depth makes it slower and more stable, ideal for swing trading.
Minimum Probability %: This is your master signal filter. It sets the minimum Confluence Score required to plot a signal. Higher values (85-95) will give you only the highest-conviction A+ setups. Lower values (70-80) will show more potential opportunities.
🤖 Adaptive Neural Learning
Enable Adaptive Learning Engine: Toggles the entire learning system. Disabling it will make the indicator's logic static.
Peak/Valley Success Threshold (ATR): This defines what constitutes a "successful" trade for the learning engine. A value of 1.5 means price must move 1.5x the ATR in your favor for the signal to be marked as a win. Adjust this to match your personal take-profit strategy.
Adaptive Mode: This dictates how the engine uses its hitRate. "Quality Control" is recommended for its intelligent filtering. "Aggressive" will always boost signal scores, useful for finding more setups in a known, trending environment.
Asymmetric Balance: Allows you to apply a "boost" to either peak (short) or valley (long) signals. If you find the market you're trading has stronger long reversals, you can increase the "Valley Signal Boost" to catch them more effectively.
🛡️ Elite Filters
Market Noise Filter: An exceptional tool for avoiding choppy markets. It counts the number of directional changes in the last 5 bars. If the market is whipping back and forth too much, it will block the signal. Lower the "Max Direction Changes" to be extremely selective.
Volume Filter: Requires signal confirmation from a significant volume spike. The "Volume Multiplier" dictates how large this spike must be (e.g., 1.2 = 20% above average volume). This is invaluable for filtering out low-conviction moves in stocks and crypto.
The Dashboard - Your Analytical Co-Pilot
The dashboard is not just a set of numbers; it is a holistic overview of the market's health and the engine's current state.
Unified AI Score: This section provides the most critical, at-a-glance information. "Total Score" is the current probability reading, while "Quality" gives you a human-readable interpretation. "Win Rate" shows the real-time performance of the Adaptive Engine.
Order Flow (OFPI): This measures the "weight" of money behind recent price moves by analyzing price change relative to volume. A high positive OFPI suggests strong buying pressure, while a high negative value suggests strong selling pressure. It gives you a peek into the market's underlying flow.
Component Analysis: This allows you to see the individual "Peak" and "Valley" confidence scores before they are filtered, giving you insight into building momentum before a signal forms.
Market Structure: This panel assesses the broader environment. "HTF Trend" tells you the direction of the larger trend (based on EMAs), while "Vol Regime" tells you if the market is in a high, medium, or low volatility state. Use this to align your signals with the broader market context.
Filter & Engine Statistics: Available on the "Large" dashboard, this provides deep insight into how many signals are being blocked by your filters and the current status of the Adaptive Engine's multiplier.
The Visual Interface - A Symphony of Data
Every visual element on the chart is designed for instant interpretation and insight.
Signal Markers: Simple, clean triangles mark the exact bar of a valid signal. A box is drawn around the high/low of the signal bar to highlight the precise point of inflection.
Dynamic Support/Resistance Zones: These are the glowing lines on your chart. They are not static lines; they are dynamic levels that represent the current battlefield between buyers and sellers.
Cyber Cyan (Valley Blue): This is the current Support Zone. This is the price level the market is currently trying to defend.
Neural Pink (Peak Red): This is the current Resistance Zone. This is the price level the market is currently trying to break through.
Grey (Next Level): This line is a projection, based on the current momentum and the size of the S/R range, of where the next major level of conflict will likely be. It acts as a potential price target.
Development & Philosophy
Inflection Point was not assembled; it was engineered. It represents hundreds of hours of research into market dynamics, statistical analysis, and machine learning principles. The goal was to create a tool that moves beyond the limitations of traditional technical analysis, which often fails in modern, algorithm-driven markets. By building a system based on multi-factor confluence and self-adaptive logic, Inflection Point provides a quantifiable, statistical edge that is simply unattainable with simpler tools. This is the result of a relentless pursuit of a better, more intelligent way to trade.
Universal Applicability
The principles of momentum, exhaustion, and velocity are universal to all freely traded markets. Because of its adaptive core and robust filtering options, Inflection Point has proven to be exceptionally effective on any security (stocks, crypto, forex, indices, futures) and on any timeframe (from 1-minute scalping charts to daily swing trading charts).
" Markets are constantly in a state of uncertainty and flux and money is made by discounting the obvious and betting on the unexpected. "
— George Soros
Trade with insight. Trade with anticipation.
— Dskyz, for DAFE Trading Systems

HTF Trend Table + 15M Wick SD Marker [No Error Edition]Criteria Used in the Indicator:
TRENDING (Bullish or Bearish):
Bullish:
The 4H close is above the most recent 4H swing high (pivot high)
The 1H close is above the most recent 1H swing high (pivot high)
→ Both conditions must be true at the same time
Bearish:
The 4H close is below the most recent 4H swing low (pivot low)
The 1H close is below the most recent 1H swing low (pivot low)
→ Both conditions must be true at the same time
CHOPPY (Ranging):
Any other case!
If the close is not above both the last swing highs (not trending up)
AND not below both the last swing lows (not trending down)
Example:
4H is above its last swing high but 1H is not
1H is below its last swing low but 4H is not
Both are in between their swings
→ In these scenarios, the code sets the trend as "CHOPPY" (ranging/sideways).

Liquidity Spectrum Visualizer [BigBeluga]🔵 OVERVIEW
The Liquidity Spectrum Visualizer is a smart tool for exposing hidden liquidity zones by combining a dynamic volume profile, clear liquidity levels, and intuitive volume bubbles directly on your price chart. It shows you exactly where significant volume is clustering inside your chosen lookback period — highlighting where big market participants may be defending price or planning breakouts.
🔵 CONCEPTS
Volume Profile Bins: Breaks your custom lookback range into 100 fine price bins, calculating total volume per bin to create a precise vertical liquidity histogram.
Liquidity Levels: Bins with high relative volume automatically plot as horizontal lines — thicker and brighter lines signal stronger liquidity concentrations.
Dynamic Coloring: Profile bins and liquidity levels adjust their colors live based on whether current price is trading above (support) or below (resistance).
Volume Bubbles: Each candle displays a bubble at its HLC3 price —
- The bubble’s size shows relative candle volume.
- Its color gradient indicates bullish or bearish volume: greenish for bullish candles, orange for bearish.
Bubble Labels: The largest bubbles automatically label the actual volume amount, revealing big hidden flows.
Range Box High/Low: Marks the absolute swing high and low inside the lookback window, clearly framing the active liquidity zone.
🔵 FEATURES
Smart, auto-scaled volume profile up to 200 candles (or custom).
Liquidity levels with dynamic thickness and color based on real-time volume.
Bubbles sized and colored to show both volume magnitude and bullish/bearish bias.
Largest bubbles labeled for fast detection of high-impact bars.
High and low price labels clearly show the analyzed range.
Toggle Volume Profile, Liquidity Levels, and Bubbles independently.
🔵 HOW TO USE
Watch for thick, bright liquidity levels — these zones mark where large orders or stop clusters are likely hidden.
Use dynamic coloring: if price is above a level, it’s support; if below, it’s resistance.
Pay special attention to big bubbles: these mark sudden spikes in traded volume and can signal absorption, traps, breakouts or significant price levels.
Combine with your existing confluence tools to confirm breakouts or fakeouts around visible liquidity clusters.
🔵 CONCLUSION
The Liquidity Spectrum Visualizer transforms hidden order flow into an intuitive, color-coded map. You see at a glance where price is absorbing, consolidating, or ready to break — all powered by real-time volume behavior and smart visuals. It’s a must-have tool for traders who want to read liquidity and react ahead of the crowd.

EMA 21/50/150/200This indicator plots four Exponential Moving Averages (EMAs) on the chart to help identify trends, momentum, and potential support or resistance levels. The EMAs used are:
EMA 21 (Red): Captures short-term price momentum.
EMA 50 (Orange): Represents medium-term trend direction.
EMA 150 (Aqua): Shows the broader trend over a longer timeframe.
EMA 200 (Blue): Commonly used to identify major long-term trend direction and key support/resistance zones.
These EMAs are commonly used by swing traders and trend-following strategies to determine trend strength, pullback opportunities, or cross-based trade entries

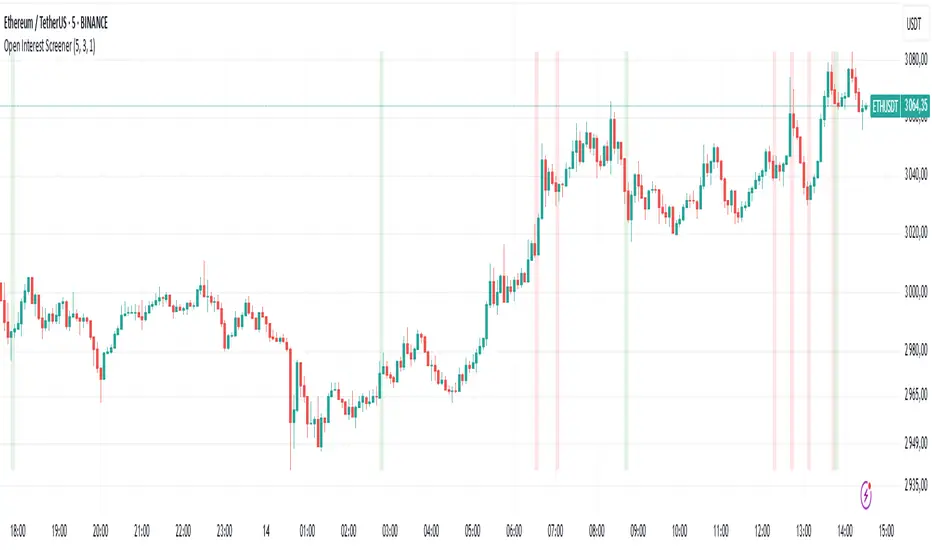
Open Interest Screener
Open Interest Screener
Traders often wonder: how do you enter a trend before it takes off — not at the very peak? Most classic technical indicators lag behind price. So what could you add to your system to catch a move earlier?
🔍 Enter the Open Interest Screener!
I've personally relied on this metric for years while trading crypto. It helps detect abnormal spikes in open interest — sudden increases in the number of outstanding derivative contracts — which often signal that something big is about to happen. These moments can mark the very start of a major trend.
🧠 How to use it:
Go long if price is rising and there's a spike in open interest on the way up.
Go short if price is falling and open interest rises during the decline.
Exit positions when open interest sharply drops — this may indicate the move is losing momentum.
⚙️ Settings & Customization:
Bars to look back — defines how far back the script looks to detect % changes in open interest.
OI % Change Threshold — adjust this to control sensitivity; higher = fewer, stronger signals.
Exchange source toggles — choose between BitMEX (USD/USDT) and Kraken data feeds.
Show Spike Zones — enable or disable visual highlights for detected spikes.
📌 Tips:
Configure the indicator for your preferred cryptocurrency pair and timeframe.
Visually validate that the OI spikes look meaningful and are not cluttering the chart.
Optimal settings vary by asset — take time to test and tune them for each coin.
With this tool, you're no longer guessing where the trend might begin — you're tracking the intent of market participants as it unfolds. Use it as part of a broader system and stay ahead of the herd.

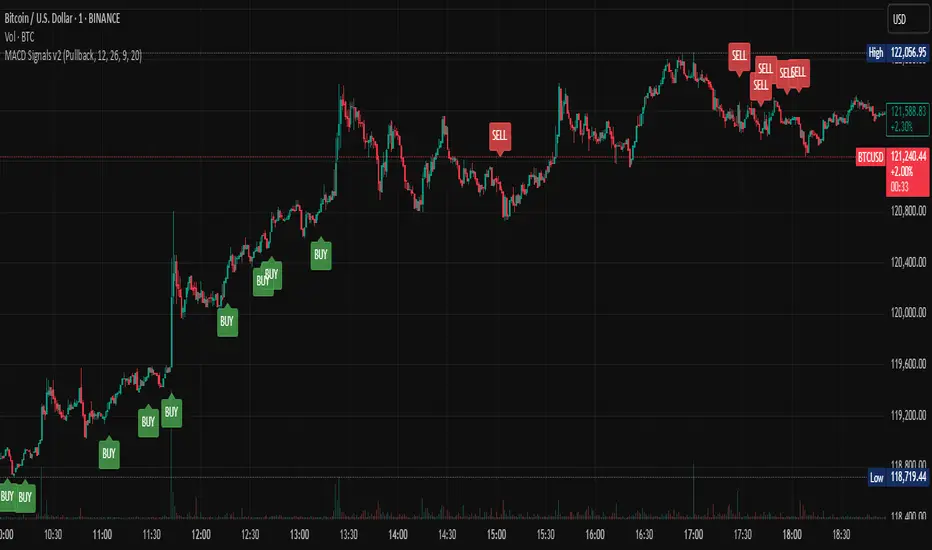
Multi-Mode MACD Signals v2Multi-Mode MACD Signals v2
Signal Types Explained ⚙️
You can now choose your preferred signal from a dropdown menu in the indicator's settings:
Pullback (Default): The original, high-probability strategy. It identifies "buy the dip" and "sell the rally" opportunities within an established trend.
Buy: Triggers on a bullish MACD/Signal line cross above the zero line.
Sell: Triggers on a bearish MACD/Signal line cross below the zero line.
Standard Crossover: The most common MACD signal. It's a pure momentum signal that triggers whenever the MACD line crosses the signal line, regardless of the trend.
Buy: MACD line crosses above the Signal line.
Sell: MACD line crosses below the Signal line.
Zero Line Cross: A trend-change signal. It identifies when the overall momentum shifts from bullish to bearish or vice-versa.
Buy: MACD line crosses above the Zero line.
Sell: MACD line crosses below the Zero line.
How Signals Are Displayed (Real-time vs. Confirmed)
This indicator addresses your request to have signals "display as it occurs" automatically. Here is how it works:
Real-time Alert (As it Occurs): On a live, developing candle, a "BUY" or "SELL" label may appear the instant the MACD conditions are met. This gives you the earliest possible warning.
Signal Repainting: Because the price is still moving within the live candle, the signal may appear and later disappear if the conditions are no longer met by the time the candle closes. This is known as "repainting".
Confirmed Signal: Once the candle closes, the signal is locked in and will never change. This is the confirmed, non-repainting signal.
To create alerts based on these signals, right-click a label on the chart, select "Add alert on Multi-Mode MACD Signals," and choose "Once Per Bar Close" for a confirmed signal or "Once Per Bar" for an earlier, real-time alert.