High Volume Buyers/SellersThis indicator will help you indicate wether breakout happened with high volume or not
Indicators and strategies

Daily High-Low RangeThis Pine Script calculates the daily range (High - Low) for each trading day to measure intraday volatility.
The orange line shows the actual daily high-low range.
The purple line represents the 10-day simple moving average of the daily range, smoothing out fluctuations for trend observation.
This indicator helps identify whether intraday volatility is increasing or decreasing over time and can be used to assess market momentum or risk.
이 Pine Script는 각 거래일의 고가와 저가의 차이 (일중 변동폭)을 계산하여 일중 변동성을 시각화합니다.
주황색 선은 매일의 고가-저가 범위를 나타냅니다.
보라색 선은 일중 변동폭의 10일 단순 이동평균(SMA)으로, 변동성의 추세를 부드럽게 보여줍니다.
이 지표를 통해 최근 시장의 변동성이 커지고 있는지 줄어들고 있는지를 파악할 수 있으며, 시장 리스크 또는 모멘텀 판단에 활용될 수 있습니다.

Price Deviation from MA5 (%)This Pine Script calculates and visualizes the percentage deviation of the current price from the 5-day simple moving average (SMA5).
The blue line represents the daily deviation (%) from the 5-day moving average.
The orange line shows the 10-day average of the deviation, providing a smoother trendline for volatility analysis.
A gray baseline at 0% helps identify whether the price is trading above or below the SMA5.
This indicator is helpful for identifying short-term overbought or oversold conditions and tracking intraday volatility behavior.
이 Pine Script는 현재 종가가 5일 이동평균선(MA5)으로부터 얼마나 떨어져 있는지(이격률, %)를 계산하고 시각화합니다.
파란색 선은 매일의 이격률(%)을 나타냅니다.
주황색 선은 이격률의 10일 평균값으로, 보다 부드러운 추세선을 제공합니다.
**0% 기준선(회색)**을 통해 현재 가격이 MA5 위에 있는지 아래에 있는지를 한눈에 파악할 수 있습니다.
이 지표는 단기 과열/과매도 구간을 파악하거나, 일중 변동성의 흐름을 분석할 때 유용합니다.

Custom Median MAThe 50-day moving average (50-DMA) is a popular technical analysis indicator used to identify the intermediate-term trend of a financial asset. It is calculated by averaging the closing prices of the asset over the past 50 trading days. As a lagging indicator, it smooths out price fluctuations and helps traders and investors identify potential support and resistance levels.
When the price is consistently above the 50-DMA, it often signals an uptrend or bullish market sentiment. Conversely, if the price remains below the 50-DMA, it may indicate a downtrend or bearish sentiment. Crossovers involving the 50-DMA are also closely watched. For instance, a "golden cross" occurs when a shorter-term moving average (e.g., 20-day) crosses above the 50-DMA, suggesting potential upward momentum. A "death cross" is the opposite and can signal a downward trend.
The 50-DMA is widely used because it strikes a balance between short-term sensitivity and long-term stability. It is applicable across various markets and timeframes, including stocks, indices, and cryptocurrencies.

SKVolBal Pro v1.0SKVolBal Pro v1.0
Volume-RSI Fusion with Advanced Pattern Detection
This space-efficient indicator combines volume analysis, RSI, and candlestick pattern recognition in a single pane. Key features:
Volume-RSI Integration
Dual view modes: Stacked volume (Type 1) or separated buy/sell columns (Type 2)
RSI overlay with configurable levels (default 30/70)
Color-coded volume: Green = Buying pressure, Red = Selling pressure
Pattern Detection & Labels
Text labels indicate detected patterns with priority weighting:
C: Volume Climax
E: Engulfing Pattern
D: Divergence
H: Hammer
I: Inverted Hammer
S: Shooting Star
M: Hanging Man
B: Bearish Marubozu
G: Gravestone Doji
Label color indicates direction: Green = Bullish, Red = Bearish
Smart Signal Validation
Adaptive thresholds adjust to market volatility
Volume filters (vs SMA20) minimize false signals
Pattern weighting system prioritizes significant signals
Hover labels show all detected patterns with weights
Customization & Alerts
Adjust 15+ parameters including pattern sensitivity and volume allocation
Toggle individual patterns on/off with priority weighting
Built-in alerts for all 12 pattern types
Interpretation Guidance:
Strong signals: Labels appearing at RSI extremes (near 30/70) with high volume
Confirmation: Multiple patterns detected simultaneously (view via tooltip)
Caution: Isolated signals without volume/RSI confluence
Priority: Higher-weighted patterns override label display (weights 70-100)
*Optimized for efficiency with 500-label limit and 200-bar lookback. Color intensity reflects signal strength.*

Active PMI Support/Resistance Levels [EdgeTerminal]The PMI Support & Resistance indicator revolutionizes traditional technical analysis by using Pointwise Mutual Information (PMI) - a statistical measure from information theory - to objectively identify support and resistance levels. Unlike conventional methods that rely on visual pattern recognition, this indicator provides mathematically rigorous, quantifiable evidence of price levels where significant market activity occurs.
- The Mathematical Foundation: Pointwise Mutual Information
Pointwise Mutual Information measures how much more likely two events are to occur together compared to if they were statistically independent. In our context:
Event A: Volume spikes occurring (high trading activity)
Event B: Price being at specific levels
The PMI formula calculates: PMI = log(P(A,B) / (P(A) × P(B)))
Where:
P(A,B) = Probability of volume spikes occurring at specific price levels
P(A) = Probability of volume spikes occurring anywhere
P(B) = Probability of price being at specific levels
High PMI scores indicate that volume spikes and certain price levels co-occur much more frequently than random chance would predict, revealing genuine support and resistance zones.
- Why PMI Outperforms Traditional Methods
Subjective interpretation: What one trader sees as significant, another might ignore
Confirmation bias: Tendency to see patterns that confirm existing beliefs
Inconsistent criteria: No standardized definition of "significant" volume or price action
Static analysis: Doesn't adapt to changing market conditions
No strength measurement: Can't quantify how "strong" a level truly is
PMI Advantages:
✅ Objective & Quantifiable: Mathematical proof of significance, not visual guesswork
✅ Statistical Rigor: Levels backed by information theory and probability
✅ Strength Scoring: PMI scores rank levels by statistical significance
✅ Adaptive: Automatically adjusts to different market volatility regimes
✅ Eliminates Bias: Computer-calculated, removing human interpretation errors
✅ Market Structure Aware: Reveals the underlying order flow concentrations
- How It Works
Data Processing Pipeline:
Volume Analysis: Identifies volume spikes using configurable thresholds
Price Binning: Divides price range into discrete levels for analysis
Co-occurrence Calculation: Measures how often volume spikes happen at each price level
PMI Computation: Calculates statistical significance for each price level
Level Filtering: Shows only levels exceeding minimum PMI thresholds
Dynamic Updates: Refreshes levels periodically while maintaining historical traces
Visual System:
Current Levels: Bright, thick lines with PMI scores - your actionable levels
Historical Traces: Faded previous levels showing market structure evolution
Strength Tiers: Line styles indicate PMI strength (solid/dashed/dotted)
Color Coding: Green for support, red for resistance
Info Table: Real-time display of strongest levels with scores
- Indicator Settings:
Core Parameters
Lookback Period (Default: 200)
Lower (50-100): More responsive to recent price action, catches short-term levels
Higher (300-500): Focuses on major historical levels, more stable but less responsive
Best for: Day trading (100-150), Swing trading (200-300), Position trading (400-500)
Volume Spike Threshold (Default: 1.5)
Lower (1.2-1.4): More sensitive, catches smaller volume increases, more levels detected
Higher (2.0-3.0): Only major volume surges count, fewer but stronger signals
Market dependent: High-volume stocks may need higher thresholds (2.0+), low-volume stocks lower (1.2-1.3)
Price Bins (Default: 50)
Lower (20-30): Broader price zones, less precise but captures wider areas
Higher (70-100): More granular levels, precise but may be overly specific
Volatility dependent: High volatility assets benefit from more bins (70+)
Minimum PMI Score (Default: 0.5)
Lower (0.2-0.4): Shows more levels including weaker ones, comprehensive view
Higher (1.0-2.0): Only statistically strong levels, cleaner chart
Progressive filtering: Start with 0.5, increase if too cluttered
Max Levels to Show (Default: 8)
Fewer (3-5): Clean chart focusing on strongest levels only
More (10-15): Comprehensive view but may clutter chart
Strategy dependent: Scalpers prefer fewer (3-5), swing traders more (8-12)
Historical Tracking Settings
Update Frequency (Default: 20 bars)
Lower (5-10): More frequent updates, captures rapid market changes
Higher (50-100): Less frequent updates, focuses on major structural shifts
Timeframe scaling: 1-minute charts need lower frequency (5-10), daily charts higher (50+)
Show Historical Levels (Default: True)
Enables the "breadcrumb trail" effect showing evolution of support/resistance
Disable for cleaner charts focusing only on current levels
Max Historical Marks (Default: 50)
Lower (20-30): Less memory usage, shorter history
Higher (100-200): Longer historical context but more resource intensive
Fade Strength (Default: 0.8)
Lower (0.5-0.6): Historical levels more visible
Higher (0.9-0.95): Historical levels very subtle
Visual Settings
Support/Resistance Colors: Choose colors that contrast well with your chart theme Line Width: Thicker lines (3-4) for better visibility on busy charts Show PMI Scores: Toggle labels showing statistical strength Label Size: Adjust based on screen resolution and chart zoom level
- Most Effective Usage Strategies
For Day Trading:
Setup: Lookback 100-150, Volume Threshold 1.8-2.2, Update Frequency 10-15
Use PMI levels as bounce/rejection points for scalp entries
Higher PMI scores (>1.5) offer better probability setups
Watch for volume spike confirmations at levels
For Swing Trading:
Setup: Lookback 200-300, Volume Threshold 1.5-2.0, Update Frequency 20-30
Enter on pullbacks to high PMI support levels
Target next resistance level with PMI score >1.0
Hold through minor levels, exit at major PMI levels
For Position Trading:
Setup: Lookback 400-500, Volume Threshold 2.0+, Update Frequency 50+
Focus on PMI scores >2.0 for major structural levels
Use for portfolio entry/exit decisions
Combine with fundamental analysis for timing
- Trading Applications:
Entry Strategies:
PMI Bounce Trades
Price approaches high PMI support level (>1.0)
Wait for volume spike confirmation (orange triangles)
Enter long on bullish price action at the level
Stop loss just below the PMI level
Target: Next PMI resistance level
PMI Breakout Trades
Price consolidates near high PMI level
Volume increases (watch for orange triangles)
Enter on decisive break with volume
Previous resistance becomes new support
Target: Next major PMI level
PMI Rejection Trades
Price approaches PMI resistance with momentum
Watch for rejection signals and volume spikes
Enter short on failure to break through
Stop above the PMI level
Target: Next PMI support level
Risk Management:
Stop Loss Placement
Place stops 0.1-0.5% beyond PMI levels (adjust for volatility)
Higher PMI scores warrant tighter stops
Use ATR-based stops for volatile assets
Position Sizing
Larger positions at PMI levels >2.0 (highest conviction)
Smaller positions at PMI levels 0.5-1.0 (lower conviction)
Scale out at multiple PMI targets
- Key Warning Signs & What to Watch For
Red Flags:
🚨 Very Low PMI Scores (<0.3): Weak statistical significance, avoid trading
🚨 No Volume Confirmation: PMI level without recent volume spikes may be stale
🚨 Overcrowded Levels: Too many levels close together suggests poor parameter tuning
🚨 Outdated Levels: Historical traces are reference only, not tradeable
Optimization Tips:
✅ Regular Recalibration: Adjust parameters monthly based on market regime changes
✅ Volume Context: Always check for recent volume activity at PMI levels
✅ Multiple Timeframes: Confirm PMI levels across different timeframes
✅ Market Conditions: Higher thresholds during high volatility periods
Interpreting PMI Scores
PMI Score Ranges:
0.5-1.0: Moderate statistical significance, proceed with caution
1.0-1.5: Good significance, reliable for most trading strategies
1.5-2.0: Strong significance, high-confidence trade setups
2.0+: Very strong significance, institutional-grade levels
Historical Context: The historical trace system shows how support and resistance evolve over time. When current levels align with multiple historical traces, it indicates persistent market memory at those prices, significantly increasing the level's reliability.

5/21 EMA Crossover AlertThis is a basic indicator which shows when the 5 EMA crosses through the 21 indicating a possible buy or sell signal. remember, this is only an indicator—indicators indicate and the mroe indicators you have, the more confirmation you may find...all to say, don't just rely on any one "holy grail" indicator.

Zen Open - 18 Bar v2Zen Open – 18 Bar Box (RTH Study Tool)
📄 Description:
This script highlights the first 18 bars of each Regular Trading Hours (RTH) session with a visual box and optional range label. It is intended as a study aid for traders analyzing early session structure.
Features:
• Draws a box around the first 18 bars of the RTH session
• Displays the total range as a label (optional)
• Fully customizable box color and transparency
Intended Use:
This is an educational and visual analysis tool to help traders research how the RTH open influences the rest of the session.
Tight opening range may suggest range expansion
Wide opening range may indicate reduced movement or reversal risk
This script does not generate trading signals, does not offer financial advice, and does not promote any service. It is provided for discretionary study and chart analysis only.

[GalihRidha] Scalping Dashboard 5m Scalping Dashboard 5m is a practical, real-time, and user-friendly indicator designed for 5-minute intraday scalping strategies. This indicator provides clear, actionable signals along with dynamic risk management levels, all visualized in a single vertical dashboard on your chart.
Key Features:
Actionable Next Signal:
Generates a strong, easy-to-follow trading signal ("LONG" or "SHORT") every 5 minutes, based on a multi-factor algorithm (MA20/MA50 trend, RSI, price/volume strength, candle momentum, and market structure).
Dynamic TP/SL Calculation:
Automatically displays recommended Take Profit (TP) and Stop Loss (SL) price ranges, calculated from recent price action, support/resistance, and volatility (ATR).
Vertical Dashboard Layout:
Information is neatly split between "LAST SECTION" (your most recent executed signal, TP, and SL) and "NEXT SECTION" (real-time signal, recommended TP/SL, and current price). Perfectly formatted for both desktop and mobile TradingView use.
Live "Capturing" Status:
When a new signal is forming (1 minute before candle close), the dashboard shows an animated "Capturing..." status—so you always know when the indicator is preparing the next actionable trade.
Buffered Signal Logic:
Prevents “signal repainting” by ensuring that your "Last Signal" and TP/SL levels are exactly what was shown in the previous Next Signal, never the recalculated value from a new bar. This is vital for honest backtesting and live trade confidence.
Zero Lag, Mobile Ready:
Designed to be lightweight and responsive, with instant dashboard updates and no visual lag—even on slower connections or when switching timeframes.
No repaint, no lagging, pure price action + volatility logic.
How to Use:
Add to Chart
Apply the indicator to any liquid crypto or forex pair on the 5-minute (5m) timeframe.
Watch the Dashboard
1 minute before the close of each 5-minute candle, the "Next Signal" section will activate.
"Capturing..." status (with animated dots) means a new entry signal is forming.
Use the suggested Entry, TP Range, and SL for your scalping strategy.
Follow the Signal
When "Next Signal" appears, you have 1 minute to enter the trade if desired.
After the signal passes, the values are locked into the "Last Section" for reference, record-keeping, or trade management.
Mobile Friendly
The vertical format ensures the dashboard is always visible and readable on both web and mobile versions of TradingView.
No need to manually refresh or guess when a new signal is forming—just watch for "Capturing..."!
Best Practice & Tips:
For best results, use on trending or high-volume assets. Avoid low liquidity or choppy sideways markets.
Combine with your own risk management and execution strategy for maximum performance.
This dashboard is 100% Pine Script v5, fully open-source, and does not repaint. You can customize TP/SL logic or integrate with alerts for even more automation.
Why This Indicator?
Most scalping indicators provide signals, but don't show you the real, actionable context—especially in mobile or fast-moving markets.
This dashboard solves that problem by giving you everything you need for quick, clear, and confident trading—all in one place, with true buffer logic so your entries and results are always honest and reproducible.
Happy scalping and stay disciplined—let the dashboard do the heavy lifting for you! 🚀

EMA TableSimple price vs. EMA state table describing where price resides relative to the 20, 50, 100, 200 EMA bands

WMA(10) Momentum Indicatorshows wma momentum. work in progress. Attempts to capture mementum changes and confirm current trend direction. i will be expanding on this.

Session Overlay - FXMontys dual session overlayDeveloped by FX Monty
This indicator was created for traders who want a cleaner, more structured way to mark their session highs and lows, as well as lower time frame supply and demand zones using volume-based analysis.
🔹 What This Indicator Is For
Designed to complement both the Core Sessions and CM Sessions indicators.
Helps identify key trading sessions: Asia, London, and New York.
Supports traders who blend session structure, liquidity, and LTF price action for more precise setups.
📌 How to Use
Marking Highs & Lows:
Use the Core Sessions Indicator to mark session highs and lows. You can use either a box or a horizontal ray — whichever gives the cleanest visual.
Supply & Demand Zones (LTF):
Use the CM Sessions Indicator for marking LTF supply and demand zones within a session.
➤ Don’t forget to adjust your session times manually, especially for daylight savings.
High/Low of Day (HOD/LOD):
Use the 5-minute timeframe on the CM Sessions chart to mark the day’s highs and lows.
✘ Exclude the Asia session from this when evaluating HOD/LOD.
🧠 Strategy Background
This indicator is rooted in two powerful trading methodologies from my mentors:
TJR's Liquidity Concepts – Which influence how we frame session-based liquidity using the Core Sessions logic.
JordanFX's Session-Based Approach – The inspiration for using session structuring for lower time frame entries.
💙 Rest in peace, Jordan. This is for you.
This tool is part of my personal workflow, and I built it to make complex setups easier to visualize and act on. I hope it provides you with clarity, structure, and confidence in your trades.
Happy trading,
— FX Monty

Gaussian Volatility Adjusted Key Features:Gaussian Smoothing: Applies a Gaussian filter to smooth price data (based on EMA or raw close prices), reducing noise while preserving trend information.
Volatility Adjustment: Uses ATR and standard deviation to create dynamic upper and lower bands around the smoothed price, adapting to market volatility.
Trend Detection: Identifies bullish (price above lower band) or bearish (price below upper band) trends, with additional confirmation using standard deviation thresholds.
Momentum Analysis: Measures momentum by calculating the price difference from key levels (upper band for bullish, Gaussian + standard deviation for bearish).
EMA Confluence: Optionally integrates an EMA of the momentum difference to confirm trend signals, enhancing accuracy.
Visual Output: Plots a zero line and an EMA line colored green (bullish) or red (bearish), with bar coloring to visually indicate trend direction.

Staccked SMA - Regime Switching & Persistance StatisticsThis indicator is designed to identify the prevailing market regime by analyzing the behavior of a "stack" of Simple Moving Averages (SMAs). It helps you understand whether the market is currently trending, mean-reverting, or moving randomly.
Core Concept: SMA Correlation
At its heart, the indicator examines the relationship between a set of nine SMAs with different lengths (3, 5, 8, 13, 21, 34, 55, 89, 144) and the lengths themselves.
In a strong trending market (either up or down), the SMAs will be neatly "stacked" in order of their length. The shortest SMA will be furthest from the longest SMA, creating a strong, almost linear visual pattern. When we measure the statistical correlation between the SMA values and their corresponding lengths, we get a value close to +1 (perfect uptrend stack) or -1 (perfect downtrend stack). The absolute value of this correlation will be very high (close to 1).
In a mean-reverting or sideways market, the SMAs will be tangled and crisscrossing each other. There is no clear order, and the relationship between an SMA's length and its price value is weak. The correlation will be close to 0.
This indicator calculates this Pearson correlation on every bar, giving a continuous measure of how ordered or "trendy" the SMAs are. An absolute correlation above 0.8 is considered strongly trending, while a value between 0.4 and 0.8 suggests a mean-reverting character. Below 0.4, the market is likely random or choppy.
Regime Classification and Statistics
The indicator doesn't just look at the current correlation; it analyzes its behavior over a user-defined lookback window (default is 252 bars) to classify the overall market "regime."
It presents its findings in a clear table:
📊 |SMA Correlation| Regime Table: This main table provides a snapshot of the current market character.
Median: Shows the median absolute correlation over the lookback period, giving a central tendency of the market's behavior.
% > 0.80: The percentage of time the market was in a strong trend during the lookback period.
% < 0.80 & > 0.40: The percentage of time the market showed mean-reverting characteristics.
🧠 Regime: The final classification. It's labeled "📈 Trend-Dominant" if the median correlation is high and it has spent a significant portion of the time trending. It's labeled "🔄 Mean-Reverting" if the median is in the middle range and it has spent significant time in that state. Otherwise, it's considered "⚖️ Random/ Choppy".
📐 Regime Significance: This tells you how statistically confident you can be in the current regime classification, using a Z-score to compare its occurrence against random chance. ⭐⭐⭐ indicates high confidence (99%), while "❌ Not Significant" means the pattern could be random.
Regime Transition Probabilities
Optionally, a second table can be displayed that shows the historical probability of the market transitioning from one regime to another over different time horizons (t+5, t+10, t+15, and t+20 bars).
📈 → 🔄 → ⚖️ Transition Table: This table answers questions like, "If the market is trending now (From: 📈), what is the probability it will be mean-reverting (→ 🔄) in 10 bars?"
This provides powerful insights into the market's cyclical nature, helping you anticipate future behavior based on past patterns. For example, you might find that after a period of strong trending, a transition to a choppy state is more likely than a direct switch to a mean-reverting
Indicator Settings
Lookback Window for Regime Classification: This sets the number of recent bars (default is 252) the script analyzes to determine the current market regime (Trending, Mean-Reverting, or Random). A larger number provides a more stable, long-term view, while a smaller number makes the classification more sensitive to recent price action.
Show Regime Transition Table: A simple toggle (on/off) to show or hide the table that displays the probabilities of the market switching from one regime to another.
Lookback Offset for Starting Regime: This determines the "starting point" in the past for calculating regime transitions. The default is 20 bars ago. The script looks at the regime at this point and then checks what it became at later points.
Step 1, 2, 3, 4 Offset (bars): These define the future time intervals (5, 10, 15, and 20 bars by default) for the transition probability table. For example, the script checks the regime at the "Lookback Offset" and then sees what it transitioned to 5, 10, 15, and 20 bars later.
Significance Filter Settings
Use Regime Significance Filter: When enabled, this filter ensures that the regime transition statistics only count transitions that were "statistically significant." This helps to filter out noise and focus on more reliable patterns.
Min Stars Required (1=90%, 2=95%, 3=99%): This sets the minimum confidence level required for a regime to be included in the transition statistics when the significance filter is on.
1 ⭐: Requires at least 90% confidence.
2 ⭐⭐: Requires at least 95% confidence (default).
3 ⭐⭐⭐: Requires at least 99% confidence.

TRIPLE Moving AveragesThis Pine Script indicator plots three customizable moving averages (MAs) along with an optional composite MA (average of all three). It provides visual cues, alerts, and trend confirmation based on MA crossovers and price positioning relative to the MAs.
🔹 Key Features
1. Multiple Moving Average Types
Supports 7 different MA types for each line:
EMA (Exponential Moving Average)
SMA (Simple Moving Average)
SMMA / RMA (Smoothed / Regular Moving Average)
WMA (Weighted Moving Average)
VWMA (Volume Weighted Moving Average)
HMA (Hull Moving Average)
2. Three Independent MAs
MA1, MA2, MA3 can each be enabled/disabled
Custom lengths (default: 12, 21, 50)
Different price sources (close, open, high, low, etc.)
3. Composite Moving Average (Optional)
Calculates (MA1 + MA2 + MA3) / 3
Acts as a consensus trend filter
4. Visual & Alert Features
✅ Color-Coded Lines (Yellow = Price Above MA, Red = Price Below MA)
✅ Thick Line Width (3) for better visibility
✅ Background Highlights for crossovers/crossunders
✅ Alerts for All Crossover Combinations
🔹 How It Works
📈 MA Crossovers & Trend Signals
Bullish Signal: When a faster MA crosses above a slower MA
Bearish Signal: When a faster MA crosses below a slower MA
Trend Confirmation: All MAs aligned in the same direction (e.g., MA1 > MA2 > MA3 = Strong Uptrend)
🎨 Visual Indicators
Green Background → Bullish crossover detected
Red Background → Bearish crossover detected
Yellow Line → Price is above the MA (bullish)
Red Line → Price is below the MA (bearish)
🔔 Alert Conditions
Alerts are triggered for all possible MA crossover combinations, including:
MA1 crossing MA2
MA1 crossing MA3
MA2 crossing MA3
Any MA crossing the Composite MA

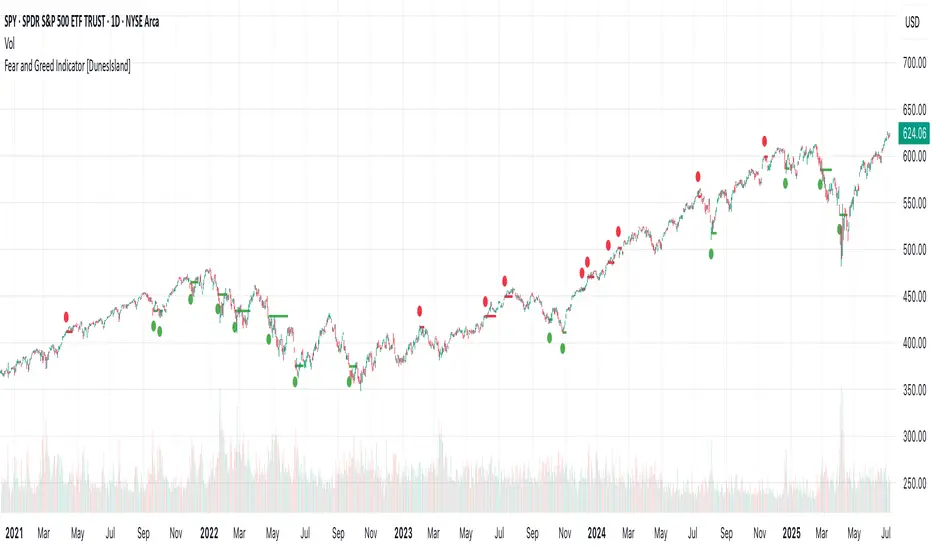
Fear and Greed Indicator [DunesIsland]The Fear and Greed Indicator is a TradingView indicator that measures market sentiment using five metrics. It displays:
Tiny green circles below candles when the market is in "Extreme Fear" (index ≤ 25), signalling potential buys.
Tiny red circles above candles when the market is in "Greed" (index > 75), indicating potential sells.
Purpose: Helps traders spot market extremes for contrarian trading opportunities.Components (each weighted 20%):
Market Momentum: S&P 500 (SPX) vs. its 125-day SMA, normalized over 252 days.
Stock Price Strength: Net NYSE 52-week highs (INDEX:HIGN) minus lows (INDEX:LOWN), normalized.
Put/Call Ratio: 5-day SMA of Put/Call Ratio (USI:PC).
Market Volatility: VIX (VIX), inverted and normalized.
Stochastic RSI: 14-period RSI on SPX with 3-period Stochastic SMA.
Alerts:
Buy: Index ≤ 25 ("Extreme Fear - Potential Buy").
Sell: Index > 75 ("Greed - Potential Sell").
EMA-Pack MTFEMA-Pack MTF
This TradingView Pine Script defines a custom indicator called "EMA-Pack MTF" that overlays various types of moving averages and Bollinger Bands across multiple timeframes on a chart. It begins by importing the built-in technical analysis library and defining a custom ma function that calculates several types of moving averages (SMA, EMA, TEMA, DEMA, HMA, and ALMA) based on user input. The ema function is the core logic, retrieving market data for the specified timeframe and calculating fast, mid, slow, 50, 100, and 200-period moving averages along with Bollinger Band components (basis, upper, and lower bands). The function adjusts values to the nearest valid price tick and returns them.
User input fields allow customization of timeframes, source data, moving average types, and Bollinger Band parameters. The script calls the ema function for each selected timeframe (1 minute, 5 minutes, 15 minutes, 1 hour, 4 hours, and 1 day), storing their respective computed values. It then plots the calculated moving averages and Bollinger Band basis lines on the chart, using different colors and line widths to distinguish between them. Some plots are hidden by default (display.none) to reduce chart clutter. This script is useful for multi-timeframe trend analysis using customizable moving averages and Bollinger Bands.

Intraday Reversal Pro1. CALL (Long/Buy) Setup
Green "CALL" label appears below a candle:
The system thinks a bullish reversal is likely.
This happens when there’s a liquidity sweep (price sweeps below recent lows), an FVG (Fair Value Gap) below price, RSI is oversold, and short-term EMA is above the long-term EMA.
Red dashed line (Stop Loss):
This is your suggested stop loss (for a call/long option) — place it at or just below this line.
Green dashed line (Take Profit):
This is your suggested take profit (for the option) — consider exiting here for a 2:1 reward/risk trade.
2. PUT (Short/Sell) Setup
Red "PUT" label appears above a candle:
The system thinks a bearish reversal is likely.
This happens when there’s a liquidity sweep above recent highs, an FVG above price, RSI is overbought, and short-term EMA is below the long-term EMA.
Red dashed line (Stop Loss):
This is your suggested stop loss (for a put/short option) — place it at or just above this line.
Green dashed line (Take Profit):
This is your suggested take profit (for the put/short option).
How to Trade with It:
Wait for a CALL or PUT label to appear (ideally after a sweep + FVG).
Enter your option position at/near the signal candle close.
Set your stop loss at the red dashed line (for calls, below; for puts, above).
Take profit at the green dashed line.
Optional: Use alerts to be notified when a new signal appears.


ADX_Power_IndikatorThe ADX Power Indicator is a technical analysis tool based on the well-known Average Directional Index (ADX) developed by Welles Wilder.
This script visualizes the core components of the ADX system – +DI, –DI, and ADX – in a clean and focused way. It emphasizes the crossovers between +DI and –DI, which can serve as potential entry or exit signals.
🔍 Features
Plots the ADX line as a stepped line to represent trend strength
Displays +DI (green) and –DI (red) lines clearly
Highlights important crossovers with colored crosses:
✅ Buy signal: +DI crosses above –DI (green cross)
❌ Sell signal: –DI crosses above +DI (red cross)
Clean and minimalistic layout – great for combining with other strategies
📈 How to Use
This indicator is ideal for traders who want to:
Measure trend strength using ADX
Detect trend reversals through DI crossovers
Confirm entries and exits based on momentum shifts
The default parameters (14-period DI and ADX) can be adjusted in the script to suit your trading style or market conditions.

Super Neema!🟧 Super Neema! — Multi-Timeframe EMA-9 Overlay
🔍 What is "Neema"?
The term "Neema" has recently emerged among traders such as Jeff Holden—a top proprietary trading firm trader—whose colleagues colloquially use "Neema" as shorthand for the 9-period Exponential Moving Average (EMA). Due to its increasing popularity and reliability, the phrase caught on quickly as traders needed a quick, memorable name for such an essential tool.
📚 Why the 9-EMA?
Scalping around the 9-EMA is now one of the most widely used intraday trading techniques. Traders of various experience levels frequently rely on it because it effectively highlights short-term momentum shifts.
But there's a crucial nuance: traders across different assets or market periods don't always agree on which timeframe’s 9-EMA to follow. Depending on who's currently active in the market, the dominant "Neema" could be the 1-minute, 2-minute, 3-minute, or 5-minute 9-EMA. This variation arises naturally due to differences in trader populations, risk tolerance, style, and current market conditions.
👥 Social Convention & Normative Social Influence
Trading is fundamentally a social activity, and normative social influence plays a critical role in market behavior. Traders don’t operate in isolation; they follow patterns, respond to cues, and rely on shared conventions. The popularity of any given indicator—like the 9-EMA—is not just technical, but deeply social. Traders adapt to what's socially accepted, recognizable, and effective.
Over time, these conventions shift. What once was "the standard" timeframe can subtly evolve as dominant traders or institutions shift their preferred style or timeframe, creating "variants" of established trends. Understanding this dynamic is essential for market participants because recognizing where the majority of traders currently focus gives a critical edge.
📈 Why Does This Matter? (Market Evolution & Trader Adaptability)
Market trends aren't just technical—they're social constructs. As markets evolve, participants adapt their methods to fit new norms. Traders who recognize and adapt quickly to these evolving norms gain a decisive advantage.
By clearly visualizing multiple Neemas (9-EMAs across timeframes) simultaneously, you don't merely see EMA levels—you visually sense the current social convention of the market. This heightened awareness helps you stay adaptive and flexible, aligning your strategy dynamically with the broader community of traders.
🎨 Transparency Scheme (Visual Identification):
5-minute Neema: Most opaque, brightest line (slowest, most significant trend)
3-minute Neema: Slightly more transparent
2-minute Neema: Even more transparent
1-minute Neema: Most transparent, subtle background hint (fastest, quickest reaction)
This deliberate visual hierarchy makes it intuitive to identify immediately which timeframe is currently dominant, and therefore, which timeframe other traders are using most actively.
✅ Works on:
Any timeframe, any chart. Automatically plots the 1m–5m EMA-9 lines regardless of your current chart.
🧠 Key Insight:
Markets are driven by social trends and normative influence.
Identifying the currently dominant timeframe (the Neema most respected by traders at that moment) is a powerful, socially-informed edge.
Trader adaptability isn't just technical—it's social awareness in action.
Enjoy your trading, and welcome to Super Neema! ⚡

The Frendicator#1 Indicator for all Frens
This indicator was made for the one and only Master Fren
This indicator revolves around two things: Time and Price
This indicator also splits days into easy to understand segments!

Rubab's Buy/Sell + Reversal SignalThis indicstor helps to identify the reversal and provides entry exit signal.
