Futures Support & Resistance LevelsMulti-Timeframe Support & Resistance Levels for Futures Trading
Description:
This indicator automatically identifies and displays key support and resistance levels using multiple technical analysis methods. Designed specifically for futures traders (ES, NQ, etc.), it provides a clean, organized view of important price levels.
Key Features:
Multiple Detection Methods: Combines pivot points, daily ranges, and psychological levels
Smart Ranking System: Levels are numbered by strength (1 = strongest)
Clean Visualization: Extended lines across the chart with clear price labels
Confluence Detection: Highlights areas where multiple levels converge
Customizable Display: Adjust colors, line styles, and label sizes
Level Types Identified:
Daily High/Low (current session)
Previous Daily High/Low
Pivot-based Support/Resistance
Psychological Round Numbers
Confluence Zones (multiple levels clustering)
Technical Approach:
The indicator uses a strength-scoring algorithm to rank levels by importance. Daily levels receive the highest weighting (2.0), followed by previous daily levels (1.5), pivot points (1.0), and psychological levels (0.5). This helps traders focus on the most significant levels.
Visual Elements:
Solid lines = Strong levels
Dashed lines = Medium levels
Dotted lines = Weak levels
Optional technical condition markers for educational analysis
Best Used For:
Identifying key intraday levels for futures trading
Finding high-probability reversal zones
Setting logical stop-loss and take-profit levels
Recognizing confluence areas for stronger setups
Note:
This is a technical analysis tool for educational purposes. No indicator can predict future price movements. Always use proper risk management and combine with other forms of analysis.
Indicators and strategies

Institutional Sessions Overlay (Asia/London/NY)Institutional Sessions Overlay is a professional TradingView indicator that visually highlights the main trading sessions (Asia, London, and New York) directly on your chart.
Customizable: Easily adjust session start and end times (including minutes) for each market.
Timezone Alignment: Shift session boxes using the timezone offset parameter so sessions match your chart’s timezone exactly.
Clear Visuals: Colored boxes and optional labels display session opens and closes for fast institutional market structure reference.
Toggle Labels: Show or hide session open/close labels with a single click for a clean or detailed look.
Intuitive UI: User-friendly grouped settings for efficient configuration.
This tool is designed for day traders, institutional traders, and anyone who wants to instantly recognize global session timing and ranges for SMC, ICT, and other session-based strategies.
How to use:
Set your chart to your local timezone.
Use the "Session timezone offset" setting if session boxes do not match actual session opens on your chart.
Adjust the hours and minutes for each session as needed.
Enable or disable labels in the “Display” settings group.
Tip: Use the overlay to spot session highs and lows, volatility windows, and institutional liquidity sweeps.

SMA+Volume Buy AlertsOverview
This lightweight indicator combines trend and momentum filters to pinpoint high-conviction, oversold entries on ETFs or stocks. It plots your choice of two SMAs (default 100- & 200-day) and a 20-day volume moving average, then only flags a “BUY” when price crosses below an SMA and daily volume exceeds its average.
Use it to capture institutional-strength reversals without alert noise, and receive a single, clear signal exactly when market participants step in.
Key Features
Dual SMA Trend Lines (100/200-day by default)
Volume Filter (20-day avg): only overshoots on above-average volume signal
One-Shot Buy Markers: triangles appear beneath the precise bar that crosses under your SMA on high volume
Alert Conditions: “Buy 100 SMA + High Vol” and “Buy 200 SMA + High Vol” ready for desktop, mobile, or webhooks
Show/Hide Toggle for your SMA lines
100% Pine v6, optimized for speed and compatibility
Inputs
Short SMA Length (default 100)
Long SMA Length (default 200)
Volume MA Length (default 20)
Show SMA Lines toggle
How to Use
Add to Chart: Copy & paste this script into TradingView’s Pine editor, then Save & Add to Chart.
Configure Inputs: Adjust SMA and volume-MA lengths to your trading style.
Create Alerts:
Open “Create Alert,” select the “SMA-VOL-BUY” indicator.
Choose “Buy 100 SMA + High Vol” or “Buy 200 SMA + High Vol.”
Set trigger to “Once Per Bar Close.”
Trade with Confidence: Only the most significant, high-volume overshoots get flagged—no spam, just high-quality setups.
Best Practices
Frame Alignment: Combine daily signals with a weekly SMA trend filter for multi-timeframe confirmation.
Volume Context: Ensure that “high” volume truly represents above-average activity in your chosen security.
Risk Management: Use the signal bar’s low as your stop, and size positions to match your risk tolerance.
Review & Iterate: Tweak SMA or volume lengths to suit fast-moving sectors (e.g. 50/100 SMAs) or slower large-caps.

SMA Undervalue Buy AlertsSMA Undervalue Buy Alerts
Free, open-source Pine v6 indicator for spotting undervalued ETF/stock entries
This simple yet powerful indicator plots two user-configurable Simple Moving Averages (default 100- and 200-day) on your chart and automatically marks any bar where price closes below those SMAs with an on-chart “BUY” triangle. It’s ideal for ETF traders who want a systematic, price-action-based signal whenever a major trend filter is breached to the downside—often a sign of short-term overselling in an otherwise up-trending market.
Key Features
Dual SMA Lines (default 100/200): Smooth out noise and highlight medium- and long-term trend backdrops
Automatic Buy Markers: Triangles appear beneath any candle that closes under your chosen SMA, so you never miss an overshoot
Built-in Alert Conditions: Four alert hooks—“Buy 100 SMA” and “Buy 200 SMA”—let you receive desktop, mobile or webhook notifications the moment a close beneath your SMAs occurs
Show/Hide Toggle: Quickly turn the SMA lines on or off without removing the script
100% Pine v6: Fast, lightweight, and compatible with all TradingView chart types
How to Use
Add to Chart: Copy & paste the Pine v6 code into TradingView’s Pine editor, then Save & Add to Chart.
Configure Inputs: Adjust “Short SMA Length” and “Long SMA Length” to your preferred look-back periods (e.g. 50/200, 20/50, etc.).
Create Alerts: In the Create Alert dialog, choose your indicator, then select “Buy 100 SMA” or “Buy 200 SMA” under Series. Set it to “Once Per Bar Close” for reliable signals.
Trade Management: Use the buy markers as entry triggers or confirm with volume, RSI, or other confluence tools before committing.
Best Practices
Trend Confirmation: Combine with a higher-TF trend filter (e.g. 200 SMA on weekly) to stay aligned with the broader market
Volume Check: Look for above-average volume on overshoot candles to validate institutional interest
Risk Control: Always define your stop (e.g. below the low of the signal bar) and position-size responsibly

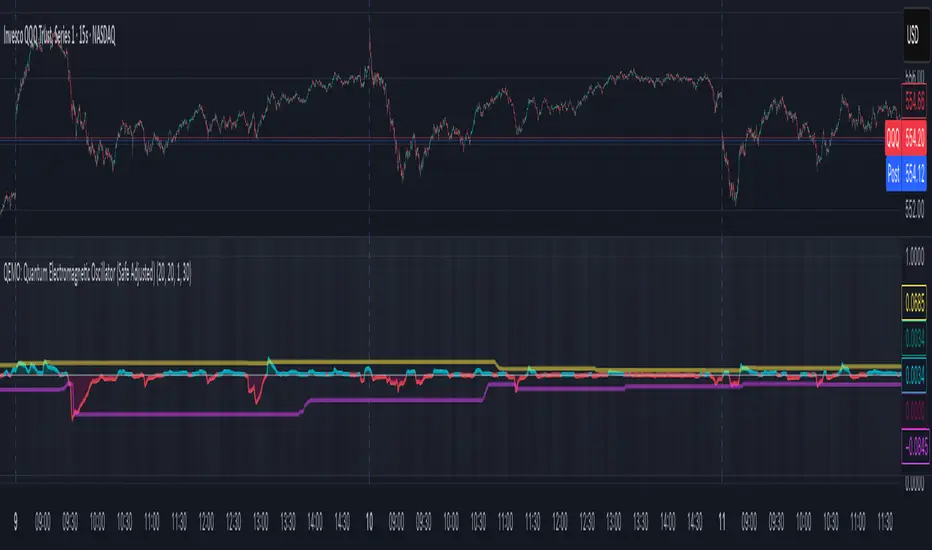
QEMO: Quantum Electromagnetic Oscillator (Safe Adjusted)This is a highly conceptual and oscillator and It attempts to model market dynamics by borrowing concepts from quantum physics and electromagnetism to create a unique oscillator. It does not represent any real physical phenomena but uses these concepts as metaphors for market forces.
Here is a breakdown of its core components:
1. Quantum Price Wavefunction (The Core Price Engine)
This is the most abstract part of the script. It tries to model price not as a single point, but as a "wavefunction" representing a distribution of probable future prices.
Volatility & Price Grid: It first calculates recent market volatility. Based on this volatility, it creates a dynamic grid of possible price levels (price_bins) around the current price.
Probability Density: It assigns a probability to each price level in the grid.
"Energy" Operators:
Kinetic Energy: Metaphorically represents the "momentum" or rate of change of the price probabilities.
Potential Energy: A force field that influences the probabilities, derived from a combination of volatility and trading volume.
Expected Price: After evolving these probabilities, it calculates a single "expected price" which is the weighted average of all prices in the grid, based on their final probabilities.
2. Electromagnetic Fields (Buying vs. Selling Pressure)
This section models the battle between buyers and sellers in a more familiar way:
E-Field (Electric/Buying): Represents buying pressure, calculated from upward price moves (close - open) multiplied by volume.
B-Field (Magnetic/Selling): Represents selling pressure, calculated from downward price moves (open - close) multiplied by volume.
Lorentz Force (F_net): This is the net force (E - B), representing the overall directional pressure in the market. A positive value means buyers are in control; a negative value means sellers are.
3. Entanglement Entropy (Systemic Risk/Stability)
This component aims to measure the market's stability or "systemic risk."
It calculates a form of auto-correlation on recent price returns.
A high degree of instability in this correlation results in a high "Entropy" (S) value.
Essentially, a high S suggests the market is chaotic and unpredictable (low stability), while a low S suggests it is more stable and trending.
4. Final QEMO Calculation & Plotting
All the components are combined to create the final oscillator value:
Final Value: The qemo value is a product of the expected_price, the amplified net force, and the market stability (1 - S).
Smoothing: This raw qemo value is then smoothed with an Adaptive Moving Average (AMA) to produce the final line that gets plotted on the chart.
Visualization:
The main oscillator line is plotted below the chart. Its color changes based on its value (e.g., blue for positive, red for negative).
The background color of the indicator pane changes based on the Entropy (S), providing an immediate visual cue of market stability (e.g., black for stable, white for chaotic).
The script also plots 99th and 1st percentile bands to help identify statistically extreme readings in the oscillator's value.
[Enhanced] L1 Banker Move🧠 L1 Banker Move
This is a multi-layered momentum signal tool designed to reveal institutional activity before major price moves. It combines deep liquidity detection, price pressure dynamics, and short-term investor alignment to deliver actionable signals with clarity and precision.
Key Features:
🔴 Institutional Signal
Detects potential Level 1 banker moves based on deep price compression and long-term sweep logic (Lowest Low 90 + smoothed momentum spikes).
🔵 Institutional Build Phase
Shows stealth accumulation/distribution zones using low volatility buildup and compression-based ratios over the past 30 bars.
🟢 Short-Term Investor Signal
Confirms price shifts with VWAP cross, SMA structure, and fast/slow EMA delta acceleration. Useful for timing precision entries after institutional setups.
💜 Combined Strength Histogram
A composite momentum bar that blends all three layers to visually rank the power of each setup.
🎯 Smart Highlighting & Alerts
Background turns red when an institutional signal appears without retail confirmation—flagging early entry traps or front-running zones. Includes alert conditions to notify you of optimal entry moments.
Customization:
Adjust the EMA delta sensitivity
Choose your preferred institutional timeframe (default: Daily)

[Enhanced] L1 Banker MoveThis is a multi-layered momentum signal tool designed to reveal institutional activity before major price moves. It combines deep liquidity detection, price pressure dynamics, and short-term investor alignment to deliver actionable signals with clarity and precision.
Key Features:
🔴 Institutional Signal
Detects potential Level 1 banker moves based on deep price compression and long-term sweep logic (Lowest Low 90 + smoothed momentum spikes).
🔵 Institutional Build Phase
Shows stealth accumulation/distribution zones using low volatility buildup and compression-based ratios over the past 30 bars.
🟢 Short-Term Investor Signal
Confirms price shifts with VWAP cross, SMA structure, and fast/slow EMA delta acceleration. Useful for timing precision entries after institutional setups.
💜 Combined Strength Histogram
A composite momentum bar that blends all three layers to visually rank the power of each setup.
🎯 Smart Highlighting & Alerts
Background turns red when an institutional signal appears without retail confirmation—flagging early entry traps or front-running zones. Includes alert conditions to notify you of optimal entry moments.
Customization:
Adjust the EMA delta sensitivity
Choose your preferred institutional timeframe (default: Daily)

Quarterly Theory Levels - Period BasedOpen, true open, market close for daily weekly, monthly, quarterly, yearly.

上涨动能This indicator calculates and visualizes the difference between the 20-period EMA and the 120-period EMA, helping traders identify medium-term momentum shifts in price action.
What It Does:
✅ Calculates the difference: Diff=EMA20 − EMA120
✅ Plots a line representing this difference for clear trend tracking.
✅ Plots a histogram (colored bars): Green bars indicate the EMA20 is above EMA120, suggesting bullish momentum. Red bars indicate the EMA20 is below EMA120, suggesting bearish momentum.
✅ Includes a zero baseline for easy reference: When the value crosses above zero, it indicates a potential bullish shift. When it crosses below zero, it indicates a potential bearish shift.
How to Use:
✅Use this indicator to visualize trend momentum in your crypto, forex, or stock trading.
✅Combine with your entry/exit signals (e.g., RSI, volume spikes, price action levels) to refine your strategy.
✅A rising Diff suggests strengthening bullish momentum, while a falling Diff suggests strengthening bearish momentum.
Why It’s Useful:
✅ Filters noise by using EMA smoothing on both short and long periods.
✅ Helps identify momentum shifts early without being overly sensitive to short-term volatility.
✅ Easy to integrate into trend-following or pullback strategies.

Multi-Timeframe Bands (Horizontal Table, Robust, No get_cols)Mulit-timeframe /Kelt Bands with Table Price tracker
This is a simple Kelt style Band indicator draws colored horizontal bands representing the high (top) and low (bottom) for each of the following timeframes:
4h: Blue (bottom), Red (top)
1D: Gold (bottom/top)
1W: Purple (bottom/top)
1M: Orange (bottom/top)
Quarterly: Light purple (bottom/top)
The script works on any chart timeframe, and the bands will update dynamically.
I've added a horizontal box to show the corresponding prices at the top.

Market Breadth TableDisplay overall market condition, can select different trading market NYSE or NASDAQ, if declining stock number is more than advancing same day is not good for heavy traded long position
You can adjust the table position in the chart as well

Enhanced Neowave Wave 1 Finder with ZigZagThis script is an advanced technical analysis indicator for the TradingView platform, written in Pine Script version 5. Its primary goal is to identify potential Elliott Wave "Wave 1" patterns, enhanced with principles from Neowave theory and a custom ZigZag indicator for more accurate pivot detection. The script is designed to be overlaid on the main price chart.
Core Functionality: Blending ZigZag and Neowave
The indicator's methodology is a two-part process. First, it identifies significant price swings using a robust ZigZag indicator. Then, it analyzes these swings based on a set of rules derived from Neowave and classic technical analysis to validate them as potential Wave 1 patterns.
Part 1: ZigZag Integration
The first major component is a comprehensive ZigZag indicator that forms the foundation for all subsequent analysis.
Pivot Detection: The pivots() function is the engine of the ZigZag. It scans the historical price data for significant high and low points (pivots) over a user-defined Length.
Segment Drawing: Once pivots are identified, the script draws lines connecting them, creating the classic ZigZag pattern on the chart.
Extended Direction & Ratios: This is an enhanced feature. The script doesn't just identify highs and lows; it categorizes them as:
Higher High (HH) or Lower High (LH)
Lower Low (LL) or Higher Low (HL)
This classification is crucial for understanding the market structure. It also calculates the price ratio of the most recent ZigZag leg relative to the previous one, which is used later for pattern validation.
Dynamic Updates: The ZigZag is not static. On each new bar, it can update its most recent pivot point if a new, more extreme price (a higher high or a lower low) is printed before the direction officially changes. This ensures the ZigZag is always reflecting the most current and significant price action.
Part 2: Neowave Wave 1 Finder
With the market structure defined by the ZigZag, the second part of the script applies a rigorous set of rules to identify potential Wave 1 patterns. A Wave 1 is the initial move of a new trend in Elliott Wave theory.
Key Validation Criteria
For a price move between two ZigZag pivots to be considered a valid Wave 1, it must pass a series of checks:
Significance: The move must have a minimum percentage change (Minimum Wave Length) and last for a minimum number of bars, filtering out insignificant noise.
Volume Confirmation: A genuine impulse wave is typically supported by increasing volume. The script checks if the volume during the potential Wave 1 is significantly higher than the recent average (Volume Increase Threshold).
Momentum Alignment: The direction of the wave must be confirmed by momentum indicators.
For a bullish (upward) Wave 1, the Relative Strength Index (RSI) must be in a bullish regime (above 50) and the MACD line must be above its signal line.
For a bearish (downward) Wave 1, the RSI must be below 50 and the MACD line must be below its signal line.
Structural Analysis (Impulse vs. Diagonal): The script attempts to differentiate between two types of Wave 1:
Impulse Wave: A strong, clean, and direct move.
Diagonal Wave: A more complex, overlapping, and often wedge-shaped pattern. This is identified by analyzing the time and price complexity of the move, along with the ZigZag leg ratios.
Wave 2 Retracement Check: A critical Neowave rule is that a valid Wave 1 must be followed by a valid Wave 2 retracement. The script looks at the next ZigZag leg to ensure it doesn't retrace more than 100% of the potential Wave 1. It also uses the ZigZag ratios to confirm the retracement falls within typical Fibonacci levels (e.g., 38.2% to 78.6%).
Display and User Interface
The script provides a rich visual experience to aid the trader in their analysis.
Wave Labels and Boxes: When a valid Wave 1 is detected, it is highlighted with a colored line (green for bullish, red for bearish) and a shaded background box. A label clearly marks it as "Wave 1 IMPULSE" or "Wave 1 DIAGONAL".
Fibonacci Retracement Levels: Upon detection of a Wave 1, the script automatically draws key Fibonacci retracement levels (38.2%, 50%, 61.8%, 78.6%). These levels are potential targets for the end of the subsequent Wave 2, offering potential entry points for a Wave 3 trade.
Information Labels: Additional labels provide at-a-glance confirmation of the conditions, showing whether volume and momentum criteria were met.
Customizable Inputs: Users have extensive control over the indicator's parameters, including the ZigZag length, volume thresholds, RSI levels, and the colors of all visual elements.
Alerts: The indicator can be configured to generate an alert whenever a new bullish or bearish Wave 1 pattern is confirmed, allowing traders to be notified of potential opportunities in real-time.

Mongoose Capital: BTC ETF DriftScope ProMongoose Capital: BTC ETF DriftScope Pro
A proprietary indicator for monitoring drift between Bitcoin Spot (BTCUSD) and Bitcoin Spot ETFs (such as IBIT). Designed to detect ETF premium/discount zones and generate actionable Fade or Long bias signals.
What it Does
Tracks IBIT and BTCUSD spread to highlight ETF price deviations.
Calculates correlation Z-Score for ETF/Spot alignment.
Outputs numeric bias signals: Fade (1), Long (1), Neutral (1).
How to Use
Apply to a BTCUSD chart (4H, 1D, or higher recommended).
Open the Data Window to view:
IBIT Spread %
Correlation Z-Score
Correlation %
Bias Flags (Fade, Long, Neutral)
Configure alerts for Fade and Long Bias conditions.
Confirm all signals with your trade plan and risk management.
Methodology
This tool calculates the percentage spread between IBIT and BTC Spot. A rolling Z-Score of the correlation is used to detect periods of significant divergence.
Fade Bias suggests potential short setups in premium zones with high Z-Scores.
Long Bias suggests potential long setups in discount zones with low Z-Scores.
Disclaimer
This indicator is for educational purposes only. It is not financial advice. Use at your own risk and verify signals independently.

Universal Trade Levels & Signal Classifierscript has been enhanced and generalized for all instruments — not just ES or SPX.
You now get the following classifications:
💎 Perfect Trade – trend confirmed, strong signal, ATR + VWAP + volume aligned
🚀 Sure Shot Trade – very high volume + ATR breakout + directional bias
⚡ Quick Call/Put – fast actionable setups
❌ No Trade – avoid/no confirmation
The logic works across any timeframe and any ticker.
You can now test this live on any instrument in TradingView. Let me know if you’d like to add things like:
Multi-timeframe confirmation
Re-entry logic
Heatmap table of confidence levels
Signal filtering based on RSI, OBV, etc.

Aggregated VolumeHow to Read the “Aggregated Volume” Signal
This indicator combines normalized volume, short-term volume bursts, pivot levels, VWAP, and a 200-period EMA to give you a multi-dimensional view of trading activity. Here’s how to interpret each component and synthesize them into actionable insights.
1. Custom Volume Signal (vSignal)
• Calculation
• vSignal = Sum of over bars, divided by the current price.
• A rising vSignal means more volume is being traded per unit of price, signaling growing interest relative to price level.
• Plot styling
• Bars are lime when (bullish volume days)
• Bars are orange when (bearish volume days)
How to read it
• Trend confirmation: Increasing lime bars alongside rising price suggests buyers in control.
• Warning sign: Rising orange bars on a down move indicate accelerating selling pressure.
• Divergence:
• Price making new highs while vSignal stalls or drops → potential top.
• Price making new lows while vSignal holds → potential bottom.
2. Short-Term Volume Bursts
Three semi-transparent histograms show how much the last 2, 5, and 10-bar raw volumes exceed (or fall below) the current vSignal:
• Blue = vol(2) – vSignal
• Green = vol(5) – vSignal
• Red = vol(10) – vSignal
If a colored bar sits above zero, that lookback’s volume is surging relative to the longer-term average (vSignal).
How to read it
• Clustered bursts:
• Blue + Green + Red above zero → strong, broad-based volume surge.
• Great for confirming breakouts and shakeouts.
• Isolated burst:
• Only Blue (> 0) on a small range bar → might be a false breakout or intrabar squeeze.
• Only Red (> 0) on a wide range → institutional involvement; act with caution.
3. Pivot Volume Levels (v & t)
• Every 21 bars, the script finds the highest and lowest vSignal values and plots them as shaded price levels:
• Magenta area = recent vSignal high (resistance)
• Cyan area = recent vSignal low (support)
How to read it
• Rejection/Break:
• Price approaches magenta zone and stalls → sellers defending that volume high.
• Break above magenta with high vSignal → likely sustained rally.
• Support flip:
• Cyan zone hold → buyers stepping in at heavy-volume lows.
• Break below cyan with rising vSignal → bearish conviction.
4. Midline Cross (Volume Equilibrium)
• A 10-bar SMA of
• Drawn as a faint white cross on price
How to read it
• Above midline → overall volume bias is skewed bullish.
• Below midline → bearish volume bias.
Crossovers of vSignal through this midline can signal shifts in underlying conviction.
5. VWAP & 200-Period EMA Overlays
• VWAP (transparent red if above price, green if below)
• EMA(200) plotted as aqua circles
How to read them
• VWAP tells you the intraday “value area.”
• Price above VWAP + rising vSignal = intraday buyers in charge.
• Price below VWAP + rising vSignal = aggressive sellers.
• EMA(200) gives you the longer-term trend.
• Above EMA200 = bullish regime
• Below EMA200 = bearish regime
6. Putting It All Together: Example Scenarios
1. Bullish Entry
• Price > EMA200 & VWAP is green
• vSignal rising in lime
• All three short-term bursts above zero
• Price near or breaking the magenta pivot with volume confirmation
2. Bearish Entry
• Price < EMA200 & VWAP is red
• vSignal rising in orange
• Two-bar burst (blue) spikes on a down bar
• Price failing at magenta pivot or breaking cyan support
3. Divergence Play
• Price makes new high, but vSignal peaks lower than last high → look for a reversal.
• Price drops to new low, but vSignal stays above its last low → prepare for a bounce.
By combining these layers—normalized volume, burst indicators, pivot levels, VWAP, and EMA—you get a clear map of where volume is clustering, which lets you anticipate support/resistance, gauge real interest, and spot potential reversals or breakouts with greater confidence.

Auto LevelsSimple auto level tracker that automatically detects and plots the high/low for the current week, day, and month, as well as the previous week/day/month.
Includes a built-in dashboard that shows how close or far price is from each level, along with directional guidance (above/below). The closest level to current price is automatically highlighted for quick awareness.
Everything is fully toggleable to only show the levels and info that is needed.

BUY in HASH RibbonsBUY in HASH Ribbons Indicator
The BUY in HASH Ribbons indicator is designed to identify Bitcoin miner capitulation phases, often referred to as "Springs," using hash rate data. These phases signal potential buying opportunities with historically low downside risk. Built for TradingView with Pine Script v6, it visualizes hash rate trends and generates actionable signals for traders.
Key Features
Hash Ribbons Analysis: Tracks Bitcoin miner capitulation through the relationship between short-term (30-day) and long-term (60-day) Simple Moving Averages (SMAs) of the hash rate.
Signal Visualization:
Gray Circle: Marks the start of capitulation (30-day SMA crosses below 60-day SMA).
White Circles: Indicate ongoing capitulation, with brighter white showing hash rate recovery (increasing short SMA).
Yellow Circle: Signals the end of capitulation (30-day SMA crosses above 60-day SMA).
Orange Circle: Represents a buy signal after full recovery, combining hash rate and price momentum for optimal entry.
Flexible Display:
Ribbons Mode: Plots the short and long SMAs as colored ribbons (red for capitulation, green for recovery).
Oscillator Mode: Shows the percentage difference between short and long SMAs as a histogram (red for negative, blue for positive).
Halving Events: Optionally plots Bitcoin halving dates with dashed lines and labels for context (2012, 2016, 2020, 2024).
Raw Hash Rate: Option to display raw hash rate data in EH/s (exahashes per second).
Alerts: Configurable alerts for capitulation, recovery, and buy signals.
How It Works
The indicator uses hash rate data from external sources (e.g., IntoTheBlock or Quandl) to calculate SMAs. Capitulation occurs when miners reduce activity, often during price declines, causing the short-term SMA to fall below the long-term SMA. Recovery is detected as the short-term SMA begins to rise, and a buy signal is generated when the hash rate recovers alongside bullish price action (10-day SMA crossing above 20-day SMA).
Inputs
Plot Type: Choose between "Ribbons" or "Oscillator" display.
Hash Rate Short SMA: Default 30 days, adjustable.
Hash Rate Long SMA: Default 60 days, adjustable.
Plot Signals: Enable/disable signal circles (capitulation, recovery, buy).
Plot Halvings: Show/hide Bitcoin halving events.
Plot Raw Hash Rate: Display raw hash rate data.
Source Hash Rate: Select data provider (e.g., IntoTheBlock or Quandl).
Why Use It?
Proven Strategy: Hash Ribbons, popularized by Capriole Investments, have historically identified strong Bitcoin buying opportunities post-capitulation.
Customizable: Tailor the indicator to your trading style with adjustable SMAs and display options.
Contextual Insight: Halving markers provide additional market context, as miner dynamics often shift post-halving.
Real-Time Alerts: Stay informed with alerts for key events, ideal for active traders.
Usage Notes
Timeframe: Best used on daily charts for accurate hash rate and price SMA calculations.
Data Sources: Ensure the selected hash rate source is reliable; IntoTheBlock is the default for consistency.
Risk Management: Combine with other indicators (e.g., RSI, MACD) and fundamental analysis for robust trading decisions.
Backtesting: Test the indicator on historical data to understand its performance in different market cycles.
Credits
Developed by Trader T (@thepfund). Inspired by the Hash Ribbons concept from Capriole Investments.
This indicator empowers traders to capitalize on Bitcoin’s miner-driven market cycles with clear, data-driven signals. Add it to your TradingView chart and start identifying high-probability entries today!

NY Open Breakout [ATR-5000]# **New York Open Breakout Indicator **
## **📌 Overview**
This **Pine Script** indicator identifies high-probability breakout opportunities at the **New York market open (13:30 UTC)** based on **volatility filters** using **customizable ATR periods and thresholds**.
### **🔹 Key Features**
✅ **Fully Customizable ATR Periods** (2 to **5000** bars)
✅ **Adjustable Thresholds** (0.01% to 5.00%)
✅ **Opening Range (OR) Filter** (0.01% to 5.00%)
✅ **Clean Visuals** – Only highlights the **13:30 UTC candle** when conditions are met
✅ **Real-Time Info Panel** – Displays current ATR & threshold settings
✅ **Automatic Daily Reset** – Fresh signals every trading day
---
## **📊 How It Works**
### **1️⃣ Volatility Check (13:25 UTC)**
- Calculates **two ATR values** (user-defined periods)
- Compares them against **custom % thresholds**
- Only proceeds if **both ATRs exceed** their required volatility levels
### **2️⃣ Opening Range Confirmation (13:30 UTC)**
- Measures the **high-low range** of the 13:30 candle
- Validates if the range meets the **minimum % threshold**
- If all conditions pass → **Highlights the candle** in your chosen color
### **3️⃣ Visual Feedback**
- **🟣 Colored Candle** → Valid breakout signal
- **📊 Info Table** → Shows current ATR settings & thresholds
---
## **⚙️ Customization Options**
| **Setting** | **Default** | **Adjustable Range** |
|---------------------------|------------|----------------------|
| **First ATR Period** | 14 | **2–5000** bars |
| **Second ATR Period** | 161 | **2–5000** bars |
| **First ATR Threshold** | 0.42% | **0.01%–5.00%** |
| **Second ATR Threshold** | 0.40% | **0.01%–5.00%** |
| **OR Range Threshold** | 0.42% | **0.01%–5.00%** |
| **Candle Color** | Purple | **Any color** |
---
## **📈 Best Use Cases**
✔ **Forex (EURUSD, GBPUSD)** – Captures NY session momentum
✔ **Indices (SPX, NASDAQ)** – Works well with opening volatility
✔ **Commodities (Gold, Oil)** – Filters out low-energy days
---
## **🔧 How to Adjust Settings**
1. **Click the gear icon (⚙️)** on your TradingView chart
2. **Modify ATR periods & thresholds** as needed
3. **Change the candle color** for better visibility
---
## **🚀 Why This Indicator?**
- **No repainting** – Signals lock in after candle close
- **No clutter** – Only marks valid 13:30 candles
- **Adaptable** – Works on **any market & timeframe**
- **Fully automated** – No manual adjustments needed
---
### **📥 Apply & Start Trading!**
Simply **load the script** on TradingView and customize it to fit your strategy! 🚀

CRT + PO3 Range Theory Hey everyone, I’ve put together a little script for TradingView that tries to show the classic CRT + PO3 (Power of Three) pattern. It’s still a work in progress, so please use it on a demo account and let me know what you think!
What It Does
Accumulation Phase: On each higher‐timeframe bar (e.g. 2-hour), it draws a shaded zone where price is hanging out. That’s when we assume “big players” are quietly building positions.
Manipulation Phase: If price briefly pokes above or below that zone but then slips back inside, it marks that wick as a shake-out.
Distribution Phase: When price finally closes cleanly outside the zone, it draws another shaded area and drops a “Distribution” label plus a big LONG or SHORT arrow on that bar.
You can tweak it so it only shows signals when a bar closes (no more weird flashing mid-bar), or even allow “direct” Distribution on a clean breakout without waiting for a fake wick first.
How to Set It Up
Add the script from your Indicators list.
Pick your HTF (I like 2-hour or 4-hour).
Turn “Show Zone Labels” on or off—these are the little “Accumulation/Manipulation/Distribution” tags.
Turn “Show Entry Signals” on to get the big LONG/SHORT arrows.
If you hate flicker, check “Show signals only at bar close.”
If you want to catch a swift breakout (no fake-out needed), check “Allow direct Distribution on clean breakout.”
There are also sliders for zone colors, transparency, label size, and how far above/below the bars the labels sit.
Why It’s Still a Beta
I’m not a CRT/PO3 guru—this is more of a hobby project and a little facination for this strategy.
There might be edge cases where it misses a shake-out or flags a Distribution too early.
I take no responsibility for your trades—please only run it on a demo account until we’ve worked out the quirks.
Feedback Wanted!
If you try it out, I’d love to hear:
Did the Manipulation wicks line up where you expected?
Were the Distribution arrows on the right bars?
Any ideas for easier settings or extra alerts?
Thanks for testing and helping me turn this into something solid!


Profit Sniper RSI Based Buy/Sell📌 Profit Sniper RSI – Intelligent Buy/Sell Signals Based on Adaptive RSI Zones
Profit Sniper RSI is a precision-engineered indicator that generates high-confidence Buy and Sell signals by dynamically interpreting the Relative Strength Index (RSI) across five market zones. It is designed to reduce signal noise and avoid false breakouts using a combination of crossover logic, zone validation, and trend sentiment detection.
🔍 Underlying Concept:
This script divides the RSI into five structured zones:
- **0–24**: Power Sell (Extreme bearish momentum)
- **24–40**: Sell (Weak price action with downward pressure)
- **40–60**: Neutral/Consolidation (No clear trend)
- **60–76**: Buy (Bullish initiation zone)
- **76–100**: Power Buy (Strong bullish momentum)
Signals are generated **only after the RSI crosses a zone boundary** (e.g., from below 60 to above 60), and only **after the candle closes**, which helps filter out noise from intra-bar RSI fluctuations.
📈 Signal Logic:
- **Buy signals** are triggered when RSI crosses key thresholds (24, 40, or 60) upward, indicating rising strength.
- **Sell signals** are triggered when RSI crosses downward below 76, 60, or 40, suggesting trend weakness or reversal.
- **Power Buy and Power Sell signals** are reserved for extreme crossovers beyond 76 and below 24, respectively.
- The script avoids repeated signals (e.g., Buy after Buy) by tracking the last confirmed signal state.
🔧 Customization:
- Users can toggle visibility of Buy, Sell, Power Buy, and Power Sell signals independently.
- Adjustable RSI length input to fit different market conditions or timeframes.
- Displays a real-time info panel showing the current RSI, last signal type, the RSI level at the time of the last signal, and the price when the signal was triggered.
🧠 How It Helps Traders:
- Reduces false entries by only generating signals **after candle closure**.
- Designed to work across **any timeframe** and **any market** (Crypto, Forex, Stocks).
- Ideal for traders who rely on **RSI-based confirmation** before entry and prefer minimal visual clutter.
- Acts as a sniper tool — waiting for clear RSI structure and crossover before acting.
⚠️ Note:
This script does **not repaint**. All signals are based on closed-bar RSI logic. While no indicator guarantees profitability, this tool is built for serious traders who value disciplined entries backed by momentum structure.
💡 Tip: Combine Profit Sniper RSI with key support/resistance or trendline zones for added confluence and trade precision.

Ultra Supply & DemandUltra Supply and Demand fixed.
Order Block Detection: Identifies potential order blocks (demand/supply zones)
