Indicators and strategies

RSI(14) Custom by ChadRSI 14 : this indicator works in low time frame like 1h and 4h, for entry long position and short position. when the line touch 70 mean the price is overbought, when the line touch 50 it"s neutral, and when the line touch 30 mean price is oversold.

2Saucy custom MA'sEMA's 9/21/50/200 - Designated for "scalping" 1m/3m/5m/15/1h/4h. Works best as it EMA's move faster with price.
SMA's 10/20/50/200 - Works more for swing trading and/or finding setups on weekly and daily time frames.
By combining these two simultaneously trading intra-day is made much simpler.
Yours truly,
#2Saucy

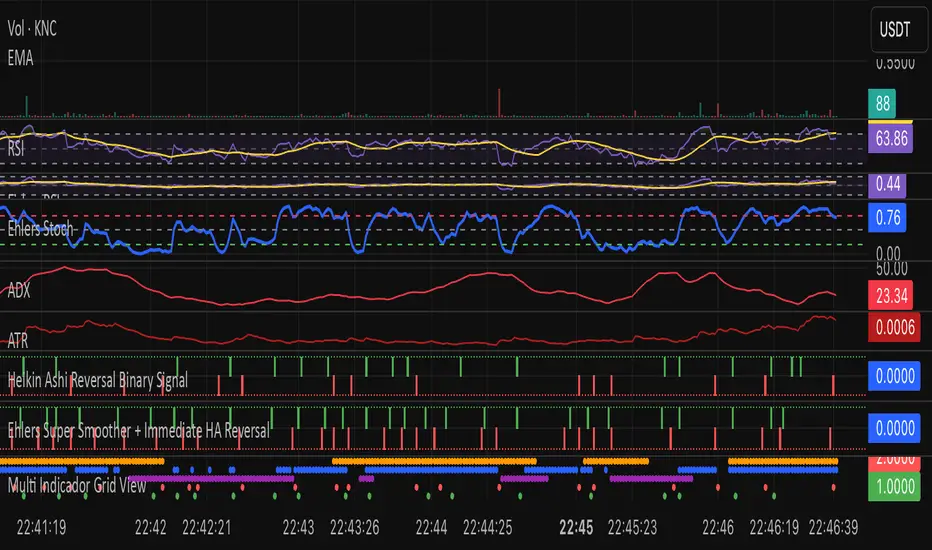
Ehlers Two-Pole StochasticThis indicator implements John Ehlers' Two-Pole Stochastic Filter, a smoother alternative to the traditional stochastic oscillator. Instead of relying on raw %K values, it applies a second-order IIR filter (recursive smoothing) to reduce noise and improve trend clarity.
It outputs a single line oscillating between 0 and 1, with less lag and false signals compared to standard stochastic implementations.
Key Features:
Uses a two-pole filter to smooth the normalized stochastic (%K).
Ideal for detecting clean reversals and trend continuations.
Designed for minimal visual noise and greater signal confidence.
Interpretation:
Values near 1.0 may suggest overbought conditions.
Values near 0.0 may suggest oversold conditions.
Crosses above 0.5 can signal bullish shifts, and below 0.5 bearish shifts.
Recommended Settings:
Default smoothing factor (alpha) is 0.7 — higher values make the output more responsive, while lower values smooth further.
Inspired by concepts from Cybernetic Analysis for Stocks and Futures by John F. Ehlers.
Dynamic SL/TP Levels (ATR or Fixed %)This indicator, "Dynamic SL/TP Levels (ATR or Fixed %)", is designed to help traders visualize potential stop loss (SL) and take profit (TP) levels for both long and short positions, refreshing dynamically on each new bar. It assumes entry at the current bar's close price and uses a fixed 1:2 risk-reward ratio (TP is twice the distance of SL in the profit direction). Levels are displayed in a compact table in the chart pane for easy reference, without cluttering the main chart with lines.
Key Features:
Calculation Modes:
ATR-Based (Dynamic): SL distance is derived from the Average True Range (ATR) multiplied by a user-defined factor (default 1.5x). This adapts to the asset's volatility, providing breathing room based on recent price movements.
Fixed Percentage: SL is set as a direct percentage of the current close price (default 0.5%), offering consistent gaps regardless of volatility.
Long and Short Support: Calculates and shows SL/TP for longs (SL below close, TP above) and shorts (SL above close, TP below), with toggles to hide/show each.
Real-Time Updates: Levels recalculate every bar, making them readily available for entry decisions in your trading system.
Display: Outputs to a table in the top-right pane, showing precise values formatted to the asset's tick size (e.g., full decimal places for crypto).
How to Use:
Add the indicator to your chart via TradingView's Pine Editor or library.
Adjust settings:
Toggle "Use ATR?" on/off to switch modes.
Set "ATR Length" (default 14) and "ATR Multiplier for SL" for dynamic mode.
Set "Fixed SL %" for percentage mode.
Enable/disable "Show Long Levels" or "Show Short Levels" as needed.
Interpret the table: Use the displayed SL/TP values when your strategy signals an entry. For risk management, combine with position sizing (e.g., risk 1% of account per trade based on SL distance).
Example: On a volatile asset like BTC, ATR mode might set a wider SL for realism; on stable pairs, fixed % ensures predictability.
This tool promotes disciplined trading by tying levels to price action or fixed rules, but it's not financial advice—always backtest and use with your full strategy. Feedback welcome!

Nadaraya,poly100,MA ribbon,volume nến,RSInadaraya
polynomial 100
volume nến
rsi break out 75,25
MA Ribbon

Alt Szn Oracle - Institutional GradeThe Alt Szn Oracle is a macro-level indicator built to help traders front-run altseason by tracking liquidity, dominance rotation, sentiment, and capital flows—all in one signal. It’s designed for those who don’t just chase pumps, but want to understand when the tide is turning and why. This tool doesn't predict specific coin breakouts—it tells you when the market as a whole is gearing up to rotate into higher beta assets like altcoins, including memes and microcaps.
The index consolidates ten macro inputs into a normalized, smoothed score from 0–100. These include Bitcoin and Ethereum dominance, ETH/BTC, altcoin market cap (Total3), relative volume flows, and stablecoin supply (USDT, USDC, DAI)—which act as proxies for risk-on appetite and dry powder entering the system. It also incorporates manually updated sentiment metrics from Google Trends and the Fear & Greed Index, giving it a behavioral edge that most indicators lack.
The logic is simple but powerful: when BTC dominance is falling, ETH/BTC is rising, altcoin volume increases relative to BTC/ETH, and stablecoins start moving—you're likely in the early innings of rotation. The index is also filtered through a volatility threshold and smoothed with an EMA to eliminate chop and fakeouts.
Use this indicator on macro charts like TOTAL3, TOTAL2, or ETHBTC to gauge market health, or overlay it on specific coins like PEPE, DOGE, or SOL to confirm if the tide is in your favor. Interpreting the score is straightforward: readings above 80 suggest euphoria and signal it’s time to de-risk, 60–80 indicates expansion and confirms altseason is underway, 40–60 is neutral, and 20–40 is a capitulation zone where smart money accumulates.
What sets this apart is that it doesn’t just track price—it reflects the flow of capital, the positioning of liquidity, and the sentiment of the crowd. Most altseason indicators are lagging, overfitted, or too simplistic. This one is modular, forward-looking, and grounded in real capital rotation theory.
If you're a trader who wants to time the cycle, not guess it, this is your tool. Refine it, fork it, or expand it to your niche—DeFi, NFTs, meme coins, or L1s. It’s a framework for reading the macro winds, not a signal service. Use it with discipline, and you’ll catch the wave while others drown in noise.

EMA Reclaim Alert - FVG StrategyThis script identifies momentum-based trend reclaims using two Exponential Moving Averages (EMAs), and plots entry, stop-loss, and take-profit levels for trade signals. It also highlights potential fakeouts.

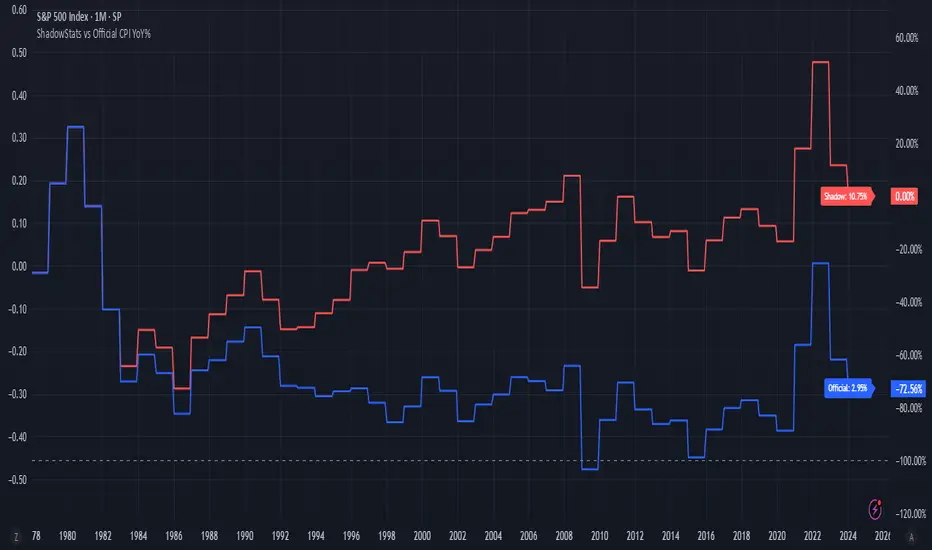
ShadowStats vs Official CPI YoY%This chart visualizes and compares the year-over-year (YoY) percentage change in the Consumer Price Index (CPI) as calculated by the U.S. government versus the alternative methodology used by ShadowStats, which reflects pre-1980 inflation measurement techniques. The red line represents ShadowStats' CPI YoY% estimates, while the blue line shows the official CPI YoY% reported by government sources. This side-by-side view highlights the divergence in reported inflation rates over time, particularly from the 1980s onward, offering a visual representation of how different calculation methods can lead to vastly different interpretations of inflation and purchasing power loss.
Dual MACD + TSI [CryptoSmart] by IgnotusA sophisticated dual momentum indicator combining a custom MACD Histogram with Divergence Detection and a TSI (True Strength Index) oscillator, designed for advanced technical analysis in crypto and other fast-moving markets.
---
🔍 Key Features:
- Custom MACD Histogram (MACD 1):
- Configurable fast/slow lengths and signal smoothing method (EMA/SMA).
- Advanced divergence detection (Regular & Hidden Bullish/Bearish patterns).
- Visual alerts and labels directly on the chart.
- Built-in divergence alerts for easy integration with TradingView alerts.
- TSI Oscillator (MACD 2):
- True Strength Index with customizable fast/slow periods and signal line smoothing.
- Overbought/oversold levels and optional background shading for quick visual cues.
- Fully optional elements (TSI Line, Signal Line, OB/OS levels) – disabled by default for clean charting.
- User-Friendly Design:
- Optional components can be toggled on/off via the settings panel.
- Works great as a standalone momentum filter or as part of a multi-indicator dashboard.
---
📈 How to Use:
- Use the MACD Histogram divergences to spot potential reversals.
- Combine with the TSI oscillator to confirm trend strength or detect overextended moves.
- Enable/disable components to avoid clutter and focus on what matters most.
---
Crafted for traders who want precision, flexibility, and visual clarity in their charts. Whether you're scalping or swing trading, this indicator helps you stay ahead of the curve.
---
Feel free to tweak the values and customize it to your strategy. Happy trading!

GOLD Auto-Alert Strategy [Enhanced+Signals]1M scalping Indicator , Always take trade above adx 25 and take trades after signal only after the crossing lies. use RSI for over bought and over sold confirmation

Volumatic + Adaptive Trend Flow [Fusion] by Ignotus📌 Description
```
This script combines two public open source indicators available on TradingView:
1. Volumatic Variable Index Dynamic Average
© BigBeluga
License: Creative Commons Attribution-NonCommercial-ShareAlike 4.0 International https:creativecommons.org/licenses/by-nc-sa/4.0/
Original link:
2. Adaptive Trend Flow
© QuantAlgo
License: Mozilla Public License 2.0 (MPL-2.0)
https:mozilla.org/MPL/2.0/
Original link:
This indicator merges both scripts without modifying their internal logic, maintaining all their functionality, settings, and alerts.
This work is a custom compilation for educational and analytical purposes, complying with the attribution and redistribution terms of both licenses.
I do not claim to be the author of the original code for either indicator.
⚠️ Note on the CC BY-NC-SA license:
The license for the first indicator prohibits commercial use without explicit permission.
Therefore, this script should not be used for commercial purposes without the authorization of the original creator (BigBeluga).
```
---
✅ What does this indicator include?
This indicator combines two powerful tools in a single script:
🔹 Volumatic Variable Index Dynamic Average
- Volume and trend-based indicator.
- Detects liquidity zones and dynamic support/resistance.
- Uses VIDYA (Variable Index Dynamic Average) along with ATR to identify trend changes.
- Includes visual volume signals, dynamic support/resistance lines, and smart labels.
🔹 Adaptive Trend Flow
- Adaptive indicator for market volatility.
- Identifies bullish and bearish trends using calculations based on EMAs and standard deviation.
- Includes candle color, dynamic background, entry/exit signals, and built-in alerts.
---
🛡️ Responsible Use
- This indicator is NOT designed for automatic trading and does not guarantee profits.
- It is recommended to use it as a technical analysis tool, always under your own supervision and discretion.
- Do not use this script for commercial purposes or on external platforms without the explicit consent of the original authors.
---
📣 Credits
- Creator of the combined indicator: Ignotus
- Original source of the indicators: TradingView
- Final result license: MPL-2.0 (except where otherwise indicated by copyright of the original author)

Chiaroscuro Scalp Model A [Signal + Visuals]This indicator is based on the Chiaroscuro Scalp Model A — a precision-based scalping system that identifies high-probability trade setups during the London and New York sessions. It combines daily range expansion, order blocks, fair value gaps, and W/M reversal patterns to generate 20-pip scalping opportunities with clearly plotted stop loss and take profit levels. Ideal for intraday traders seeking structured, rule-based entries.


SMA Fecho na Máxima, Mínima e NormalLarry Williams' Strategy - Short Moving Average Channel
✅ Indicators used:
High SMA: 3 periods
Low SMA: 3 periods
30-period Closing SMA: used as a trend filter

Aurum‑CME Harmonic Scanner (v2)Aurum harmonics. Patterns for pro traders looking fast leg of structures


Williams x Briese Hybrid CoT IndexAfter studying the below CoT (Commitments of Traders) books from ICT's recommended library, I learned that both Larry Williams and Stephen Briese use the same formula for their CoT Index:
COT Index = ((Current Net Position - Lowest Net Position) / (Highest Net Position - Lowest Net Position)) * 100 using a 3-Year lookback period.
Books:
Trade Stocks and Commodities with the Insiders: Secrets of the COT Report by Larry Williams
The Commitments of Traders Bible: How To Profit from Insider Market Intelligence by Stephen Briese
Williams and Briese differ in their plotting of the CoT Index formula in the following ways:
Williams uses a line plot, with thresholds at 25% & 75%
Briese uses a histogram plot, with thresholds at 5% & 90%
I decided to make a "hybrid" indicator of their CoT Index by using Larry Williams' classic line plot instead of a histogram, but with Briese's stricter thresholds of 5% and 95%.
The code is a bit of a remix of the "ICT Commitment of Traders°" indicator by toodegrees and is meant for use in a new pane below a Weekly Chart .
You can complement your usage of this indicator with another indicator I've published as shown in the chart above: Briese CoT Movement Index , which you can find on my scripts page. For proper usage, refer to The Commitments of Traders Bible and Trade Stocks and Commodities with the Insiders
As it is, this indicator incorporates the ±40 point "surge" from the Briese CoT Movement Index indicator in the form of labels that are visible above a below the 100% and 0% levels. The green labels at the top indicate buying surges >=40 while the black labels at the bottom indicate selling surges <=-40. If you hover over these labels, you'll see the tooltip for the value of the Movement Index. Again, if you complement this Williams x Briese Hybrid CoT Index with the Briese CoT Movement Index , you'll see the labels from the index align with the points on the histogram which exceed the ±40 levels.

Institutional Sweep Zone (Range-Based)Institutional Sweep Zone (Range-Based)
This indicator models potential stop sweep zones based on institutional capital ranges, helping traders visualize where high-probability liquidity grabs are likely to occur.
Unlike traditional volatility bands, this tool estimates price movement by calculating how far a specific amount of capital—entered into the market—can push price. By defining a lower and upper capital range (in millions of USD), the indicator dynamically draws bands representing the distance institutions could realistically move price in either direction.
It supports directional control, allowing you to focus on long sweeps, short sweeps, or both simultaneously. The pip cost is auto-calibrated based on the selected currency pair, making it highly adaptive to major FX pairs.
Key Features:
-Capital input range (in millions of USD)
-Directional sweep targeting: Long, Short, or Both
-Auto-detection of pip value based on FX pair
-Visual sweep zone mapped above and below current price
-Designed to highlight areas of institutional stop hunts
Why use it?
-Helps avoid setting stops inside common sweep zones
-Improves trade survivability when paired with higher timeframe strategies
-Offers a unique way to view price through an institutional lens
Created by: The_Forex_Steward
Explore more advanced tools and concepts on my TradingView profile.

Consolidation Zones - Working (v5)Updated from v4 to v5
need to write and entry strategy for breakouts

Briese CoT Movement IndexThis Briese CoT (Commitments of Traders) Movement Index histogram indicator was built based on the formula by Stephen Briese in his book "The Commitments of Traders Bible":
"...difference between the COT Index and its reading of one or several weeks prior. I use six." —Chapter 7, page 75.
The code is a bit of a remix of the "ICT Commitment of Traders°" indicator by toodegrees and is meant for use in a new pane below a Weekly Chart .
The upper and lower thresholds are +40/-40. Some context: "A ± 40 point surge in the COT Index within a six-week period frequently marks the end of a counter-trend price reaction"
40 Point CoT Surge Rules (Commercials) from page 76
"During a correction from a prevailing uptrend, a +40 point movement in the CoT Index within a six-week period often marks the end of a corrective pullback, and the resumption of the major uptrend."
"During a reaction in a prevailing downtrend, a -40 point movement in the CoT Index within a six-week period frequently marks the end of a price reaction, and the resumption of the established downtrend."
"The failure of a ± point CoT Movement Index signal to restart the prevailing trend is a tip-off to a major trend change"
I'd recommend reading Briese's book for examples on how to properly interpret this indictor.
This indicator can be used in conjunction with another one I've published called the "Williams x Briese Hybrid CoT Index" which can be found on my scripts page.

Average Dollar VolumeSimply displays the average daily dollar volume in the top right corner of the chart.

Chiaroscuro Scalp Model A [Signal + Visuals]This indicator is based on the Chiaroscuro Scalp Model A — a precision-based scalping system that identifies high-probability trade setups during the London and New York sessions. It combines daily range expansion, order blocks, fair value gaps, and W/M reversal patterns to generate 20-pip scalping opportunities with clearly plotted stop loss and take profit levels. Ideal for intraday traders seeking structured, rule-based entries.
