Range Bar Gaps DetectorRange Bar Gaps Detector
Overview
The Range Bar Gaps Detector identifies price gaps across multiple range bar sizes (12, 24, 60, and 120) on any trading instrument, helping traders spot potential support/resistance zones or breakout opportunities. Designed for Pine Script v6, this indicator detects gaps on range bars and exports data for use in companion scripts like Range Bar Gaps Overlap, making it ideal for multi-timeframe gap analysis.
Key Features
Multi-Range Gap Detection: Identifies gaps on 12, 24, 60, and 120-range bars, capturing both bullish (gap up) and bearish (gap down) price movements.
Customizable Sensitivity: Includes a user-defined minimum deviation (default: 10% of 14-period SMA) for 12-range gaps to filter out noise.
7-Day Lookback: Automatically prunes gaps older than 7 days to focus on recent, relevant price levels.
Data Export: Serializes up to 10 gaps per range (tops, bottoms, start bars, highest/lowest prices, and age) for seamless integration with overlap analysis scripts.
Debugging Support: Plots gap counts and aggregation data in the Data Window for easy verification of detected gaps.
How It Works
The indicator aggregates price movements to simulate higher range bars (24, 60, 120) from a base range bar chart. It detects gaps when the price jumps significantly between bars, ensuring gaps meet the minimum deviation threshold for 12-range bars. Gaps are stored in arrays, serialized for external use, and pruned after 7 days to maintain efficiency.
Usage
Add to your range bar chart (e.g., 12-range) to detect gaps across multiple ranges.
Use alongside the Range Bar Gaps Overlap indicator to visualize gaps and their overlaps as boxes on the chart.
Check the Data Window to confirm gap counts and sizes for each range (12, 24, 60, 120).
Adjust the "Minimal Deviation (%) for 12-Range" input to control gap detection sensitivity.
Settings
Minimal Deviation (%) for 12-Range: Set the minimum gap size for 12-range bars (default: 10% of 14-period SMA).
Range Sizes: Fixed at 24, 60, and 120 for higher range bar aggregation.
Notes
Ensure the script is published under your TradingView username (e.g., GreenArrow2005) for use with companion scripts.
Best used on range bar charts to maintain consistent gap detection.
For advanced overlap analysis, pair with the Range Bar Gaps Overlap indicator to highlight zones where gaps from different ranges align.
Ideal For
Traders seeking to identify key price levels for support/resistance or breakout strategies.
Multi-timeframe analysts combining gap data across various range bar sizes.
Developers building custom indicators that leverage gap data for advanced charting.
Indicators and strategies

Price x Vol RSIAn enhanced RSI indicator that integrates the RSI of volume as a conviction amplifier.
This script modifies the RSI to range from −1 to +1, allowing it to express directional momentum. Volume RSI remains in the range of 0 to +1, serving as a direction-neutral amplifier.
The result is a bi-directional composite RSI that:
>> Emphasizes congruent signals (e.g., strong price direction with strong volume).
>> Minimizes misleading signals from high volume paired with neutral or conflicting price movement.
Ideal for identifying high-conviction breakouts and momentum divergences with volume support.
the plot fill increases in color when the plot approaches zero, then reverses away from zero, and resets on a zero-cross.
check out my other script, the PXVS, which is what this RSI script was based on. it uses similar logic as this script, but with FSTO %K instead of RSI


CME Crude Oil 15-Min Multi-Unified Entry Zones (Dot Signals)//@version=6
indicator("CME Crude Oil 15-Min Multi-Unified Entry Zones (Dot Signals)", overlay=true)
// --- Input Parameters ---
emaLength = input.int(11, title="EMA Length", minval=1)
// Ichimoku Cloud Inputs (Adjusted for higher sensitivity)
conversionLineLength = input.int(7, title="Ichimoku Conversion Line Length (Sensitive)", minval=1)
baseLineLength = input.int(20, title="Ichimoku Base Line Length (Sensitive)", minval=1)
laggingSpanLength = input.int(40, title="Ichimoku Lagging Span Length (Sensitive)", minval=1)
displacement = input.int(26, title="Ichimoku Displacement", minval=1)
// MACD Inputs (Adjusted for higher sensitivity)
fastLength = input.int(9, title="MACD Fast Length (Sensitive)", minval=1)
slowLength = input.int(21, title="MACD Slow Length (Sensitive)", minval=1)
signalLength = input.int(6, title="MACD Signal Length (Sensitive)", minval=1)
// RSI Inputs
rsiLength = input.int(8, title="RSI Length", minval=1)
rsiOverbought = input.int(70, title="RSI Overbought Level", minval=50, maxval=90)
rsiOversold = input.int(30, title="RSI Oversold Level", minval=10, maxval=50)
// ADX Inputs
adxLength = input.int(14, title="ADX Length", minval=1)
adxTrendStrengthThreshold = input.int(20, title="ADX Trend Strength Threshold", minval=10, maxval=50)
// Weak Entry Threshold (50 ticks for Crude Oil, where 1 tick = $0.01)
// 50 ticks = $0.50
weakEntryTickThreshold = input.float(0.50, title="Weak Entry Threshold (in $)", minval=0.01)
// --- Indicator Calculations ---
// 1. EMA 11
ema11 = ta.ema(close, emaLength)
// 2. Ichimoku Cloud
donchian(len) => math.avg(ta.lowest(len), ta.highest(len))
tenkanSen = donchian(conversionLineLength)
kijunSen = donchian(baseLineLength)
senkouSpanA = math.avg(tenkanSen, kijunSen)
senkouSpanB = donchian(laggingSpanLength)
// Shifted for plotting (future projection)
senkouSpanA_plot = senkouSpanA
senkouSpanB_plot = senkouSpanB
// Chikou Span (lagging span, plotted 26 periods back)
chikouSpan = close
// 3. MACD
= ta.macd(close, fastLength, slowLength, signalLength)
// 4. RSI
rsi = ta.rsi(close, rsiLength)
// 5. ADX
= ta.dmi(adxLength, adxLength)
// --- Price Volume Pattern Logic ---
// Simplified volume confirmation:
isVolumeIncreasing = volume > volume
isVolumeDecreasing = volume < volume
isPriceUp = close > close
isPriceDown = close < close
bullishVolumeConfirmation = (isPriceUp and isVolumeIncreasing) or (isPriceDown and isVolumeDecreasing)
bearishVolumeConfirmation = (isPriceDown and isVolumeIncreasing) or (isPriceUp and isVolumeDecreasing)
// --- Daily Pivot Point Calculation (Critical Support/Resistance) ---
// Request daily High, Low, Close for pivot calculation
= request.security(syminfo.tickerid, "D", [high , low , close ])
// Classic Pivot Point Formula
dailyPP = (dailyHigh + dailyLow + dailyClose) / 3
dailyR1 = (2 * dailyPP) - dailyLow
dailyS1 = (2 * dailyPP) - dailyHigh
dailyR2 = dailyPP + (dailyHigh - dailyLow)
dailyS2 = dailyPP - (dailyHigh - dailyLow)
// --- Crosses and States for Unified Entry 1 (EMA & MACD) ---
// Moved ta.cross() calls outside of conditional blocks for consistent calculation.
emaGoldenCrossCondition = ta.cross(close, ema11)
emaDeathCrossCondition = ta.cross(ema11, close)
macdGoldenCrossCondition = ta.cross(macdLine, signalLine)
macdDeathCrossCondition = ta.cross(signalLine, macdLine)
emaIsBullish = close > ema11
emaIsBearish = close < ema11
macdIsBullishStrong = macdLine > signalLine and macdLine > 0
macdIsBearishStrong = macdLine < signalLine and macdLine < 0
// --- Unified Entry 1 Logic (EMA & MACD) ---
unifiedLongEntry1 = false
unifiedShortEntry1 = false
if (emaGoldenCrossCondition and macdIsBullishStrong )
unifiedLongEntry1 := true
else if (macdGoldenCrossCondition and emaIsBullish )
unifiedLongEntry1 := true
if (emaDeathCrossCondition and macdIsBearishStrong )
unifiedShortEntry1 := true
else if (macdDeathCrossCondition and emaIsBearish )
unifiedShortEntry1 := true
// --- Unified Entry 2 Logic (Ichimoku & EMA/Volume) ---
unifiedLongEntry2 = false
unifiedShortEntry2 = false
ichimokuCloudBullish = close > senkouSpanA_plot and close > senkouSpanB_plot and
senkouSpanA_plot > senkouSpanB_plot and
tenkanSen > kijunSen and
chikouSpan > close
ichimokuCloudBearish = close < senkouSpanA_plot and close < senkouSpanB_plot and
senkouSpanB_plot > senkouSpanA_plot and
tenkanSen < kijunSen and
chikouSpan < close
// Moved ta.cross() calls outside of conditional blocks for consistent calculation.
ichimokuBullishTriggerCondition = ta.cross(tenkanSen, kijunSen)
ichimokuBearishTriggerCondition = ta.cross(kijunSen, tenkanSen)
priceCrossAboveSenkouA = ta.cross(close, senkouSpanA_plot)
priceCrossBelowSenkouA = ta.cross(senkouSpanA_plot, close)
if (ichimokuBullishTriggerCondition or (priceCrossAboveSenkouA and close > senkouSpanB_plot)) and
emaIsBullish and
bullishVolumeConfirmation
unifiedLongEntry2 := true
if (ichimokuBearishTriggerCondition or (priceCrossBelowSenkouA and close < senkouSpanB_plot)) and
emaIsBearish and
bearishVolumeConfirmation
unifiedShortEntry2 := true
// --- Weak Entry Logic ---
weakLongEntry = false
weakShortEntry = false
// Function to check for weak long entry
// Checks if the distance to the nearest resistance (R1 or R2) is less than the threshold
f_isWeakLongEntry(currentPrice) =>
bool isWeak = false
// Check R1 if it's above current price and within threshold
if dailyR1 > currentPrice and (dailyR1 - currentPrice < weakEntryTickThreshold)
isWeak := true
// Check R2 if it's above current price and within threshold (only if not already weak by R1)
else if dailyR2 > currentPrice and (dailyR2 - currentPrice < weakEntryTickThreshold)
isWeak := true
isWeak
// Function to check for weak short entry
// Checks if the distance to the nearest support (S1 or S2) is less than the threshold
f_isWeakShortEntry(currentPrice) =>
bool isWeak = false
// Check S1 if it's below current price and within threshold
if dailyS1 < currentPrice and (currentPrice - dailyS1 < weakEntryTickThreshold)
isWeak := true
// Check S2 if it's below current price and within threshold (only if not already weak by S1)
else if dailyS2 < currentPrice and (currentPrice - dailyS2 < weakEntryTickThreshold)
isWeak := true
isWeak
// Apply weak entry check to Unified Entry 1
if unifiedLongEntry1 and f_isWeakLongEntry(close)
weakLongEntry := true
if unifiedShortEntry1 and f_isWeakShortEntry(close)
weakShortEntry := true
// Apply weak entry check to Unified Entry 2
if unifiedLongEntry2 and f_isWeakLongEntry(close)
weakLongEntry := true
if unifiedShortEntry2 and f_isWeakShortEntry(close)
weakShortEntry := true
// --- Enhanced Entry Conditions with RSI and ADX ---
// Removed candlestick pattern requirement.
// Only consider an entry if RSI is not overbought/oversold AND ADX indicates trend strength.
// Enhanced Long Entry Condition
enhancedLongEntry = (unifiedLongEntry1 or unifiedLongEntry2) and
(rsi < rsiOverbought) and // RSI not overbought
(adx > adxTrendStrengthThreshold) // ADX shows trend strength
// Enhanced Short Entry Condition
enhancedShortEntry = (unifiedShortEntry1 or unifiedShortEntry2) and
(rsi > rsiOversold) and // RSI not oversold
(adx > adxTrendStrengthThreshold) // ADX shows trend strength
// --- Define colors as variables for clarity and to potentially resolve parsing issues ---
// Changed named color constants to hexadecimal values
var color strongBuyDotColor = #FFD700 // Gold
var color weakBuyDotColor = #008000 // Green
var color strongSellDotColor = #FFFFFF // White
var color weakSellDotColor = #FF0000 // Red
// --- Plotting Entry Dots on Candlesticks ---
// Define conditions for plotting only on the *first* occurrence of a signal
isNewStrongBuy = enhancedLongEntry and not weakLongEntry and not (enhancedLongEntry and not weakLongEntry )
isNewWeakBuy = enhancedLongEntry and weakLongEntry and not (enhancedLongEntry and weakLongEntry )
isNewStrongSell = enhancedShortEntry and not weakShortEntry and not (enhancedShortEntry and not weakShortEntry )
isNewWeakSell = enhancedShortEntry and weakShortEntry and not (enhancedShortEntry and weakShortEntry )
// Helper functions to check candlestick type
isCurrentCandleBullish = close > open
isCurrentCandleBearish = close < open
// Strong Buy: Gold dot (only on bullish candles)
plotshape(isNewStrongBuy and isCurrentCandleBullish ? close : na, title="Strong B", location=location.absolute, color=strongBuyDotColor, style=shape.circle, size=size.tiny)
// Weak Buy: Solid Green dot (no candlestick filter for weak buys)
// Changed text to "" and style to shape.triangleup for symbol only
plotshape(isNewWeakBuy ? close : na, title="Weak B", location=location.absolute, color=weakBuyDotColor, style=shape.triangleup, size=size.tiny)
// Strong Sell: White dot (only on bearish candles)
plotshape(isNewStrongSell and isCurrentCandleBearish ? close : na, title="Strong S", location=location.absolute, color=strongSellDotColor, style=shape.circle, size=size.tiny)
// Weak Sell: Red dot (no candlestick filter for weak sells)
// Changed text to "" and style to shape.triangledown for symbol only
plotshape(isNewWeakSell ? close : na, title="Weak S", location=location.absolute, color=weakSellDotColor, style=shape.triangledown, size=size.tiny)
// --- Plotting Indicators (Optional, for visual confirmation) ---
// All indicator plots have been removed as requested.
// plot(ema11, title="EMA 11", color=emaColor)
// plot(tenkanSen, title="Tenkan-Sen", color=tenkanColor)
// plot(kijunSen, title="Kijun-Sen", color=kijunColor)
// plot(senkouSpanA_plot, title="Senkou Span A", color=senkouAColor, offset=displacement)
// plot(senkouSpanB_plot, title="Senkou Span B", color=senkouBColor, offset=displacement)
// fill(plot(senkouSpanA_plot, offset=displacement), plot(senkouSpanB_plot, offset=displacement), color=cloudFillBullishColor, title="Cloud Fill Bullish")
// fill(plot(senkouSpanA_plot, offset=displacement), plot(senkouSpanB_plot, offset=displacement), color=cloudFillBearishColor, title="Cloud Fill Bearish")
// plot(chikouSpan, title="Chikou Span", color=chikouColor, offset=-displacement)
// plot(macdLine, title="MACD Line", color=macdLineColor, display=display.pane)
// plot(signalLine, title="Signal Line", color=signalLineColor, display=display.pane)
// plot(hist, title="Histogram", color=hist >= 0 ? histGreenColor : histRedColor, style=plot.style_columns, display=display.pane)
// plot(rsi, title="RSI", color=rsiPlotColor, display=display.pane)
// hline(rsiOverbought, "RSI Overbought", color=rsiHlineRedColor, linestyle=hline.style_dashed, display=display.all)
// hline(rsiOversold, "RSI Oversold", color=rsiHlineGreenColor, linestyle=hline.style_dashed, display=display.all)
// plot(adx, title="ADX", color=adxPlotColor, display=display.pane)
// hline(adxTrendStrengthThreshold, "ADX Threshold", color=adxHlineColor, linestyle=hline.style_dashed, display=display.all)
// plot(diPlus, title="+DI", color=diPlusColor, display=display.pane)
// plot(diMinus, title="-DI", color=diMinusColor, display=display.pane)
// plot(dailyPP, title="Daily PP", color=dailyPPColor, style=plot.style_line, linewidth=1)
// plot(dailyR1, title="Daily R1", color=dailyRColor, style=plot.style_line, linewidth=1)
// plot(dailyR2, title="Daily R2", color=dailyRColor, style=plot.style_line, linewidth=1)
// plot(dailyS1, title="Daily S1", color=dailySColor, style=plot.style_line, linewidth=1)
// plot(dailyS2, title="Daily S2", color=dailySColor, style=plot.style_line, linewidth=1)
// --- Alerts (Optional) ---
alertcondition(enhancedLongEntry and not weakLongEntry, title="Strong Buy Alert", message="CME Crude Oil: Strong Buy Entry!")
alertcondition(enhancedLongEntry and weakLongEntry, title="Weak Buy Alert", message="CME Crude Oil: Weak Buy Entry Detected!")
alertcondition(enhancedShortEntry and not weakShortEntry, title="Strong Sell Alert", message="CME Crude Oil: Strong Sell Entry!")
alertcondition(enhancedShortEntry and weakShortEntry, title="Weak Sell Alert", message="CME Crude Oil: Weak Sell Entry Detected!")

EMAs + LSMA Cross Alert (Mejorado)his indicator is designed to identify buy and sell signals based on the behavior of multiple exponential moving averages (EMAs) and a Least Squares Moving Average (LSMA). It includes 5 EMAs and one LSMA, with visual and alert features.
📌 Components:
EMA 4 (purple)
EMA 9 (Fuchsia)
EMA 21 (blue)
EMA 50 (Green)
EMA 200 (maroon)
LSMA 30 (Orange)
🔍 Signal Logic:
✅ Buy Signal:
The LSMA (30) must be below both EMA 4 and EMA 9.
A bullish crossover occurs: EMA 4 crosses above EMA 9.
Only one signal is triggered per crossover, avoiding repeated alerts during trend continuation.
❌ Sell Signal:
The LSMA (30) must be above both EMA 4 and EMA 9.
A bearish crossover occurs: EMA 4 crosses below EMA 9.
Only one signal is triggered per crossover, avoiding repeated alerts during trend continuation.
🖥️ Visual Features:
Option to show/hide each EMA and the LSMA.
Buy/Sell markers appear at cross points.
A white background highlight marks the candle where the signal occurs (optional).
Visuals scale dynamically with the chart zoom and axes.
🔔 Alerts:
Custom alert conditions for Buy and Sell.
Alerts can trigger push notifications to the TradingView mobile app, email, or webhook.
Configured to avoid repeating alerts unless the trend resets and a new valid crossover occurs.

Normalized Reserve Risk (Proxy Z-Score)normalised version of the reserve risk indicator on btc magazine because the btc magazine one is poo .

Zonas de Soporte EURUSD Multi-Timeframe//@version=5
indicator("Zonas de Soporte EURUSD Multi-Timeframe", overlay=true)
// Configuraciones
lookback = input.int(200, "Velas a analizar", minval=50)
tolerance = input.float(0.5, "Tolerancia %", minval=0.1)
touchesMin = input.int(3, "Toques mínimos para validar soporte", minval=2)
// Función para encontrar zonas de soporte
f_findSupportZones(_low, _label) =>
var float zones = na
var int found = 0
for i = 0 to lookback - 1
float base = _low
int touches = 0
for j = i + 1 to lookback - 1
if math.abs(_low - base) <= base * (tolerance / 100)
touches := touches + 1
if touches >= touchesMin
label.new(bar_index , base, text="Zona " + _label + " " + str.tostring(base, format.mintick),
style=label.style_label_up, color=color.green, textcolor=color.white, size=size.small)
found := found + 1
found
// Múltiples temporalidades
low_h1 = request.security("EURUSD", "60", low)
low_h4 = request.security("EURUSD", "240", low)
low_d1 = request.security("EURUSD", "D", low)
low_w1 = request.security("EURUSD", "W", low)
low_mn1 = request.security("EURUSD", "M", low)
// Llamadas a la función
zonesH1 = f_findSupportZones(low_h1, "H1")
zonesH4 = f_findSupportZones(low_h4, "H4")
zonesD1 = f_findSupportZones(low_d1, "D1")
zonesW1 = f_findSupportZones(low_w1, "W1")
zonesMN1 = f_findSupportZones(low_mn1, "MN1")
// Reporte
if bar_index % 50 == 0
label.new(bar_index, high, text="Reporte Zonas Soporte H1: "+str.tostring(zonesH1)+" H4: "+str.tostring(zonesH4)+" D1: "+str.tostring(zonesD1)+" W1: "+str.tostring(zonesW1)+" MN1: "+str.tostring(zonesMN1),
style=label.style_label_down, yloc=yloc.abovebar, size=size.normal,
textcolor=color.black, color=color.new(color.white, 80))

My script//@version=5
indicator("MA + OI + Volume Breakout", overlay=true)
// === MA Parameters ===
ma_type = input.string("EMA", title="MA Type", options= )
ma(src, len, type) =>
type == "SMA" ? ta.sma(src, len) :
type == "EMA" ? ta.ema(src, len) :
ta.wma(src, len)
ma5 = ma(close, 5, ma_type)
ma21 = ma(close, 21, ma_type)
ma50 = ma(close, 50, ma_type)
ma100 = ma(close, 100, ma_type)
plot(ma5, "5-day MA", color=color.yellow, linewidth=2)
plot(ma21, "21-day MA", color=color.orange, linewidth=2)
plot(ma50, "50-day MA", color=color.fuchsia, linewidth=2)
plot(ma100, "100-day MA", color=color.blue, linewidth=2)
// === Trend Signal ===
bullish_trend = ma5 > ma21 and ma21 > ma50 and ma50 > ma100
bearish_trend = ma5 < ma21 and ma21 < ma50 and ma50 < ma100
bgcolor(bullish_trend ? color.new(color.green, 85) : bearish_trend ? color.new(color.red, 85) : na)
// === Volume Breakout ===
vol_avg = ta.sma(volume, 20)
vol_breakout = volume > 1.5 * vol_avg
plotshape(vol_breakout, title="Volume Breakout", location=location.belowbar, style=shape.circle, color=color.aqua, size=size.tiny)
// === Open Interest Overlay (assumes OI data via external input or future integration) ===
// Placeholder: simulate OI input (replace with `request.security(syminfo.tickerid, ..., ...)` if available)
oi = input.float(na, title="Open Interest (external feed)")
oi_avg = ta.sma(oi, 20)
oi_breakout = oi > 1.2 * oi_avg
plotshape(not na(oi) and oi_breakout, title="OI Spike", location=location.belowbar, style=shape.diamond, color=color.purple, size=size.tiny)
plot(oi, title="Open Interest", color=color.gray, display=display.none) // Optional: hidden line for alerts
// === Composite Signal ===
strong_long = bullish_trend and vol_breakout and oi_breakout
plotshape(strong_long, title="Strong Long Signal", location=location.belowbar, style=shape.labelup, text="LONG", size=size.small, color=color.lime)
// === Screener Logic ===
// Use `strong_long` as your filter condition in a screener or dashboard output

Previous 10 Weekly Highs/Lows z s s bsf bsfd sfdv svdvvdsfvsdvsddvbadvvf zfvdzcxvdsfzv dfcvfdcxvsfdzvzdsfcx


VWAP SlopePositive (green) bars mean today’s (or this interval’s) VWAP is higher than the prior one → volume‐weighted average price is drifting up → bullish flow.
Negative (red) bars mean VWAP is lower than before → volume is skewed to sellers → bearish flow.
Bar height shows how much VWAP has shifted, so taller bars = stronger conviction.
Why it’s useful:
It gives you a real-time read on whether institutions are consistently buying at higher prices or selling at lower prices.
Use it as a bias filter: for shorts you want to see red bars (VWAP down-slope) at your entry, and for longs green bars (VWAP up-slope).
Because it updates tick-by-tick (or per bar), you get a live snapshot of volume-weighted momentum on top of your price‐action and oscillator signals.

Momentum SNR VIP [INDICATOR ONLY]//@version=6
indicator("Momentum SNR VIP ", overlay=true)
// === Inputs ===
lookback = input.int(20, "Lookback for S/R", minval=5)
rr_ratio = input.float(2.0, "Risk-Reward Ratio", minval=0.5, step=0.1)
// === SNR Detection ===
pivotHigh = ta.pivothigh(high, lookback, lookback)
pivotLow = ta.pivotlow(low, lookback, lookback)
supportZone = not na(pivotLow)
resistanceZone = not na(pivotHigh)
plotshape(supportZone, title="Support", location=location.belowbar, color=color.blue, style=shape.triangleup, size=size.tiny)
plotshape(resistanceZone, title="Resistance", location=location.abovebar, color=color.red, style=shape.triangledown, size=size.tiny)
// === Price Action ===
bullishEngulfing = close < open and close > open and close > open and open <= close
bearishEngulfing = close > open and close < open and close < open and open >= close
bullishPinBar = close < open and (low - math.min(open, close)) > 1.5 * math.abs(close - open)
bearishPinBar = close > open and (high - math.max(open, close)) > 1.5 * math.abs(close - open)
buySignal = supportZone and (bullishEngulfing or bullishPinBar)
sellSignal = resistanceZone and (bearishEngulfing or bearishPinBar)
// === SL & TP ===
buySL = low - 10
buyTP = close + (close - buySL) * rr_ratio
sellSL = high + 10
sellTP = close - (sellSL - close) * rr_ratio
// === Plot Signals
plotshape(buySignal, title="Buy Signal", location=location.belowbar, color=color.green, style=shape.labelup, text="BUY")
plotshape(sellSignal, title="Sell Signal", location=location.abovebar, color=color.red, style=shape.labeldown, text="SELL")
plot(buySignal ? buySL : na, title="Buy SL", color=color.red, style=plot.style_linebr, linewidth=1)
plot(buySignal ? buyTP : na, title="Buy TP", color=color.green, style=plot.style_linebr, linewidth=1)
plot(sellSignal ? sellSL : na, title="Sell SL", color=color.red, style=plot.style_linebr, linewidth=1)
plot(sellSignal ? sellTP : na, title="Sell TP", color=color.green, style=plot.style_linebr, linewidth=1)
// === Labels (Fixed)
if buySignal
label.new(x=bar_index, y=buySL, text="SL : " + str.tostring(buySL, "#.00"), style=label.style_label_down, color=color.red, textcolor=color.white)
label.new(x=bar_index, y=buyTP, text="TP 1 : " + str.tostring(buyTP, "#.00"), style=label.style_label_up, color=color.green, textcolor=color.white)
if sellSignal
label.new(x=bar_index, y=sellSL, text="SL : " + str.tostring(sellSL, "#.00"), style=label.style_label_up, color=color.red, textcolor=color.white)
label.new(x=bar_index, y=sellTP, text="TP 1 : " + str.tostring(sellTP, "#.00"), style=label.style_label_down, color=color.green, textcolor=color.white)
// === Alerts
alertcondition(buySignal, title="Buy Alert", message="🟢 BUY at Support Zone + Price Action")
alertcondition(sellSignal, title="Sell Alert", message="🟡 SELL at Resistance Zone + Price Action")

Auto-Length Anchored Multiple EMA (Hour-Based)# Auto-Length Anchored Multiple EMA (Hour-Based)
## Overview
This advanced EMA indicator automatically calculates Exponential Moving Average lengths based on the time elapsed since user-defined anchor dates. Unlike traditional fixed-length EMAs, this indicator dynamically adjusts EMA periods based on actual trading hours, making it ideal for event-based analysis and time-sensitive trading strategies.
## Key Features
### 🎯 **Dual Mode Operation**
- **Auto Mode**: EMA length automatically calculated from anchor date to current time
- **Manual Mode**: Traditional fixed-length EMA calculation
- Switch between modes independently for each EMA
### 📊 **Multiple EMA Support**
- Up to 4 independent EMAs with individual configurations
- Each EMA can have its own anchor date and settings
- Individual enable/disable controls for each EMA
### ⏰ **Smart Time Calculation**
- Accounts for actual trading hours (customizable)
- Weekend exclusion with Saturday trading option (for markets like NSE/BSE)
- Hour multiplier for fine-tuning EMA sensitivity
- Minimum EMA length protection to prevent calculation errors
### 🎨 **Visual Enhancements**
- **Dynamic Fill Colors**: Fill between EMA1 and EMA3 changes color based on price position
- **Customizable Colors**: Individual color settings for each EMA
- **Anchor Visualization**: Optional vertical lines and labels at anchor dates
- **Real-time Table**: Shows current EMA lengths, modes, and values
## Configuration Options
### Trading Session Settings
- **Trading Hours Per Day**: Set your market's trading hours (1-24)
- **Trading Days Per Week**: Configure for different markets (5 for Mon-Fri, 6 for Mon-Sat)
- **Include Saturday**: Enable for markets that trade on Saturday
- **Hour Multiplier**: Fine-tune EMA sensitivity (0.1x to 10x)
### EMA Configuration
- **Anchor Dates**: Set specific start dates for each EMA calculation
- **Manual Lengths**: Override with traditional fixed periods when needed
- **Enable/Disable**: Individual control for each EMA
- **Color Customization**: Personalize appearance for each EMA
### Visual Options
- **Fill Settings**: Toggle and customize fill colors between EMAs
- **Anchor Lines**: Show vertical lines at anchor dates
- **Anchor Labels**: Display formatted anchor date information
- **Length Table**: Real-time display of current EMA parameters
## Use Cases
### 📈 **Event-Based Analysis**
- Anchor EMAs to earnings announcements, policy decisions, or market events
- Track price behavior relative to specific time periods
- Analyze momentum changes from key market catalysts
### 🕐 **Time-Sensitive Trading**
- Perfect for intraday strategies where timing is crucial
- Automatically adjusts to market hours and trading sessions
- Eliminates manual EMA length recalculation
### 🌍 **Multi-Market Support**
- Configurable for different global markets
- Saturday trading support for Asian markets
- Flexible trading hour settings
## Technical Details
### Calculation Method
The indicator calculates trading bars elapsed since anchor date using:
```
Total Trading Bars = (Days Since Anchor × Trading Days Per Week ÷ 7) × Trading Hours Per Day × Hour Multiplier
```
### EMA Formula
Uses standard EMA calculation with dynamically calculated alpha:
```
Alpha = 2 ÷ (Current Length + 1)
EMA = Alpha × Current Price + (1 - Alpha) × Previous EMA
```
### Weekend Handling
- Automatically excludes weekends from calculation
- Optional Saturday inclusion for specific markets
- Accurate trading day counting
## Installation & Setup
1. **Add to Chart**: Apply the indicator to your desired timeframe
2. **Set Anchor Dates**: Configure anchor dates for each EMA you want to use
3. **Adjust Trading Hours**: Set your market's trading session parameters
4. **Customize Appearance**: Choose colors and visual options
5. **Enable Features**: Turn on fills, anchor lines, and information table as needed
## Best Practices
- **Anchor Selection**: Choose significant market events or technical breakouts as anchor points
- **Multiple Timeframes**: Use different anchor dates for short, medium, and long-term analysis
- **Hour Multiplier**: Start with 1.0 and adjust based on market volatility and your trading style
- **Visual Clarity**: Use contrasting colors for different EMAs to improve readability
## Compatibility
- **Pine Script Version**: v6
- **Chart Types**: All chart types supported
- **Timeframes**: Works on all timeframes (optimal on intraday charts)
- **Markets**: Suitable for stocks, forex, crypto, and commodities
## Notes
- Indicator starts calculation from the anchor date forward
- Minimum EMA length prevents calculation errors with very recent anchor dates
- Table display updates in real-time showing current EMA parameters
- Fill colors dynamically change based on price position relative to EMA1
---
*This indicator is perfect for traders who want to combine the power of EMAs with event-driven analysis and precise time-based calculations.*

H IchimokuIchimoku Kinko Hyo (commonly called the Ichimoku Cloud) is a comprehensive technical analysis indicator developed by Japanese journalist Goichi Hosoda in the 1960s. Its name translates to “one glance equilibrium chart,” reflecting the tool’s purpose: to provide a quick, holistic view of market trend, momentum, and support/resistance levels.
The Ichimoku Cloud consists of five main components:
Tenkan-sen (Conversion Line): The average of the highest high and lowest low over the past 9 periods.
Kijun-sen (Base Line): The average of the highest high and lowest low over the past 26 periods.
Senkou Span A (Leading Span A): The average of the Tenkan-sen and Kijun-sen, plotted 26 periods ahead.
Senkou Span B (Leading Span B): The average of the highest high and lowest low over the past 52 periods, plotted 26 periods ahead.
Chikou Span (Lagging Span): The current closing price plotted 26 periods back.
The area between Senkou Span A and B forms the “cloud” (Kumo), which visually highlights key support and resistance zones. Prices above the cloud indicate an uptrend, below the cloud a downtrend, and within the cloud a consolidating or neutral market.
Ichimoku is valued for its ability to provide a broad, forward-looking perspective on price action, helping traders identify trends, momentum, and potential reversal points at a glance.

MTF_MA RibbonThis script plots a ribbon of Moving Averages for Daily, Weekly and Monthly timeframes and helps in Multi-timeframe analysis of securities for swing & positional trades. once applied to chart, the moving averages change automatically according to the selected timeframe.
Following are the default moving averages :
Daily TF EMAs: 5D, 10D, 20D
Daily TF SMAs: 50D, 100D, 150D, 200D
Weekly TF SMAs: 10W, 20W, 30W, 40W
Monthly TF SMAs: 3M, 5M, 8M, 11M

Weekly Volume USDT## Description
This Pine Script indicator displays the trading volume for each day of the current week (Monday through Sunday) in a clean table format on your TradingView chart. The volume is calculated in USDT equivalent and displayed in the top-right corner of the chart.
## Features
- **Weekly Volume Breakdown**: Shows individual daily volumes from Monday to Sunday
- **USDT Conversion**: Automatically converts volume to USDT using the average price (open + close / 2)
- **Smart Formatting**:
- Large numbers are formatted with K (thousands) and M (millions) suffixes
- Example: 1,234,567 → 1.23M USDT
- **Clean Table Display**: Fixed position table in the top-right corner
- **Current Week Focus**: Displays volumes for the current week only
- **Future Days Handling**: Days that haven't occurred yet in the current week show as "-"
## How It Works
1. The indicator calculates the average price for each day using (Open + Close) / 2
2. Multiplies the daily volume by the average price to get USDT-equivalent volume
3. Displays the results in an easy-to-read table format
## Use Cases
- **Volume Analysis**: Quickly identify which days of the week have the highest trading activity
- **Pattern Recognition**: Spot weekly volume patterns and trends
- **Trading Decisions**: Use volume information to inform your trading strategies
- **Market Activity Monitoring**: Keep track of market participation throughout the week
## Installation
Simply add this indicator to your TradingView chart and it will automatically display the weekly volume table in the top-right corner.
## Tags
#volume #weekly #USDT #table #analysis #trading #cryptocurrency

💼 Momentum SNR VIP//@version=5
indicator("Momentum", overlay=true)
// === SNR Detection ===
lookback = input.int(20, "Lookback for S/R", minval=5)
pivotHigh = ta.pivothigh(high, lookback, lookback)
pivotLow = ta.pivotlow(low, lookback, lookback)
// Plot SNR Zones
plotshape(pivotHigh, title="Resistance", location=location.abovebar, color=color.red, style=shape.triangledown, size=size.small)
plotshape(pivotLow, title="Support", location=location.belowbar, color=color.blue, style=shape.triangleup, size=size.small)
// === Price Action Detection ===
// Bullish Engulfing
bullishEngulfing = close < open and close > open and close > open and open <= close
// Bearish Engulfing
bearishEngulfing = close > open and close < open and close < open and open >= close
// Pin Bar Bullish
bullishPinBar = close > open and (low - math.min(open, close)) > 1.5 * (math.abs(close - open))
// Pin Bar Bearish
bearishPinBar = close < open and (math.max(open, close) - high) > 1.5 * (math.abs(close - open))
// === Combined Signal at SNR ===
supportZone = not na(pivotLow)
resistanceZone = not na(pivotHigh)
buySignal = (bullishEngulfing or bullishPinBar) and supportZone
sellSignal = (bearishEngulfing or bearishPinBar) and resistanceZone
// Plot Buy/Sell Arrows
plotshape(buySignal, title="Buy Signal", location=location.belowbar, color=color.green, style=shape.labelup, text="BUY")
plotshape(sellSignal, title="Sell Signal", location=location.abovebar, color=color.red, style=shape.labeldown, text="SELL")
// === SL & TP Calculation ===
rr_ratio = input.float(2.0, "Risk Reward Ratio", minval=0.5, step=0.5)
buySL = low
buyTP = close + (close - low) * rr_ratio
sellSL = high
sellTP = close - (high - close) * rr_ratio
plot(buySignal ? buySL : na, title="Buy SL", color=color.red, style=plot.style_linebr, linewidth=1)
plot(buySignal ? buyTP : na, title="Buy TP", color=color.green, style=plot.style_linebr, linewidth=1)
plot(sellSignal ? sellSL : na, title="Sell SL", color=color.red, style=plot.style_linebr, linewidth=1)
plot(sellSignal ? sellTP : na, title="Sell TP", color=color.green, style=plot.style_linebr, linewidth=1)
// === Alerts ===
alertcondition(buySignal, title="Buy Alert", message="GOLD: Potential BUY @ SNR Zone + Price Action")
alertcondition(sellSignal, title="Sell Alert", message="GOLD: Potential SELL @ SNR Zone + Price Action")

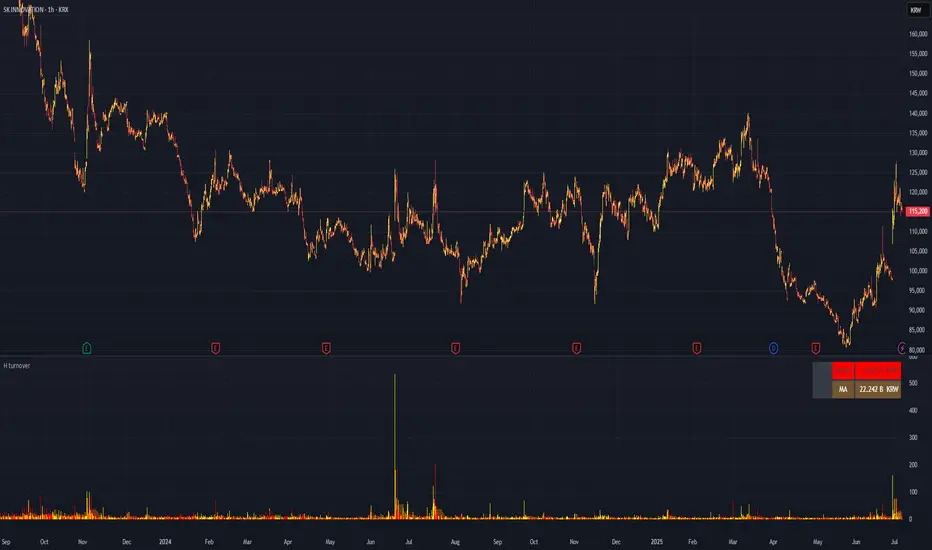
H turnoverTrading Value refers to the total monetary amount of all transactions for a particular stock or the entire market over a specific period. It is calculated by multiplying the trading volume (the number of shares traded) by the price at which they were traded. For example, if 10,000 shares of a stock are traded in a day at an average price of 50,000 KRW, the trading value for that day would be 500,000,000 KRW.
Key points about trading value:
Market Activity and Liquidity: A high trading value indicates an active and liquid market.
Flow of Investment Funds: Increasing trading value suggests more money is flowing into the market or a particular stock.
Relationship with Price Movements: When both trading value and price rise together, it often signals strong buying interest. Conversely, significant price changes with low trading value may be less reliable.
Market Sentiment Indicator: Changes in trading value can reflect shifts in investor interest and sentiment.
In summary, trading value is the total amount of money exchanged in trades and serves as an important indicator of market activity, liquidity, and investor sentiment.
Quarterly Revenue & Growthinspired by TrendSpider. Monitoring a company's earning revenue quarter by quarter.

Price × Volume Momentum (FSTO / RSI / Avg)decided to combine my PXVS and PXVR in to one script. user has the option to use FSTO, RSI, or the average between the two oscillators.
the oscillator components have been modified to range from -100 to +100 to express directional magnitude.
volume remains 0 to 100, so it can function as a direction-neutral amplifier.
The result is a bi-directional composite oscillator that:
>> Emphasizes congruent signals (e.g., strong price direction with strong volume).
>> Minimizes misleading or incongruent signals from high volume paired with neutral or conflicting price movement.
Ideal for identifying high-conviction breakouts and momentum divergences with volume support.

RSI EMA9 + WMA45The Relative Strength Index (RSI) is one of the most popular momentum oscillators used by traders. It's so widely adopted that every charting software package and professional trading system worldwide includes it as a core indicator. Not only is this indicator included in every charting package, but it's also highly likely to be part of the default settings in every system.

Engulfing Swing Low Strategy Indicatorcisd with fvg entry model on the 1min this will help with finding the swing low and helping those struggling.
