Previous 2 Days High/LowCan you give me a summary of this indicator
The "Previous 2 Days High/Low" indicator, written in Pine Script v5 for TradingView, plots horizontal lines representing the combined high and low prices of the previous two trading days on a chart. Here's a summary of its functionality, purpose, and key features:
Purpose
The indicator helps traders identify significant price levels by displaying the highest high and lowest low from the previous two days, which can act as potential support or resistance levels. These levels are plotted as lines that extend across the current trading day, making it easier to visualize key price zones for trading decisions.
Key Features
Calculates Combined High and Low:
Retrieves the high and low prices of the previous day and the day before using request.security on the daily timeframe ("D").
Computes the combined high as the maximum of the two days' highs and the combined low as the minimum of the two days' lows.
Dynamic Line Plotting:
Draws two horizontal lines:
Red Line: Represents the combined high, plotted at the highest price of the previous two days.
Green Line: Represents the combined low, plotted at the lowest price of the previous two days.
Lines are created at the start of a new trading day and extended to the right edge of the chart using line.set_x2, ensuring they span the entire current day.
Labels for Clarity:
Adds labels to the right of the chart, displaying the exact price values of the combined high ("Combined High: ") and combined low ("Combined Low: ").
Labels are updated to move with the lines, maintaining alignment at the current bar.
Clutter Prevention:
Deletes old lines and labels at the start of each new trading day to avoid overlapping or excessive objects on the chart.
Dynamic Requests:
Uses dynamic_requests=true in the indicator() function to allow request.security calls within conditional blocks (if ta.change(time("D"))), enabling daily data retrieval within the script's logic.
Indicators and strategies
Closed Market / Back-Test Filter x 'Bull_Trap_9'Hello TradingView Traders!
This is a very valuable tool that I believe all traders will find useful.
This indicator / filter is '1 of 2'. I prefer it as a filter because it is not meant for live trade analysis. It is designed to make a trader aware of their individual trade sessions and to help aid in static chart candlestick back-testing.
Also, look for my indicator / filter, '2 of 2': 'Red Report Filter'
There are two functions to this filter.
Primary use: It allows a trader to set a session window: Open / Close.
During a trade session, like YM, I only trade 9:30 - 15:00. Without the filter, many times I have traded past my cutoff because I was focused on the chart and not the time.
With this filter on as close nears with an open trade and the filter starts to apply, I know I am at session close with no more trades upon exit. Otherwise, I know the session is done with no further trades.
It is also nice to have the filter on during the session open as a demarcation boundary.
Secondary use: It is used as a chart back-test tool.
When applied to a traders back-test chart, the trader can control their trade session envelopes for easier and more precise evaluation. The filter will allow only the candles per session that the trader wants to focus on and will filter all other non-session candles.
I can easily compare a whole week of 30m session data, concentrating solely on the filtered trade windows.
Please Note: The filter will be active as far back as the historic data prints.
Thanks for viewing!

Bollinger Bands Levels | VTS Pro📊 Bollinger Bands Levels | VTS Pro
by Alireza Mossaheb
This advanced Bollinger Bands indicator takes your technical analysis to the next level by providing dynamic price bands along with customizable horizontal levels and labels. Whether you're a trend trader or a mean reversion strategist, this tool adapts to your workflow.
🔧 Key Features:
Three Modes: Choose between Strong (20, 2), Weak (10, 1.5), or Custom settings for full control.
Multi-Timeframe Support: Plot Bollinger Bands from any higher or lower timeframe.
Multiple MA Types: Select from SMA, EMA, RMA (SMMA), WMA, and VWMA for the basis line.
Visual Enhancements:
Optional background fill between bands
Stylized horizontal lines with labels (Top/Mid/Low)
Customizable line style, width, and color
Smart Labeling: Automatically names levels based on timeframe and mode.
Improved Plot Logic: Line width bug fixed for smoother rendering across presets.
🧠 Ideal For:
Spotting volatility squeezes or expansions
Confirming support/resistance with upper/lower bands
Creating confluence zones using higher timeframe Bollinger levels

Rapid Candle PATTERNS V2.0Indicator Title: Rapid Candle Patterns - High-Probability Signals
Description
Tired of noisy charts filled with weak and ambiguous candlestick patterns? The Rapid Candle Patterns indicator is engineered to solve this problem by moving beyond simple textbook definitions. It identifies only high-probability reversal and continuation signals by focusing on the underlying market dynamics: momentum, liquidity, and confirmation.
This is not just another pattern indicator; it's a professional-grade tool designed to help you spot truly significant price action events.
How The Logic Works & Why It's More Accurate
Each pattern in this script has been enhanced with stricter, more intelligent rules to filter out noise and reduce false signals. Here’s what makes our logic superior:
1. The Liquidity Grab Hammer & Inverted Hammer
Standard Logic: A simple hammer shows a long lower wick, suggesting buyers pushed the price back up.
Our Enhanced Logic: We don't just look for a hammer shape. Our signal is only valid if the hammer’s low takes out the low of the previous candle (a "liquidity grab" or "stop hunt").
Why It's More Accurate: This sequence is incredibly powerful. It shows that sellers attempted to push the market lower, triggered stop-loss orders below the prior low, and then were decisively overpowered by buyers who reversed the price. This isn't just a reversal; it's a failed breakdown, often trapping sellers and fueling a stronger move in the opposite direction.
2. The "True" Bullish & Bearish Harami
Standard Logic: A small candle forms within the high-low range of the previous candle. This can often be misleading if the prior candle has long wicks and a tiny body.
Our Enhanced Logic: We enforce a "dual containment" rule. For a Harami to be valid, its body must be contained within the body of the previous candle. We also ensure the Harami candle itself is not a Doji, meaning it must show some conviction.
Why It's More Accurate: This ensures you are seeing a genuine and significant contraction in momentum. It filters out scenarios where a large-bodied candle forms inside the wicks of a doji-like candle, which is not a true Harami. Our logic captures the "pregnant" pattern as it was intended—a moment of quiet consolidation before a potential new move.
3. The "Power" Bullish & Bearish Engulfing
Standard Logic: A candle's body engulfs the body of the previous candle. This is a common signal, but it often lacks follow-through.
Our Enhanced Logic: Our "Power Engulfing" requires two conditions: (1) The body must engulf the prior candle's body, AND (2) the candle must close beyond the entire high/low range of the prior candle.
Why It's More Accurate: This is the ultimate sign of confirmation. It doesn't just show that one side has won the battle for the session; it proves they had enough force to break the entire structure of the previous candle. This signifies immense momentum and dramatically increases the probability that the trend will continue in the direction of the engulfing candle.
4. The Quantified Doji
Our Logic: Instead of being a subjective pattern, a Doji is defined quantitatively. It's a candle whose body is less than or equal to a user-defined percentage (default 9%) of its total range.
Why It's More Accurate: It provides a consistent and objective measure of market indecision. Furthermore, any candle identified as a Doji is automatically disqualified from being a Hammer, ensuring clear and distinct signals.
User Customization
Toggle Patterns On/Off: Declutter your chart by only showing the patterns you want to see.
Fine-Tune Logic: Use the "Pattern Logic" settings to adjust the sensitivity of the Doji and Harami detectors to perfectly match your trading style, asset, and timeframe.
Disclaimer: This indicator is a powerful tool for identifying high-probability price action. However, no single indicator is a complete trading system. Always use these signals as part of a comprehensive strategy, combined with analysis of market structure, support/resistance levels, and other forms of confluence.

Bollinger Bands Entry/Exit ThresholdsBollinger Bands Entry/Exit Thresholds
Author of enhancements: chuckaschultz
Inspired and adapted from the original 'Bollinger Bands Breakout Oscillator' by LuxAlgo
Overview
Pairs nicely with Contrarian 100 MA
The Bollinger Bands Entry/Exit Thresholds is a powerful momentum-based indicator designed to help traders identify potential entry and exit points in trending or breakout markets. By leveraging Bollinger Bands, this indicator quantifies price deviations from the bands to generate bullish and bearish momentum signals, displayed as an oscillator. It includes customizable entry and exit signals based on user-defined thresholds, with visual cues plotted either on the oscillator panel or directly on the price chart.
This indicator is ideal for traders looking to capture breakout opportunities or confirm trend strength, with flexible settings to adapt to various markets and trading styles.
How It Works
The Bollinger Bands Entry/Exit Thresholds calculates two key metrics:
Bullish Momentum (Bull): Measures the extent to which the price exceeds the upper Bollinger Band, expressed as a percentage (0–100).
Bearish Momentum (Bear): Measures the extent to which the price falls below the lower Bollinger Band, also expressed as a percentage (0–100).
The indicator generates:
Long Entry Signals: Triggered when the bearish momentum (bear) crosses below a user-defined Long Threshold (default: 40). This suggests weakening bearish pressure, potentially indicating a reversal or breakout to the upside.
Exit Signals: Triggered when the bullish momentum (bull) crosses below a user-defined Sell Threshold (default: 80), indicating a potential reduction in bullish momentum and a signal to exit long positions.
Signals are visualized as tiny colored dots:
Long Entry: Blue dots, plotted either at the bottom of the oscillator or below the price bar (depending on user settings).
Exit Signal: White dots, plotted either at the top of the oscillator or above the price bar.
Calculation Methodology
Bollinger Bands:
A user-defined Length (default: 14) is used to calculate an Exponential Moving Average (EMA) of the source price (default: close).
Standard deviation is computed over the same length, multiplied by a user-defined Multiplier (default: 1.0).
Upper Band = EMA + (Standard Deviation × Multiplier)
Lower Band = EMA - (Standard Deviation × Multiplier)
Bull and Bear Momentum:
For each bar in the lookback period (length), the indicator calculates:
Bullish Momentum: The sum of positive deviations of the price above the upper band, normalized by the total absolute deviation from the upper band, scaled to a 0–100 range.
Bearish Momentum: The sum of positive deviations of the price below the lower band, normalized by the total absolute deviation from the lower band, scaled to a 0–100 range.
Formula:
bull = (sum of max(price - upper, 0) / sum of abs(price - upper)) * 100
bear = (sum of max(lower - price, 0) / sum of abs(lower - price)) * 100
Signal Generation:
Long Entry: Triggered when bear crosses below the Long Threshold.
Exit: Triggered when bull crosses below the Sell Threshold.
Settings
Length: Lookback period for EMA and standard deviation (default: 14).
Multiplier: Multiplier for standard deviation to adjust Bollinger Band width (default: 1.0).
Source: Input price data (default: close).
Long Threshold: Bearish momentum level below which a long entry signal is generated (default: 40).
Sell Threshold: Bullish momentum level below which an exit signal is generated (default: 80).
Plot Signals on Main Chart: Option to display entry/exit signals on the price chart instead of the oscillator panel (default: false).
Style:
Bullish Color: Color for bullish momentum plot (default: #f23645).
Bearish Color: Color for bearish momentum plot (default: #089981).
Visual Features
Bull and Bear Plots: Displayed as colored lines with gradient fills for visual clarity.
Midline: Horizontal line at 50 for reference.
Threshold Lines: Dashed green line for Long Threshold and dashed red line for Sell Threshold.
Signal Dots:
Long Entry: Tiny blue dots (below price bar or at oscillator bottom).
Exit: Tiny white dots (above price bar or at oscillator top).
How to Use
Add to Chart: Apply the indicator to your TradingView chart.
Adjust Settings: Customize the Length, Multiplier, Long Threshold, and Sell Threshold to suit your trading strategy.
Interpret Signals:
Enter a long position when a blue dot appears, indicating bearish momentum dropping below the Long Threshold.
Exit the long position when a white dot appears, indicating bullish momentum dropping below the Sell Threshold.
Toggle Plot Location: Enable Plot Signals on Main Chart to display signals on the price chart for easier integration with price action analysis.
Combine with Other Tools: Use alongside other indicators (e.g., trendlines, support/resistance) to confirm signals.
Notes
This indicator is inspired by LuxAlgo’s Bollinger Bands Breakout Oscillator but has been enhanced with customizable entry/exit thresholds and signal plotting options.
Best used in conjunction with other technical analysis tools to filter false signals, especially in choppy or range-bound markets.
Adjust the Multiplier to make the Bollinger Bands wider or narrower, affecting the sensitivity of the momentum calculations.
Disclaimer
This indicator is provided for educational and informational purposes only.

TTP-BB-vwap-PivotTTP-BB-Vwap-Pivot is a comprehensive all-in-one technical analysis indicator designed specifically for intraday traders. This powerful tool combines multiple essential indicators in a single, customizable package, eliminating the need to clutter your chart with separate indicators.
🎯 Key Features
📈 Bollinger Bands
Fully Customizable: Adjust length (default: 20) and multiplier (default: 2.0)
Source Selection: Choose from Open, High, Low, Close, HL2, HLC3, OHLC4
Visual Fill: Semi-transparent band fill for better visualization
Toggle Control: Easy on/off switch
💰 VWAP (Volume Weighted Average Price)
Intraday Focus: Perfect for identifying institutional price levels
Source Customization: Default HLC3 with options for other price sources
Clear Visualization: Prominent white line for easy identification
Toggle Control: Show/hide as needed
🎪 Standard Pivot Points
Complete Pivot System: Shows Pivot Point + 3 Resistance (R1-R3) + 3 Support (S1-S3) levels
Timeframe Flexibility: Default daily pivots with customizable timeframe
Colour Coded: Yellow for Pivot Point, Red for Resistance, Green for Support
Value Labels: Exact price values displayed on the right
Toggle Control: Enable/disable entire pivot system
📊 Multiple EMA System (5 EMAs Available)
EMA 1: 9-period (Blue) - Short-term trend
EMA 2: 21-period (Red) - Medium-term trend
EMA 3: 50-period (Orange) - Long-term trend
EMA 4: 100-period (Purple) - Major trend
EMA 5: 200-period (Yellow) - Primary trend
Each EMA Features:
Individual toggle switches
Customizable period lengths
Source selection options
Colour customization
Independent control
🚨 Built-in Alerts
Price crossing above/below EMA1
Price crossing above/below VWAP
Easy alert setup for key signal points
🎛️ User-Friendly Interface
Organized Input Groups: All settings categorized for easy navigation
Individual Controls: Turn any indicator on/off independently
Clean Design: Optimized to avoid chart clutter
Performance Optimized: Efficient code for smooth operation
📈 Perfect For:
Day Traders: Quick intraday signals and levels
Swing Traders: Multiple timeframe analysis
Scalpers: Fast entry/exit points
All Skill Levels: From beginners to professionals
🔧 How to Use:
Add the indicator to your chart
Access settings through the indicator's style/inputs panel
Enable/disable indicators based on your trading strategy
Customize colours, periods, and sources to match your preferences
Set up alerts for key crossover signals
💡 Trading Applications:
Trend Identification: Multiple EMA crossovers
Support/Resistance: Pivot points and Bollinger Bands
Entry/Exit Signals: VWAP and EMA interactions
Risk Management: Clear levels for stop-loss placement
Market Structure: Institutional levels via VWAP and Pivots
⚡ Why Choose TTP-BB-Vwap-Pivot?
All-in-One Solution: No need for multiple separate indicators
Highly Customizable: Adapt to any trading style
Performance Optimized: Smooth operation without lag
Clean Interface: Organized settings and clear visuals
Beginner Friendly: Easy to understand and implement
Professional Grade: Suitable for serious traders
🛠️ Technical Specifications:
Pine Script v6
Overlay indicator
Optimized for all timeframes (especially intraday)
Compatible with all asset classes
No repainting
Real-time calculations
Transform your trading with TTP-BB-Vwap-Pivot - The ultimate technical analysis companion for modern traders!
Like and follow for more powerful trading tools and updates!

Momentum Trajectory Suite📈 Momentum Trajectory Suite
🟢 Overview
Momentum Trajectory Suite is a multi-faceted indicator designed to help traders evaluate trend direction, volatility conditions, and behavioral sentiment in a single consolidated view.
By combining a customizable Trajectory EMA, adaptive Bollinger Bands, and a Greed vs. Fear heatmap, this tool empowers traders to identify directional bias, measure momentum strength, and spot potential reversals or continuation setups.
🧠 Concept
This indicator merges three classic techniques:
Trend Analysis: Trajectory EMA highlights the prevailing directional momentum by smoothing price action over a customizable period.
Volatility Envelopes: Bollinger Bands adapt to dynamic price swings, showing overbought/oversold extremes and periods of contraction or expansion.
Behavioral Sentiment: A Greed vs. Fear heatmap combines RSI and MACD Histogram readings to visualize when markets are dominated by buying enthusiasm or selling pressure.
The combination is designed to help traders interpret market context more effectively than using any single component alone.
🛠️ How to Use the Indicator
Trajectory EMA:
Use the blue EMA line to assess overall trend direction.
Price closing above the EMA may indicate bullish momentum; closing below may indicate bearish bias.
Buy/Sell Signals:
Green circles appear when price crosses above the EMA (potential long entry).
Red circles appear when price crosses below the EMA (potential exit or short entry).
Bollinger Bands:
Monitor upper/lower bands for overbought and oversold price extremes.
Narrowing bands may signal upcoming volatility expansion.
Greed vs. Fear Heatmap:
Green histogram bars indicate bullish sentiment when RSI exceeds 60 and MACD Histogram is positive.
Red histogram bars indicate bearish sentiment when RSI is below 40 and MACD Histogram is negative.
Gray bars indicate neutral or mixed conditions.
Background Color Zones:
The chart background shifts to green when EMA slope is positive and red when negative, providing quick directional cues.
All inputs are adjustable in settings, including EMA length, Bollinger Band parameters, and oscillator configurations.
📊 Interpretation
Bullish Conditions:
Price above the Trajectory EMA, background green, and Greed heatmap active.
May signal trend continuation and increased buying pressure.
Bearish Conditions:
Price below the Trajectory EMA, background red, and Fear heatmap active.
May signal momentum breakdown or potential continuation to the downside.
Volatility Clues:
Wide Bollinger Bands = trending, volatile market.
Narrow Bollinger Bands = low volatility and possible breakout setup.
Signal Confirmation:
Consider combining signals (e.g., EMA crossover + Greed/Fear heatmap + Bollinger Band touch) for higher-confidence entries.
📝 Notes
The script does not repaint or use future data.
Suitable for multiple timeframes (intraday to daily).
May be combined with other confirmation tools or price action analysis.
⚠️ Disclaimer
This script is for educational and informational purposes only and does not constitute financial advice. Trading carries risk and past performance is not indicative of future results. Always perform your own due diligence before making trading decisions.

RSI Divergence (Nikko)RSI Divergence by Nikko
🧠 RSI Divergence Detector — Nikko Edition This script is an enhanced RSI Divergence detector built with Pine Script v6, modified for better visuals and practical usability. It uses linear regression to detect bullish and bearish divergences between the RSI and price action — one of the most reliable early signals in technical analysis.
✅ Improvements from the Original:
- Clean divergence lines using regression fitting.
- Optional label display to reduce clutter (Display Labels toggle).
- Adjustable line thickness (Display Line Width).
- A subtle heatmap background to highlight RSI overbought/oversold zones.
- Uses max accuracy with high calc_bars_count and custom extrapolation window.
🔍 How It Works: The script applies linear regression (least squares method) on both RSI data, and Price (close) data.
It then compares the direction of RSI vs. direction of Price over a set length. If price is making higher highs while RSI makes lower highs, it's a bearish divergence. If price is making lower lows while RSI makes higher lows, it's a bullish divergence. Additional filters (e.g., momentum and slope thresholds) are used to validate only strong divergences.
🔧 Input Parameters: RSI Length: The RSI period (default: 14). RSI Divergence Length: The lookback period for regression (default: 25). Source: Which price data to calculate RSI from (default: close). Display Labels: Show/hide “Bullish” or “Bearish” labels on the chart. Display Line Width: Adjusts how thick the plotted divergence lines appear.
📣 Alerts: Alerts are built-in for both RSI Buy (bullish divergence) and RSI Sell (bearish divergence) so you can use it in automation or notifications.
🚀 Personal Note: I’ve been using this script daily in my own trading, which is why I took time to improve both the logic and visual clarity. If you want a divergence tool that doesn't clutter your chart but gives strong signals, this might be what you're looking for.

Perfect MA Touch – Full Setup 1,3,5,7,8,9This indicator helps you track a precise candle countdown from a moving average touch, labeling key bars (1, 3, 5, 7, 8, 9) for timing entries and momentum setups — with optional coloring, alerts, and full customization.
What It Detects
1. MA Touch Trigger
The sequence starts when any selected moving average (up to 6 MAs, customizable) is touched by the candle's high/low range.
This "perfect touch" initiates the count and labels that candle as "1".
2. Candle Number Labels
After a perfect MA touch:
Candle 1 = the bar that touches the MA
Candle 3 = two bars after Candle 1
Candle 5 = the fifth bar after the touch
Candle 7 = third bar after Candle 5
Candle 8 = fourth bar after Candle 5
Candle 9 = fifth bar after Candle 5
It creates a time-based sequence you can use to anticipate reactions or momentum shifts.
3. Customization
You can:
Choose between EMA or SMA for each MA (6 total)
Set custom lengths for each MA (9, 20, 50, 100, 150, 200)
Choose which candle numbers (1, 3, 5, 7, 8, 9) to highlight
Pick font size and label color
4. Highlighting and Alerts
Highlight candles (with color) when certain bars (like 3, 5, 7) print
Alerts are available for all tracked bars (1, 3, 5, 7, 8, 9)
Use Case Example
Let’s say you want to enter trades on the 3rd candle after a perfect MA touch:
You set the script to highlight candle 3.
When a candle hits your chosen MA (say EMA 9), it’s labeled “1”.
Two bars later, bar 3 appears — giving you a timed signal to enter if price behavior aligns.
This method is especially useful when paired with:
Volume confirmation
Breakout or reversal patterns
Support/resistance or order block zones

cd_secret_candlestick_patterns_CxHi traders,
With this indicator, we aim to uncover secret candlestick formations that even advanced traders may miss—especially those that can't be detected by classic pattern indicators, unless you're a true master of candlestick patterns or candle math.
________________________________________
General Idea:
We'll try to identify candlestick patterns by regrouping candles into custom-sized segments that you define.
You might ask: “Why do I need this? I can just look at different timeframes and spot the structure anyway.” But it’s not the same.
For example, if you're using a 1-minute chart and add a higher-timeframe candle overlay (like 5-minute), the candles you see start at fixed timestamps like 0, 5, 10, etc.
However, in this indicator, we redraw new candles by grouping them from the current candle backward in batches of five.
These candles won't match the standard view—only when aligned with exact time multiples (e.g., 0 and 5 minutes) will they look the same.
In classic charts:
• You see 5-minute candles that begin every 0 and 5 minutes.
In this tool:
• You see a continuously updating set of 5 merged 1-minute candles redrawn every minute.
What about the structures forming in between those fixed timeframes?
That’s exactly what we’ll be able to detect—while also making the lower timeframe chart more readable.
________________________________________
Candle Merging:
Let’s continue with an example.
Assume we choose to merge 5 candles. Then the new candle will be formed using:
open = open
close = close
high = math.max(high , high , high , high , high)
low = math.min(low , low , low , low , low)
This logic continues backward on the chart, creating merged candles in groups of 5.
Since the selected patterns are made up of 3, 4, or 5 candles, we redraw 5 such merged candles to analyze.
________________________________________
Which Patterns Are Included?
A total of 18 bullish and bearish patterns are included.
You’ll find both widely known formations and a few personal ones I use, marked as (MeReT).
You can find the pattern list and visual reference here:
________________________________________
Entry and Filtering Suggestions:
Let me say this clearly:
Entering a trade every time a pattern forms will not make you profitable in the long run.
You need a clear trade plan and should only act when you can answer questions like:
• Where did the pattern appear?
• When and under what conditions?
It’s more effective to trade in the direction of the trend and look for setups around support/resistance, supply/demand zones, key levels, or areas confirmed by other indicators.
Whether you enter immediately after the pattern or wait for a retest is a personal choice—but risk management is non-negotiable.
One of the optional filters I’ve included is a Higher Timeframe (HTF) condition, which is my personal preference:
When enabled, the highest or lowest price among the pattern candles must match the high or low of the current HTF candle.
You can see in the image below the decrease in the number of detected patterns on the 1-minute chart when using no filter (blue labels) compared to when the 1-hour timeframe filter is applied (red labels).
Additionally, I’ve added a “protected” condition for engulfing patterns to help filter out weak classic engulf patterns.
________________________________________
Settings:
From the menu, you can configure:
• Number of candles for regrouping
• Distance between the last candle and newly drawn candles
• Show/hide options
• HTF filter toggle and timeframe selection
• Color, label placement, and text customization
• Pattern list (select which to display or trigger alerts for)
My preferred setup:
While trading on the 1-minute chart, I typically set the higher timeframe to 15m or 1H, and switch the candle count between 2 and 3 depending on the situation.
⚠️ Important note:
The “Show” and “Alert” options are controlled by a single command.
Alerts are automatically created for any pattern you choose to display.
________________________________________
What’s Next?
In future updates, I plan to add:
• Pattern success rate statistics
• Multi-broker confirmation for pattern validation
Lastly, keep in mind:
The more candles a pattern is based on, the more reliable it may be.
I'd love to hear your feedback and suggestions.
Cheerful trading! 🕊️📈

Mongoose Conflict Risk Radar v1.1 (Separate Panel) description
The Mongoose Capital: Risk Rotation Index is a macro market sentiment tool designed to detect elevated risk conditions by aggregating signals across key asset classes.
This script evaluates trend strength across 8 ETFs representing major risk-on and risk-off flows:
GLD – Gold
VIXY – Volatility
TLT – Long-Term Bonds
SPY – S&P 500
UUP – U.S. Dollar Index
EEM – Emerging Markets
SLV – Silver
FXI – China Large-Cap
Each asset is assigned a binary signal based on price position vs. its 21-period SMA (or a crossover for bonds). The signals are then totaled into a composite Risk Rotation Score, plotted as a bar graph.
How to Use
0–2 = Low risk-on behavior
3–4 = Caution / Mixed regime
5–8 = Elevated conflict or macro stress
Use this as a macro confirmation layer for trend entries, risk reduction, or allocation shifts.
Alerts
Set alerts when the index exceeds 5 to track major rotations into defensive assets.

Liquidity Point LinesLiquidity Point Lines
The "Liquidity Point Lines" indicator helps traders identify potential areas of liquidity in the market by drawing lines at specific price levels where significant "liquidation events" may have occurred. These events are determined by analyzing the MACD Histogram and identifying pivot points that suggest strong movements, which are often associated with the flushing out of short or long positions.
How It Works
This indicator leverages the MACD Histogram to gauge the strength of price momentum. It then identifies pivot highs and lows within the MACD Histogram's values. When a significant pivot is detected, the indicator interprets this as a potential "liquidity point" — a price level where a substantial amount of buy or sell orders (often due to liquidations) may have been executed.
The indicator distinguishes between:
Shorts Liquidation Points (Resistance): These are identified when the MACD Histogram registers a pivot high, suggesting a strong upward movement that could have liquidated short positions. Lines are drawn at the high price of the bar where this pivot occurred.
Longs Liquidation Points (Support): Conversely, these are identified when the MACD Histogram registers a pivot low, indicating a strong downward movement that might have liquidated long positions. Lines are drawn at the low price of the bar where this pivot occurred.
Key Features and Settings
The "Liquidity Point Lines" indicator offers extensive customization to tailor its sensitivity and visual representation:
MACD Settings for Liquidity: Configure the underlying MACD calculation with adjustable Fast Length, Slow Length, Source, Signal Smoothing, and MA Types (SMA/EMA) for both the Oscillator and Signal Line.
Liquidity Points Settings:
Pivot Lookback Left/Right: Define the number of bars to look back on either side to identify a pivot in the MACD Histogram.
Dynamic Strength Thresholds: This powerful feature allows the indicator to dynamically calculate the significance of a liquidation event. When enabled, it uses the average absolute histogram value over a specified Dynamic Threshold Lookback Period and applies Small and Medium Threshold Factors to determine the strength (Small, Medium, or Large) of the liquidity point.
Fixed Strength Thresholds: If dynamic thresholds are disabled, you can set fixed numerical values for Small and Medium Histogram Thresholds to define the strength categories.
Color & Style Customization: Assign distinct colors for Small, Medium, and Large liquidation points, choose the Line Style (Solid, Dashed, Dotted), and set the Label Text Color.
Label X Offset (To Right): Adjust the horizontal position of the liquidity point labels on your chart.
Liquidity Points Management:
Max Active Liquidity Lines: Control the maximum number of liquidity lines displayed simultaneously on your chart. Older lines are automatically removed to maintain clarity, except for lines that have been "touched" (i.e., price has interacted with that liquidity level).
Visual Interpretation
Each liquidity line is colored according to the strength of the detected liquidation event, making it easy to visually assess the potential significance of the price level. Lines extend to the right, serving as ongoing reference points. When the price interacts with a liquidity line (i.e., "touches" it), the line and its corresponding label are removed, indicating that the liquidity at that level may have been absorbed.
This indicator can be a valuable tool for identifying potential support and resistance levels, understanding market reactions to "liquidation cascades," and informing your trading decisions.

True Close – Institutional Trading Sessions (Zeiierman)█ Overview
True Close – Institutional Trading Sessions (Zeiierman) is a professional-grade session mapping tool designed to help traders align with how institutions perceive the market’s true close. Unlike the textbook “daily close” used by retail traders, institutional desks often anchor their risk management, execution benchmarks, and exposure metrics to the first hour of the next session.
This indicator visualizes that logic directly on your chart — drawing session boxes, true close levels, and time-aligned labels across Sydney, Tokyo, London, and New York. It highlights the first hour of each session, projects the institutional closing price, and builds a live dashboard that tells you which sessions are active, which are in the critical opening phase, and what levels matter most right now.
More than just a visual tool, this indicator embeds institutional rhythm directly into your workflow — giving you a window into where big players finalize yesterday’s business, rebalance exposure, and execute delayed orders. It’s not just about painting sessions on your chart — it’s about adopting the mindset of those who truly move the market. Institutions don’t settle risk at the bell; they complete it in the next session. This tool lets you see that transition in real time, giving you an edge that goes beyond candles and indicators.
█ How It Works
⚪ Session Detection Engine
Each session is identified by its own time block (e.g., 09:00–17:30 for London). Once a session opens:
A full-session box is drawn to track its range.
The first hour is highlighted separately.
Once the first hour completes, the true close line is plotted, representing the price institutions often treat as the "real" close of the prior day.
⚪ Institutional True Close Logic
The script captures the close of the first hour, not the end of the day.
This line becomes a static reference across your chart, letting you visualize how price interacts with that institutional anchor:
Rejections from it show where yesterday's flow is respected.
Breaks through it may indicate that today's flows are rewriting the narrative.
⚪ Dynamic Dashboard Table
A live table appears in the corner of your screen, showing:
Each session's active status
Whether we’re inside the first hour
The current “true close” price if available
Each cell comes with advanced tooltips giving institutional context, flow dynamics, and market microstructure insights — from rebalancing spillovers to VWAP/TWAP lag effects.
█ How to Use
⚪ Use the First-Hour Line as Your Institutional Anchor
Treat it like the price level that big funds care about. Watch how the price behaves around level. Fades, re-tests, or continuation moves often occur as the market finishes recapping yesterday’s leftover orders.
⚪ Structure Entries Around the Session Context
Are you inside the first hour? Expect more volatility, more decisive flow. After the first session hour, expect fading liquidity as the market slows down and awaits the next session to open.
█ Settings
UTC Offset – Select your preferred time zone; all sessions adjust accordingly.
Session Toggles – Enable/disable Sydney, Tokyo, London, or NY.
Box Display Options – Show/hide session background, first-hour fill, borders.
True Close Line Controls – Enable line, label, and customize width & color.
Execution Hour Labels – Optional toggle for first-hour label placement.
-----------------
Disclaimer
The content provided in my scripts, indicators, ideas, algorithms, and systems is for educational and informational purposes only. It does not constitute financial advice, investment recommendations, or a solicitation to buy or sell any financial instruments. I will not accept liability for any loss or damage, including without limitation any loss of profit, which may arise directly or indirectly from the use of or reliance on such information.
All investments involve risk, and the past performance of a security, industry, sector, market, financial product, trading strategy, backtest, or individual's trading does not guarantee future results or returns. Investors are fully responsible for any investment decisions they make. Such decisions should be based solely on an evaluation of their financial circumstances, investment objectives, risk tolerance, and liquidity needs.

Fibo_Ma with Toggleable 200 EMA Filter Fibo_MA with Toggleable 200 EMA Filter
Description:
This multi-functional indicator blends Fibonacci-based moving averages with customizable filters and visual enhancements to support various trading strategies. It offers traders the flexibility to analyze trend dynamics and potential reversal zones using multiple tools in one script.
Key Features:
🔹 Fibonacci MA Framework
Leverage a range of Fibonacci numbers (from 1 to 233) to visualize trend-based EMA lines with optional smoothing. Users can choose the moving average method (SMA, EMA, RMA, WMA, VWMA, etc.) and adjust the smoothing length for fine-tuned analysis.
🔹 VWAP and Dynamic EMA Tools
Includes VWAP and a color-coded 200 EMA that updates based on trend slope. These help visualize key dynamic support and resistance levels.
🔹 Multi-Timeframe Support
Option to switch the data source to a higher timeframe for broader trend confirmation.
🔹 Signal Highlights
Bullish and bearish signal markers based on crossovers with optional filters.
Background highlights show whether the current price is above or below a smoothed EMA line.
🔹 Customizable Filters
Enable or disable filters like:
200 EMA Position Filter (only signal when price is above or below the 200 EMA)
ATR Filter (filter out low-volatility candles)
Volume Filter (signal only on sufficient volume)
🔹 Cross Alerts & Labels
Built-in alert conditions for crossovers and customizable signal display options—labels, shapes, and background highlights.
🔹 Advanced Options
Toggle forecast line visibility and offset
Fine-tune alerts using price action relative to the smooth trend line
Optional tail and cross label display for deeper chart customization
How to Use:
This tool can support trend-following, breakout, and pullback strategies. Customize the MA types, filters, and timeframe settings to match your trading style. The script is designed for visual clarity while offering rich configurability for discretionary and system-based traders.

Morning Structure – Live 30 Min Range📝 Description:
This indicator captures the morning price structure by tracking the high and low during the first 30 minutes after market open (default: 9:30 AM to 10:00 AM, New York time).
🔧 How it works:
At market open, it begins tracking the highest high and lowest low
The high and low lines are dynamic and update in real-time during the first 30 minutes
Once the 30-minute range completes, the lines freeze at their final values
Lines extend horizontally across the rest of the session to mark the "Morning Range"
✅ Key Features:
Tracks live price action during the morning session
Freezes the structure after 30 minutes (or user-defined)
Automatically resets each new trading day
Built-in timezone setting (America/New_York) to align with standard U.S. market hours
Clean visual lines that scroll naturally with the chart
⚙️ Use Cases:
Identify morning breakout zones
Define support and resistance early in the session
Combine with breakout, fade, or range-trading strategies
⚠️ Note:
This version does not include alerts or labels, by design (clean and focused).
Those can be added easily for custom strategies.

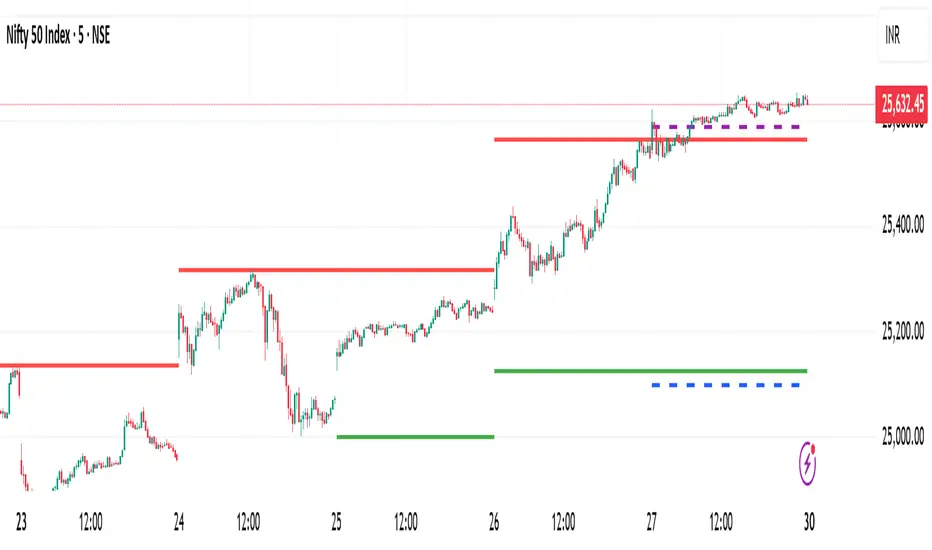
Weekly Range PlotterThe Weekly Range Plotter is a dynamic market structure tool designed to help traders visualize critical high and low levels from specific days of the week and the previous week's range. It provides key visual anchors to support analysis of market behavior, including range compression/expansion and directional bias.

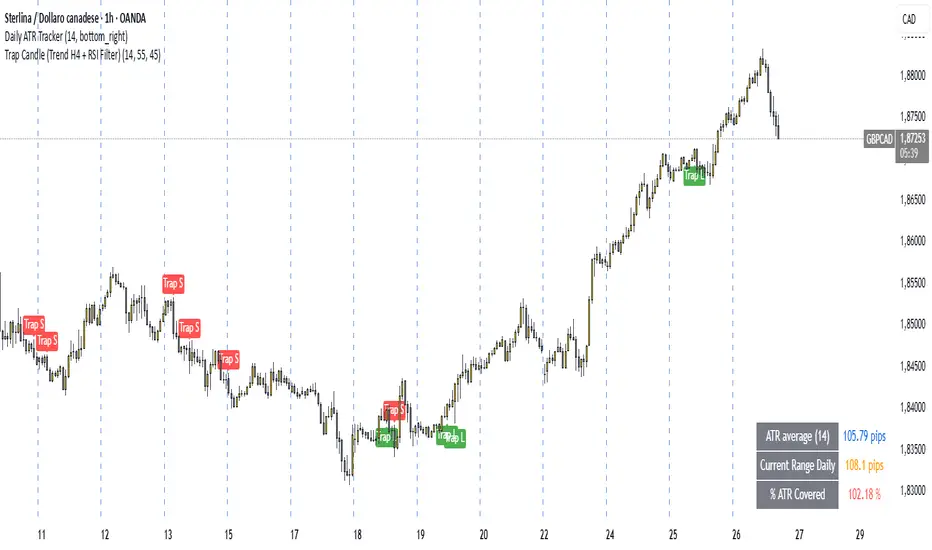
Trap Candle (Trend H4 + RSI Filter)🔍 Trap Candle (Trend H4 + RSI Filter)
Description:
The Trap Candle indicator is designed to identify a specific and powerful two-candle price action pattern that often signals a false breakout followed by a strong reversal. It combines pure price action with two objective filters to increase signal quality and trend alignment.
📊 Pattern Logic:
Bullish Trap: The current candle breaks the previous candle’s low, but closes above its high (and is bullish).
Bearish Trap: The current candle breaks the previous candle’s high, but closes below its low (and is bearish).
This pattern often reveals institutional traps or stop hunts before directional movement.
🧠 Trend Filter (H4):
Ensures long signals occur only when the H4 close is higher than the previous H4 close (uptrend).
Ensures short signals occur only in a H4 downtrend.
Designed to align intraday entries (M15, H1) with higher timeframe momentum.
💪 RSI Confirmation:
Includes a configurable RSI filter on the current timeframe.
Only long signals are shown when RSI is above a user-defined threshold (e.g. 55).
Only short signals are shown when RSI is below a user-defined threshold (e.g. 45).
⚙️ Key Features:
Full customization of RSI period and thresholds.
Clean, visual signal plotting on the chart (with “Trap L” or “Trap S” labels).
Built-in alerts for both long and short trap candle setups.
Perfect for traders who want to trade smart reversals with trend and momentum confirmation.
✅ Recommended Timeframes:
M15 and H1 (entry)
Uses H4 for trend bias
If you’re looking to filter out noise and spot only the highest quality reversal setups, the Trap Candle (Trend H4 + RSI Filter) is a solid tool for any price action-based strategy.
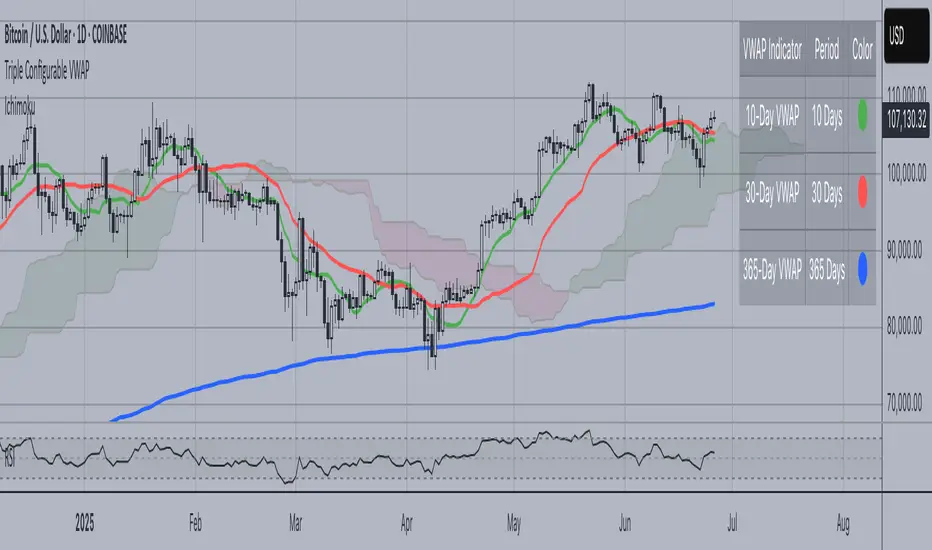
Triple Configurable VWAPTriple Configurable VWAP Indicator
This advanced VWAP (Volume Weighted Average Price) indicator displays three independently configurable VWAP lines on your chart, providing multiple timeframe perspectives for better trading decisions.
Key Features:
• Three Customizable VWAP Periods: Configure each VWAP independently with periods ranging from 1 to 365 days
Default: 10-day (Green), 30-day (Red), 365-day (Blue)
• Dynamic Visual Elements:
Color-coded lines for easy identification
Smart labels at the current price level with matching colors
Contrasting text colors for optimal readability
• Interactive Information Table:
Toggle on/off display
Repositionable to any corner or side of the chart
Shows each VWAP period with corresponding color indicators
Larger, easy-to-read font size
• Professional Calculation Method:
Uses daily timeframe data for accurate VWAP calculations
Anchored VWAP starting from your specified lookback periods
Proper volume weighting for institutional-grade accuracy
Use Cases:
Short-term Trading: 10-day VWAP for recent price action analysis
Medium-term Analysis: 30-day VWAP for monthly trend assessment
Long-term Perspective: 365-day VWAP for yearly institutional levels
Perfect for traders who need multiple VWAP timeframes simultaneously to identify key support/resistance levels, trend direction, and institutional price points across different time horizons.
First Candle🕯️ First Candle Indicator (First 5-Minute Candle High/Low)
The First Candle indicator automatically marks the high and low of the first 5-minute candle of the U.S. trading session . These levels can act as key intraday support and resistance zones, often used in breakout, scalping, or opening-range trading strategies.
📌 Key Features:
Automatic detection of the first candle of the U.S. session based on the selected timeframe (default is 5 minutes).
Horizontal lines are plotted at the high and low of that candle, with fully customizable colors and thickness.
Labels show the exact level and timeframe used for the high and low.
Resets daily, removing previous session data at the start of a new session.
Displays a visual marker (blue triangle) when the first candle is detected.
Allows users to select different timeframes for defining the "first candle" (e.g., 1, 5, 15 minutes).
⚙️ Customizable Inputs:
Show First Candle Lines: toggle the display of high/low lines.
Timeframe for Marking: choose the timeframe to detect the first candle (e.g., 5 minutes).
High Line Color / Low Line Color: set the color of each level line.
Line Thickness: adjust the width of the lines (1 to 5 pixels).
🧠 Strategic Applications:
Identify breakout zones right after the market opens.
Define opening range for pullback or continuation setups.
Set clear reference levels for intraday trading decisions.

EPS and Sales Magic Indicator V2EPS and Sales Magic Indicator V2
EPS and Sales Magic Indicator V2
Short Title: EPS V2
Author: Trading_Tomm
Platform: TradingView (Pine Script v6)
License: Free for public use under fair usage guidelines
Overview
The EPS and Sales Magic Indicator V2 is a powerful stock fundamental visualization tool built specifically for TradingView users who wish to incorporate earnings intelligence directly onto their price chart. Designed and developed by Trading_Tomm, this upgraded version of the original 'EPS and Sales Magic Indicator' includes an enriched and more insightful presentation of company performance metrics — now with TTM EPS support, advanced color-coding, label sizing, and refined control options.
This indicator is tailored for retail traders, swing investors, and long-term fundamental analysts who need to view Quarter-over-Quarter (QoQ) earnings and revenue changes directly on the price chart without switching tabs or breaking focus.
What Does It Display?
The EPS and Sales Magic Indicator V2 intelligently detects quarterly financial updates and displays the following data points via labels:
1. EPS (Earnings Per Share) – Current Quarterly Value
This is the most recent Diluted EPS published by the company, fetched using TradingView’s request.financial() function.
Displayed in the format: EPS: ₹20.45
2. EPS QoQ Percentage Change
Shows the percentage change in EPS compared to the previous quarter.
Highlights improvement or decline using arrows (up for improvement, down for decline).
Displayed in the format: EPS: ₹20.45 (up 15.3 percent)
3. Sales (Revenue) – Current Quarterly Value
Fetches and displays Total Revenue of the company in ₹Crores for easier Indian-market readability.
Displayed in the format: Sales: ₹460Cr
4. Sales QoQ Percentage Change
Measures and presents the quarter-over-quarter percentage change in total revenue.
Uses arrows to indicate growth or contraction.
Displayed in the format: Sales: ₹460Cr (down 3.8 percent)
5. EPS TTM (Trailing Twelve Months)
You now get the TTM EPS — the sum of the last four quarterly EPS values.
This value provides a better long-term earnings snapshot compared to a single quarter.
Displayed in the format: TTM EPS: ₹78.12
All of these values are automatically calculated and displayed only on the bars where a new financial report is detected, keeping your chart clean and insightful.
Customization Features
This indicator is built with user control in mind, allowing you to personalize how and what you want to see:
Show EPS in Label: Enable or disable the display of EPS and EPS QoQ values.
Show Sales in Label: Toggle the visibility of revenue and sales change percentage.
Color Options for Label Themes: The label background color is automatically determined based on performance.
Green: Both EPS and Sales increased QoQ.
Red: Both decreased.
Orange: One increased and the other decreased.
Gray: Default color (if values are unavailable or mixed).
Label Text Size: Choose from Tiny, Small (default), or Normal.
Visual Design
Placement: The labels are positioned just below the candlesticks using yloc.belowbar, so they do not obstruct price action or interfere with technical indicators.
Anchor: Aligned precisely with the financial reporting bars to maintain clarity in historical comparisons.
Background Style: Clean, semi-transparent styling with soft text colors for comfortable viewing.
How It Works
The indicator relies on TradingView’s powerful request.financial() function to extract fiscal quarterly financials (FQ). Internally, it uses detection logic to identify fresh data updates by comparing current vs. previous values, arithmetic to compute QoQ percentage changes in EPS and Sales, logic to build formatted labels dynamically based on user selections, and conditional color and sizing logic to enhance interpretability.
Use Cases
For Long-Term Investors: Quickly identify if a company’s profitability and revenue are improving over time.
For Swing Traders: Combine recent earnings trends with price action to evaluate if post-result momentum has real backing.
For Technical and Fundamental Traders: Layer it with moving averages, RSI, or volume to create a hybrid analysis environment.
Limitations and Notes
Financial data is provided by TradingView’s financial API, and occasional missing values may occur for less-covered stocks.
This tool does not repaint but depends on the timing of the official financial updates.
All values are rounded and formatted to prioritize readability.
Works best on Daily or higher timeframes (weekly or monthly also supported).
License and Fair Use
This script is free to use and share under TradingView’s open-use guidelines. You may copy, fork, and build upon this indicator for personal or educational purposes, but commercial usage requires attribution to the author: Trading_Tomm.
Future Enhancements (Planned)
Addition of Net Profit (QoQ and TTM)
Inclusion of Operating Margin, Profit Margin, and Book Value
Option to switch between numeric and graphical display (table mode)
Alerts on extreme earnings deviation or sales slumps
Final Thoughts
The EPS and Sales Magic Indicator V2 represents a clean, visual, and smart way to monitor a company’s core performance from your chart screen. It helps you align fundamental strength with technical strategies and provides instant financial clarity, which is especially vital in today’s fast-moving markets.
Whether you’re preparing for an earnings season or scanning past performance to pick your next investment, this indicator saves time, enhances insights, and sharpens decisions.

Williams VIX For Bottoms [DCD]Williams VIX Original - Authentic Volatility Fear Gauge
What This Indicator Does
The Williams VIX Fix measures market fear by calculating how far current lows deviate from recent highs, identifying potential market bottoms during high volatility periods. This implementation provides Larry Williams' original formula in its purest form.
How It Works
Core Formula:
VIX Fix = ((Highest High over 22 periods - Current Low) / Highest High over 22 periods) × 100
The calculation process:
Measures Relative Distance: Compares current low to highest high over lookback period
Converts to Percentage: Normalizes values for cross-market comparison
Applies Statistical Analysis: Uses Bollinger Bands (2 std dev) around VIX Fix values
Filters with Percentiles: 85th percentile threshold removes noise
Signal Generation
Green Flash Signals trigger when either condition is met:
VIX Fix exceeds upper Bollinger Band (2 standard deviations above 20-period MA)
VIX Fix exceeds Range High (85th percentile of recent values)
This dual-condition approach reduces false signals while capturing genuine volatility spikes.
What Makes This Original
Pure Formula Implementation: Uses Williams' exact original calculation without modifications
Dual Confirmation System: Combines Bollinger Bands with percentile analysis
Professional Visualization: Histogram display, background highlighting, and live value table
Comprehensive Alerts: Signal start/end notifications plus Green Flash alerts
How to Use
Primary Purpose: Spot high-probability reversal zones during market fear climaxes
Signal Interpretation:
Green triangle + background highlight = High volatility reversal zone
Higher VIX Fix values = Stronger fear/better reversal potential
Use with price action confirmation for best results
Optimal Settings:
Timeframes: 4H, Daily, Weekly
Markets: All (stocks, crypto, forex, commodities)
Combine with support levels and candlestick patterns
Key Parameters:
VIX Fix Length (22): Lookback period for highest high
Std Dev Multiplier (2.0): Bollinger Band sensitivity
Percentile High (0.85): Only top 15% of readings trigger signals
The VIX Fix excels at identifying market fear climaxes that coincide with significant price bottoms, making it valuable for swing traders seeking high-probability entries during market stress.

Ultimate_Priceaction_Tool for INTRADAY by Chaitu50cUltimate_Priceaction_Tool for INTRADAY by Chaitu50c
This indicator is crafted for intraday traders who rely on raw price action. It identifies support and resistance zones based on engulfing candle structures and 2-bar breakout formations. These patterns often signal meaningful reversals or momentum-based breakouts.
Key features:
• Real-time support and resistance zone detection
Uses green-to-red and red-to-green candle transitions where open and close levels align within a defined buffer. Also includes logic to capture two-bar breakout patterns that confirm directional conviction.
• Dynamic line behavior
Line width increases as the level holds for more bars, visually representing zone strength. Breakout buffers also expand with time to reduce false signals.
• Session-based resets
At the start of each new session, all zones reset automatically. This ensures only current, relevant intraday structures are shown, reducing clutter and improving focus.
• Dashed zone detection
Within the main high-low range, additional price levels are plotted as dashed lines when qualifying patterns appear. These zones are suppressed if similar ones already exist nearby.
• Fully customizable
Includes adjustable buffer range, breakout margin, dash suppression distance, line width control, and visual styling for both resistance and support zones.
Recommended usage:
This tool is optimized for the 1-minute and 5-minute timeframes. It is best suited for scalpers and intraday traders who depend on breakout reactions, pullback validation, and session structure shifts.
Use it to identify areas of interest, react to price action, and refine intraday decision-making with high precision.

CVD Strength | VTS Pro🔷 CVD Strength | VTS Pro
By Alireza Mossaheb
Description:
CVD Strength is a powerful tool designed to analyze market momentum by visualizing the Cumulative Volume Delta (CVD) using advanced techniques. This indicator provides a multi-timeframe view of volume delta behavior and highlights strong and weak bullish/bearish conditions based on volume spikes, candle size, and optional moving average filters.
Key Features:
Multi-timeframe CVD candle plotting with color-coded strength signals
Optional EMA (21), WMA (30), and SMA (50) overlays for trend filtering
Smart strength detection logic using volume, candle size, and moving average crossovers
Bullish and bearish crossover signals marked on chart
Customizable anchor and lower timeframes for flexible analysis
Alerts users when data vendor does not supply volume information
This script is particularly useful for identifying institutional buying/selling pressure and can be used effectively in both trend-following and mean-reversion strategies.
